| Param | Original file | Final file |
|---|---|---|
| Filename | modeM0/AS1A02_178T01_9000001286_09228cztM0_level2.evt | modeM0/AS1A02_178T01_9000001286_09228cztM0_level2_quad_clean.evt |
| Size (bytes) | 580,052,160 | 104,785,920 |
| Size | 553.2 MB | 99.9 MB |
| Events in quadrant A | 5,344,771 | 650,114 |
| Events in quadrant B | 3,973,267 | 664,235 |
| Events in quadrant C | 3,746,899 | 649,840 |
| Events in quadrant D | 3,937,197 | 631,363 |
| Mode SS | |||
|---|---|---|---|
| Quadrant | BADHDUFLAG | Total packets | Discarded packets |
| A | 0 | 174 | 6 |
| B | 0 | 174 | 8 |
| C | 0 | 174 | 4 |
| D | 0 | 174 | 6 |
| Mode M9 | |||
|---|---|---|---|
| Quadrant | BADHDUFLAG | Total packets | Discarded packets |
| A | 0 | 4 | 0 |
| B | 0 | 4 | 0 |
| C | 0 | 4 | 1 |
| D | 0 | 4 | 1 |
| Mode M0 | |||
|---|---|---|---|
| Quadrant | BADHDUFLAG | Total packets | Discarded packets |
| A | 0 | 22039 | 897 |
| B | 0 | 17797 | 680 |
| C | 0 | 17552 | 569 |
| D | 0 | 18213 | 742 |
| Quadrant | Total seconds | Saturated seconds | Saturation percentage |
|---|---|---|---|
| A | 8284 | 199 | 2.402221% |
| B | 8303 | 113 | 1.360954% |
| C | 8350 | 74 | 0.886228% |
| D | 8306 | 128 | 1.541055% |
Noise dominated data is calculated using 1-second bins in cleaned event files. If a bin has >2000 counts, and if more than 50% of those come from <1% of pixels, then it is considered to be noise-dominated and hence unusable.
| Quadrant | # 1 sec bins | Bins with >0 counts | Bins with >2000 counts | High rate bins dominated by noise | Noise dominated (total time) | Noise dominated (detector-on time) | Marked lightcurve |
|---|---|---|---|---|---|---|---|
| A | 9019 | 8582 | 62 | 62 | 0.69% | 0.72% | 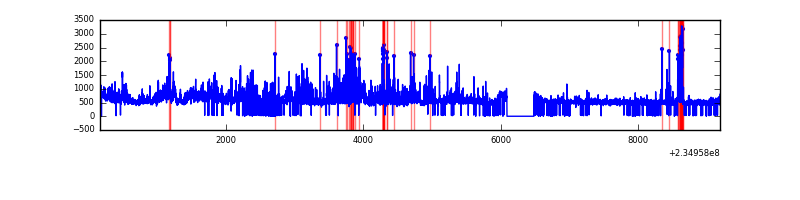 |
| B | 9019 | 8602 | 2 | 2 | 0.02% | 0.02% | 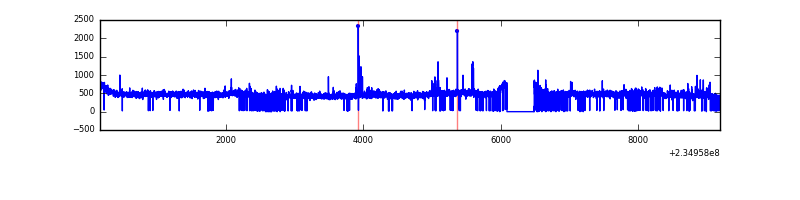 |
| C | 9019 | 8600 | 0 | 0 | 0.00% | 0.00% | 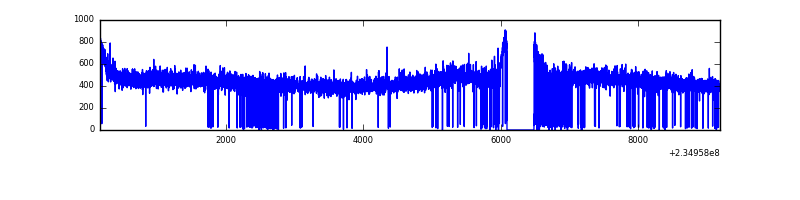 |
| D | 9020 | 8581 | 39 | 39 | 0.43% | 0.45% | 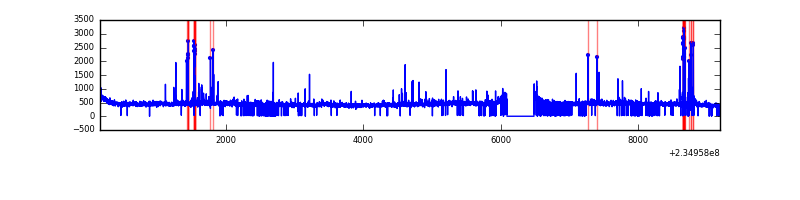 |
Top three noisy pixels from each quadrant. If the there are fewer than three noisy pixels in the level2.evt file, extra rows are filled as -1
| Pixel properties | Quadrant properties | ||||||
|---|---|---|---|---|---|---|---|
| Quadrant | DetID | PixID | Counts | Sigma | Mean | Median | Sigma |
| A | 8 | 5 | 1173392 | 5876.5 | 980 | 960 | 199.5 |
| A | 5 | 16 | 180251 | 898.65 | 980 | 960 | 199.5 |
| A | 1 | 162 | 94859 | 470.64 | 980 | 960 | 199.5 |
| B | 0 | 214 | 49183 | 255.27 | 984 | 960 | 188.9 |
| B | 4 | 48 | 32970 | 169.44 | 984 | 960 | 188.9 |
| B | 12 | 111 | 20392 | 102.86 | 984 | 960 | 188.9 |
| C | 14 | 67 | 7667 | 30.22 | 954 | 955 | 222.1 |
| C | 13 | 61 | 7086 | 27.6 | 954 | 955 | 222.1 |
| C | 8 | 128 | 6379 | 24.42 | 954 | 955 | 222.1 |
| D | 1 | 52 | 114886 | 449.61 | 947 | 924 | 253.5 |
| D | 12 | 233 | 52186 | 202.24 | 947 | 924 | 253.5 |
| D | 2 | 234 | 45382 | 175.4 | 947 | 924 | 253.5 |
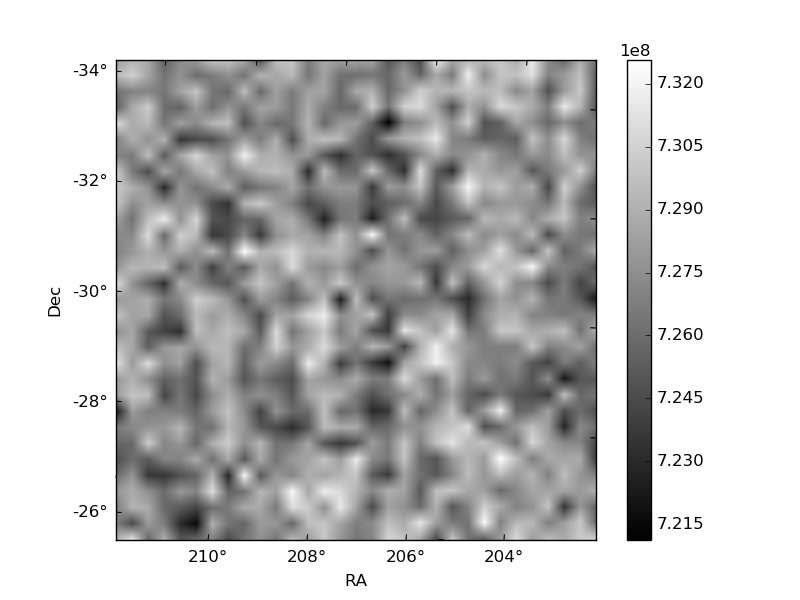
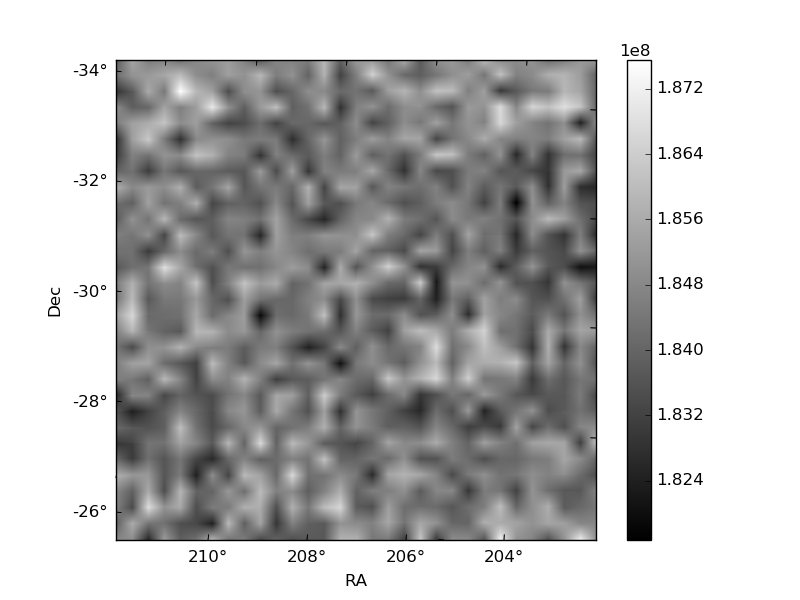
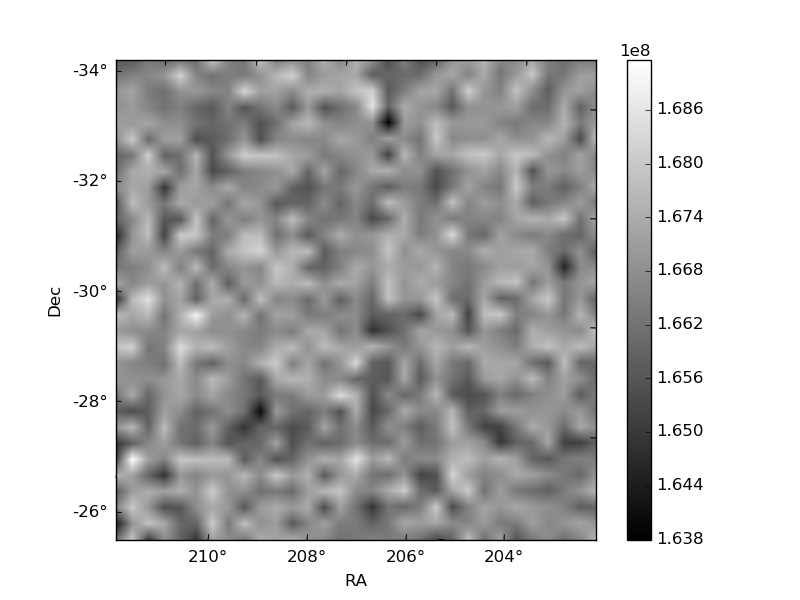
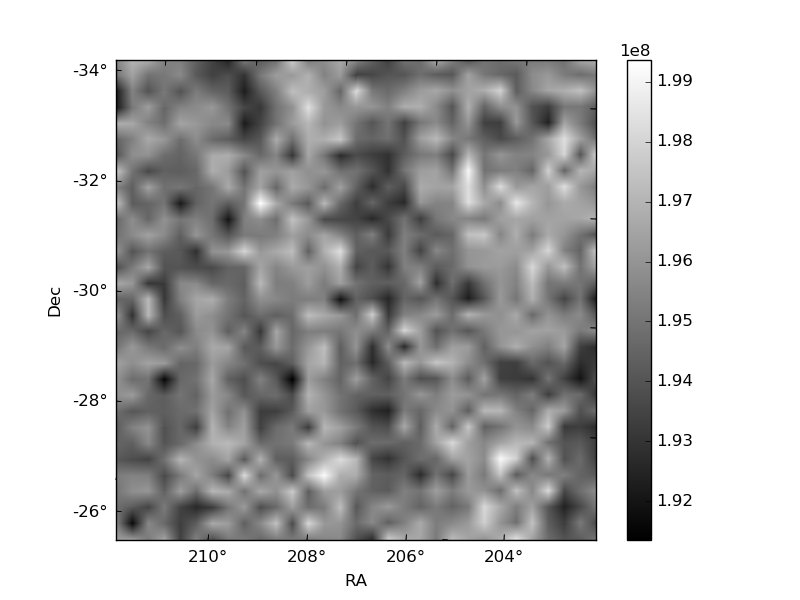
Histogram calculated using DETX and DETY for each event in the final _common_clean file
| Quadrant A | 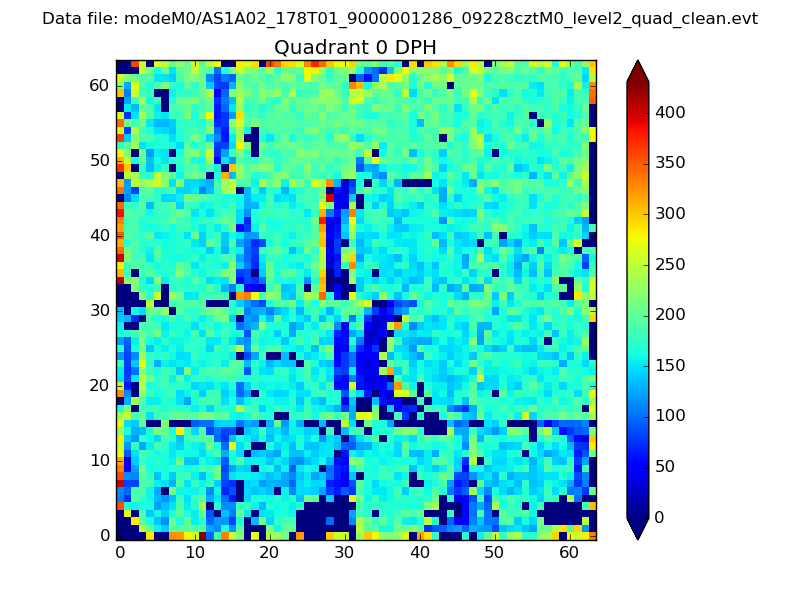 |
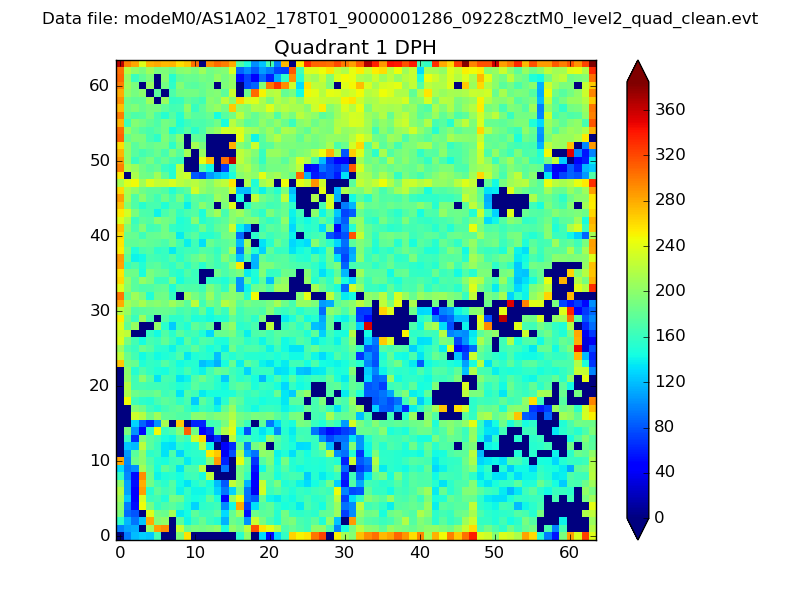 |
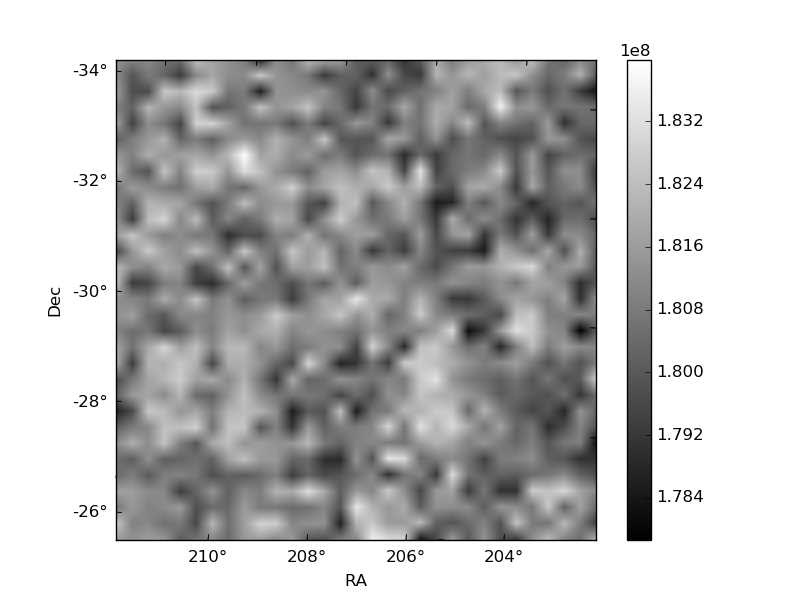
Quadrant B |
|---|---|---|---|
| Quadrant D | 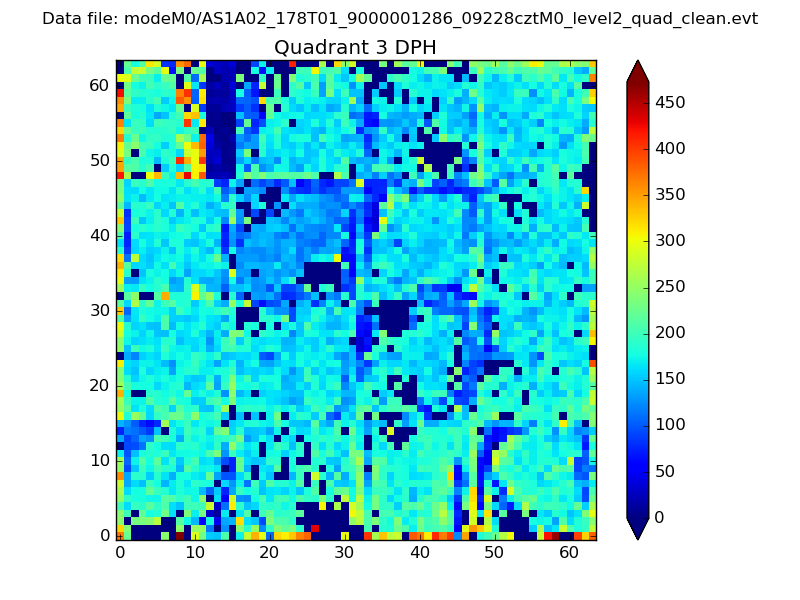 |
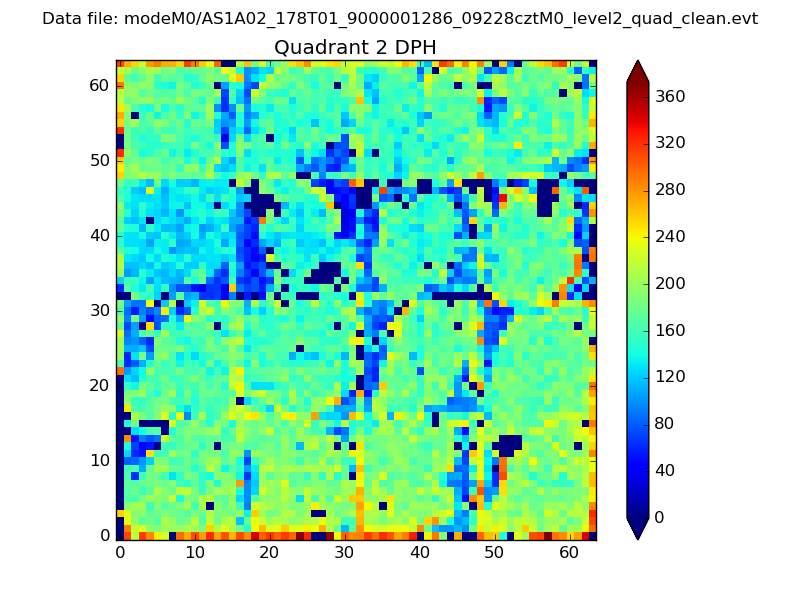 |
Quadrant C |
| Plot type | Count rate plots | Images |
|---|---|---|
| Comparison with Poisson distribution Blue bars denote a histogram of data divided into 1 sec bins. Red curve is a Poisson curve with rate = median count rate of data. |
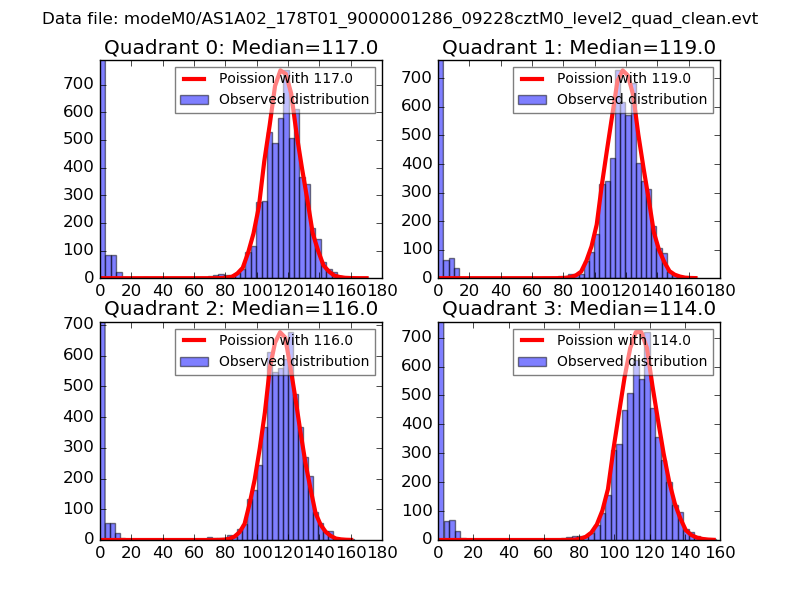 |
 |
| Quadrant-wise count rates Data is divided into 100 sec bins |
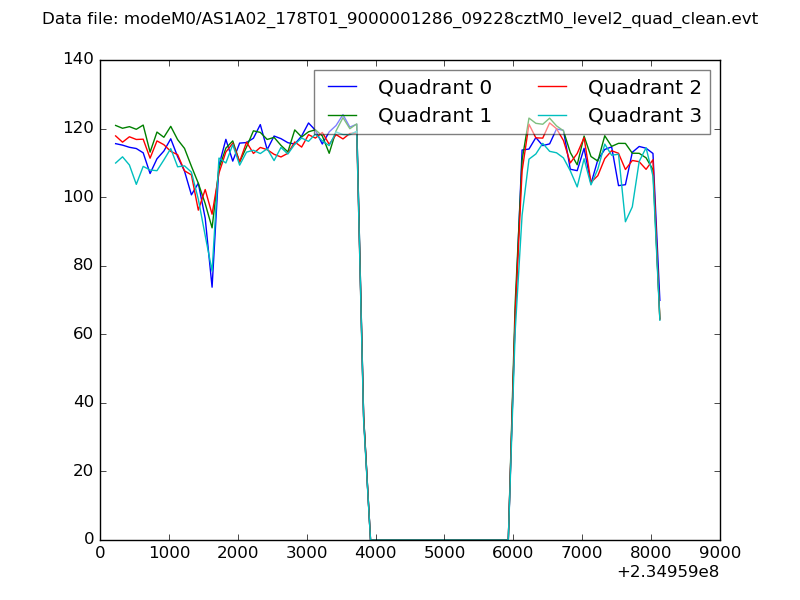 |
|
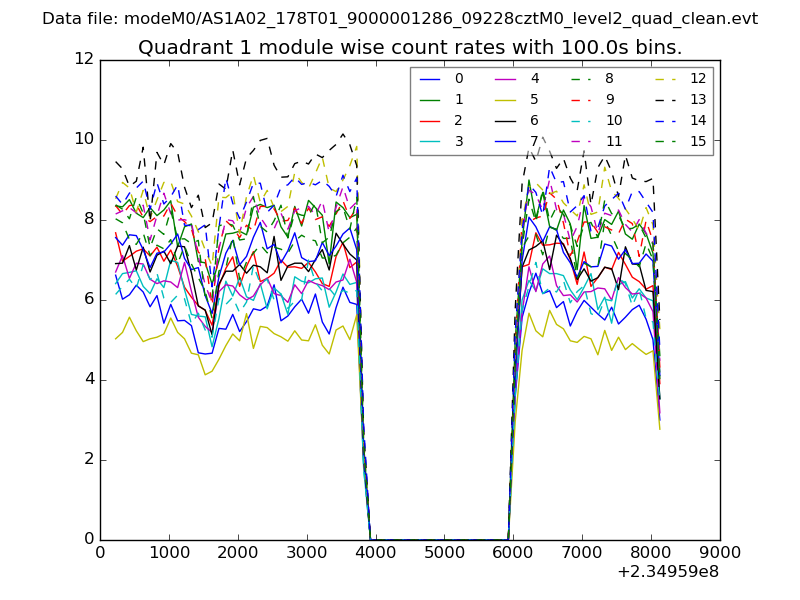
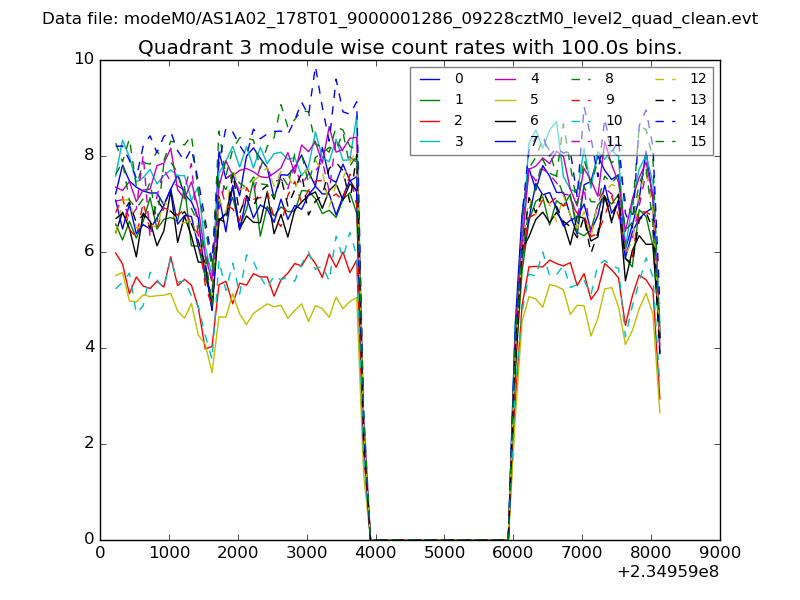
| Module-wise count rates for Quadrant A Data is divided into 100 sec bins |
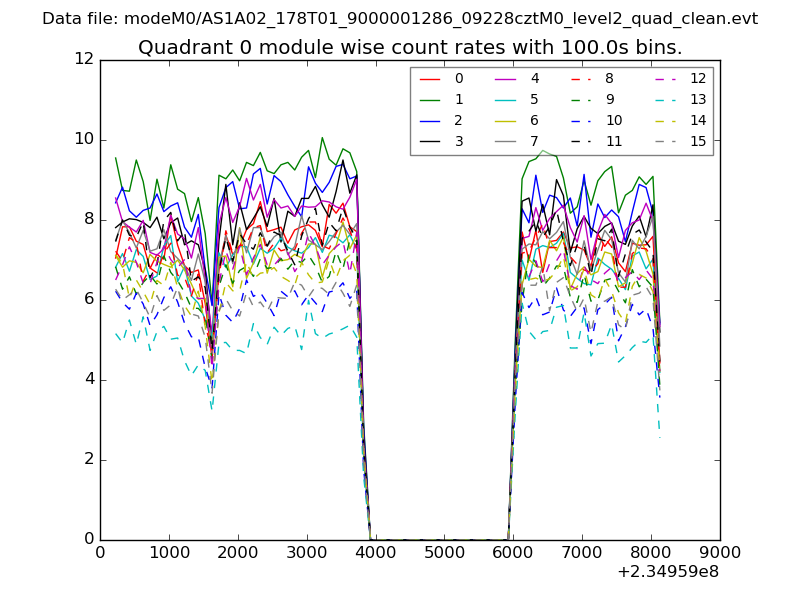 |
 |
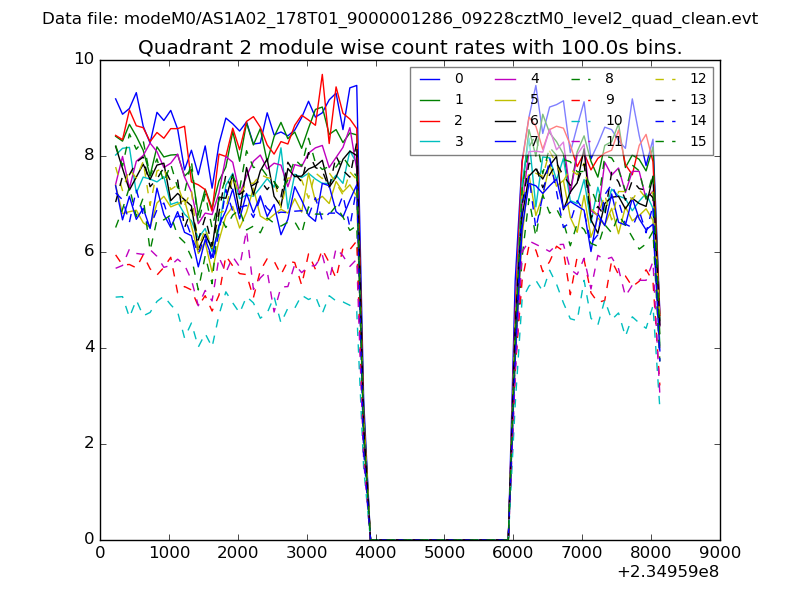
| Module-wise count rates for Quadrant B Data is divided into 100 sec bins |
 |
 |
| Module-wise count rates for Quadrant C Data is divided into 100 sec bins |
 |
 |
| Module-wise count rates for Quadrant D Data is divided into 100 sec bins |
 |
 |
| Parameter | Plot |
|---|---|
| CZT HV Monitor | 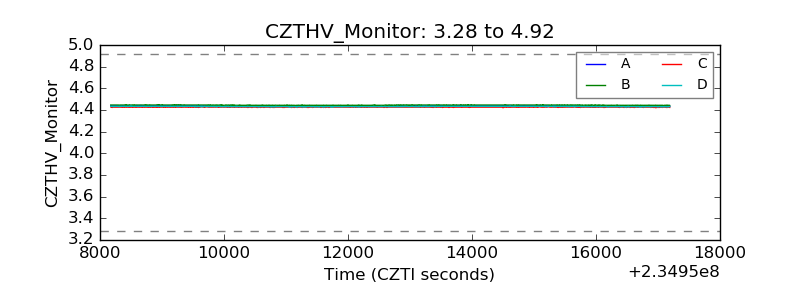 |
| D_VDD | 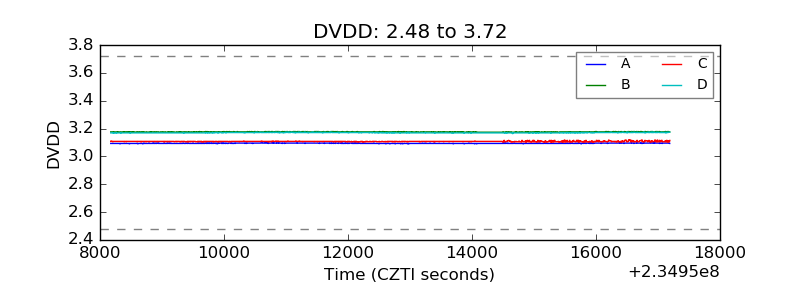 |
| Temperature 1 | 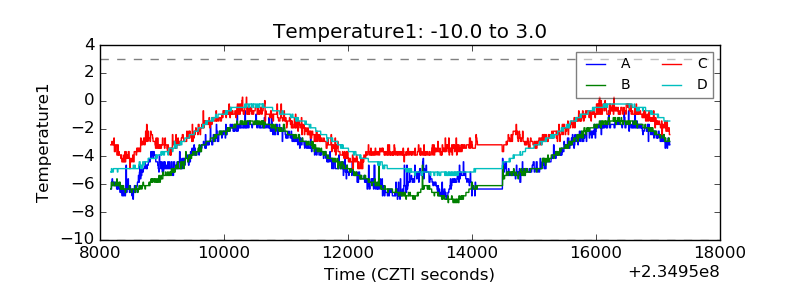 |
| Veto HV Monitor | 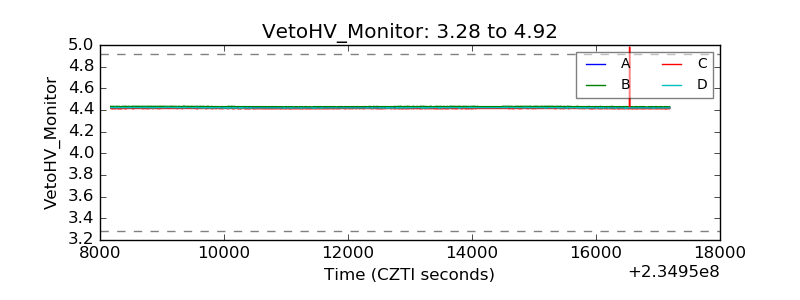 |
| Veto LLD | 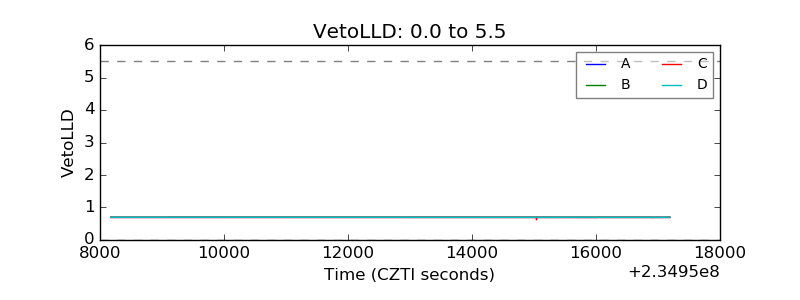 |
| Alpha Counter | 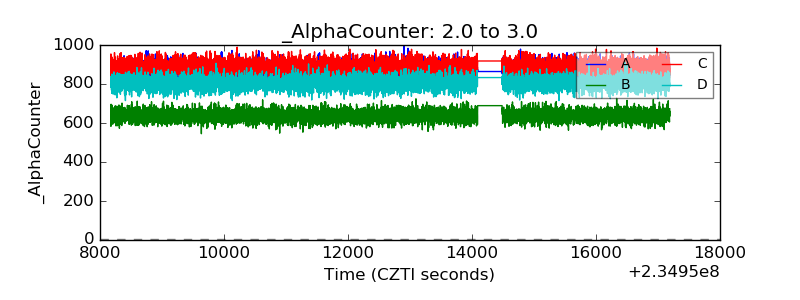 |
| _CPM_Rate | 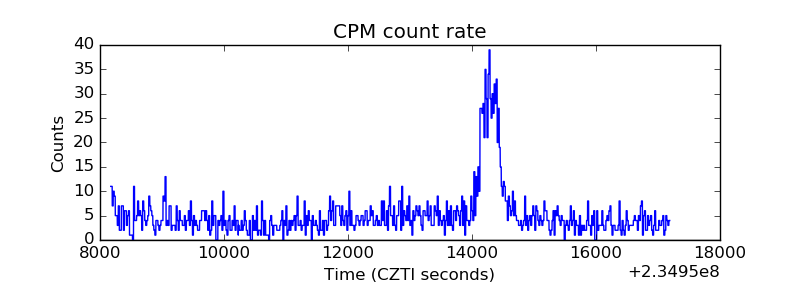 |
| CZT Counter | 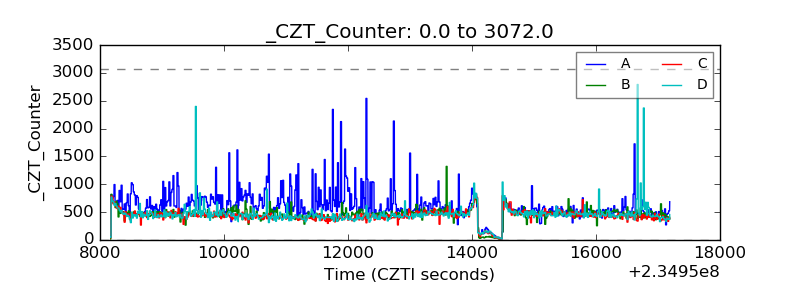 |
| +2.5 Volts monitor | 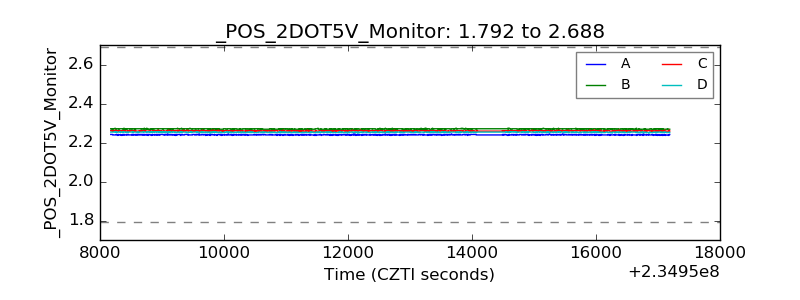 |
| +5 Volts monitor | 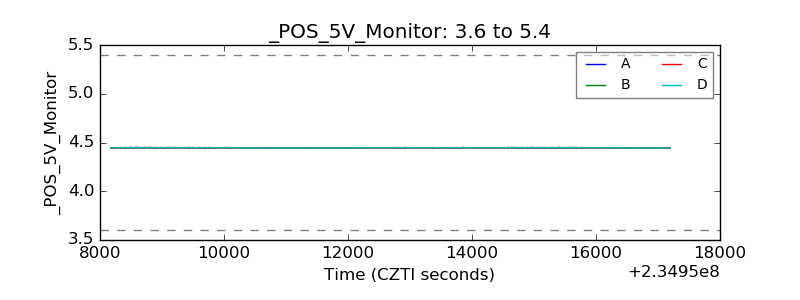 |
| _ROLL_ROT | 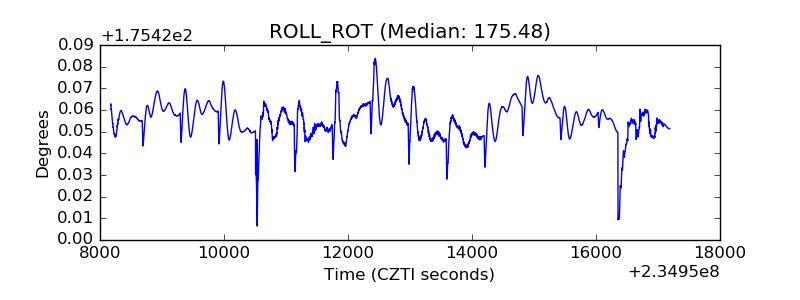 |
| _Roll_DEC | 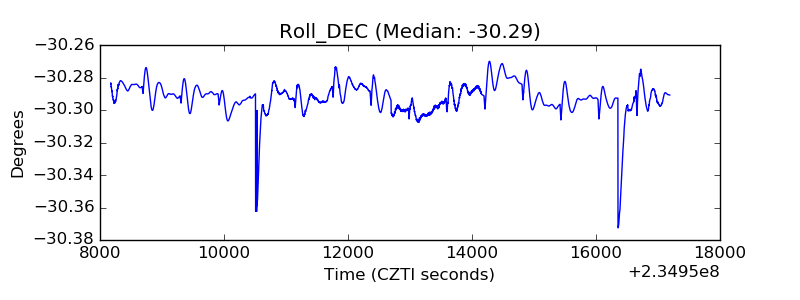 |
| _Roll_RA | 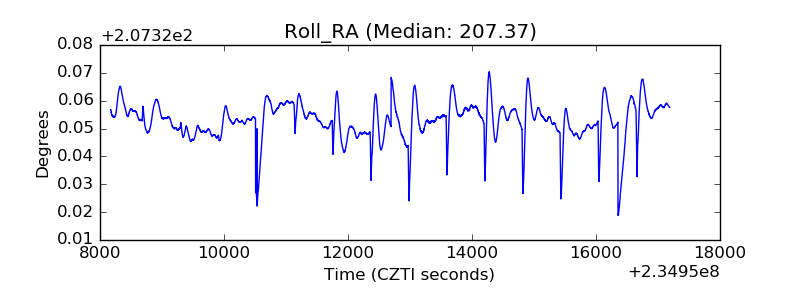 |
| Veto Counter | 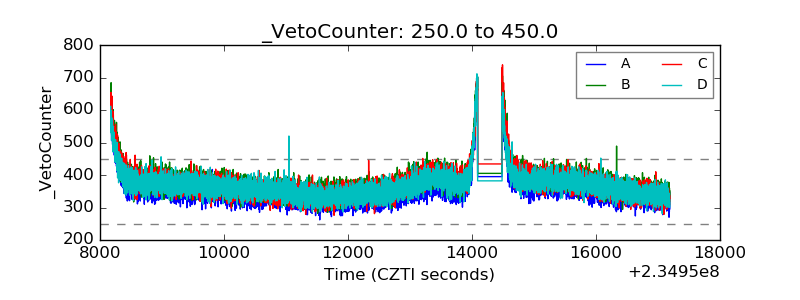 |