| Param | Original file | Final file |
|---|---|---|
| Filename | modeM0/AS1A02_178T01_9000001286_09229cztM0_level2.evt | modeM0/AS1A02_178T01_9000001286_09229cztM0_level2_quad_clean.evt |
| Size (bytes) | 255,824,640 | 60,318,720 |
| Size | 244.0 MB | 57.5 MB |
| Events in quadrant A | 2,610,502 | 395,789 |
| Events in quadrant B | 1,684,272 | 397,486 |
| Events in quadrant C | 1,537,829 | 388,502 |
| Events in quadrant D | 1,661,933 | 382,832 |
| Mode SS | |||
|---|---|---|---|
| Quadrant | BADHDUFLAG | Total packets | Discarded packets |
| A | 0 | 74 | 0 |
| B | 0 | 74 | 0 |
| C | 0 | 74 | 0 |
| D | 0 | 74 | 0 |
| Mode M0 | |||
|---|---|---|---|
| Quadrant | BADHDUFLAG | Total packets | Discarded packets |
| A | 0 | 10260 | 1 |
| B | 0 | 7500 | 2 |
| C | 0 | 7405 | 0 |
| D | 0 | 7658 | 0 |
| Quadrant | Total seconds | Saturated seconds | Saturation percentage |
|---|---|---|---|
| A | 3701 | 37 | 0.999730% |
| B | 3700 | 2 | 0.054054% |
| C | 3701 | 1 | 0.027020% |
| D | 3701 | 19 | 0.513375% |
Noise dominated data is calculated using 1-second bins in cleaned event files. If a bin has >2000 counts, and if more than 50% of those come from <1% of pixels, then it is considered to be noise-dominated and hence unusable.
| Quadrant | # 1 sec bins | Bins with >0 counts | Bins with >2000 counts | High rate bins dominated by noise | Noise dominated (total time) | Noise dominated (detector-on time) | Marked lightcurve |
|---|---|---|---|---|---|---|---|
| A | 3701 | 3701 | 34 | 34 | 0.92% | 0.92% |  |
| B | 3701 | 3701 | 1 | 1 | 0.03% | 0.03% | 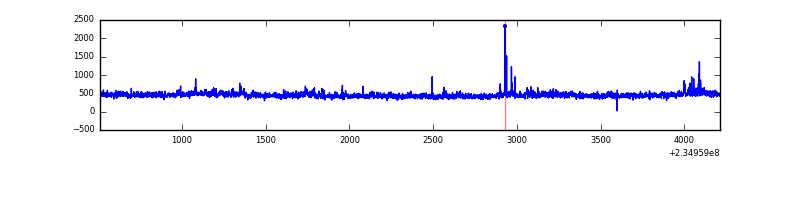 |
| C | 3701 | 3701 | 0 | 0 | 0.00% | 0.00% | 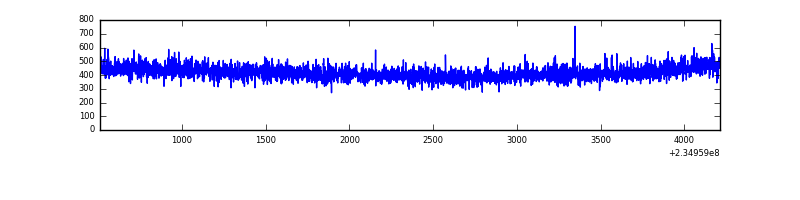 |
| D | 3701 | 3701 | 13 | 13 | 0.35% | 0.35% | 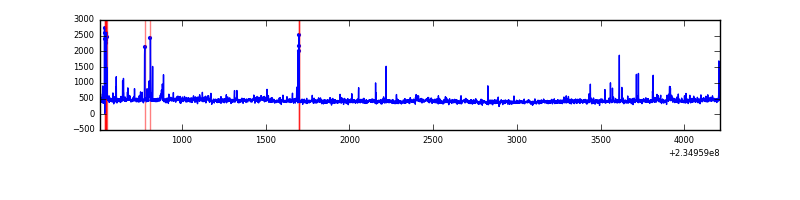 |
Top three noisy pixels from each quadrant. If the there are fewer than three noisy pixels in the level2.evt file, extra rows are filled as -1
| Pixel properties | Quadrant properties | ||||||
|---|---|---|---|---|---|---|---|
| Quadrant | DetID | PixID | Counts | Sigma | Mean | Median | Sigma |
| A | 8 | 5 | 840018 | 9788.31 | 413 | 406 | 85.8 |
| A | 5 | 16 | 71520 | 829.06 | 413 | 406 | 85.8 |
| A | 1 | 162 | 37941 | 437.59 | 413 | 406 | 85.8 |
| B | 0 | 214 | 31674 | 385.45 | 412 | 402 | 81.1 |
| B | 4 | 173 | 14537 | 174.22 | 412 | 402 | 81.1 |
| B | 4 | 48 | 11017 | 130.84 | 412 | 402 | 81.1 |
| C | 13 | 61 | 2936 | 27.47 | 393 | 395 | 92.5 |
| C | 14 | 67 | 2780 | 25.78 | 393 | 395 | 92.5 |
| C | 8 | 222 | 2419 | 21.88 | 393 | 395 | 92.5 |
| D | 12 | 233 | 32231 | 301.44 | 395 | 386 | 105.6 |
| D | 7 | 71 | 26160 | 243.97 | 395 | 386 | 105.6 |
| D | 2 | 234 | 22153 | 206.04 | 395 | 386 | 105.6 |
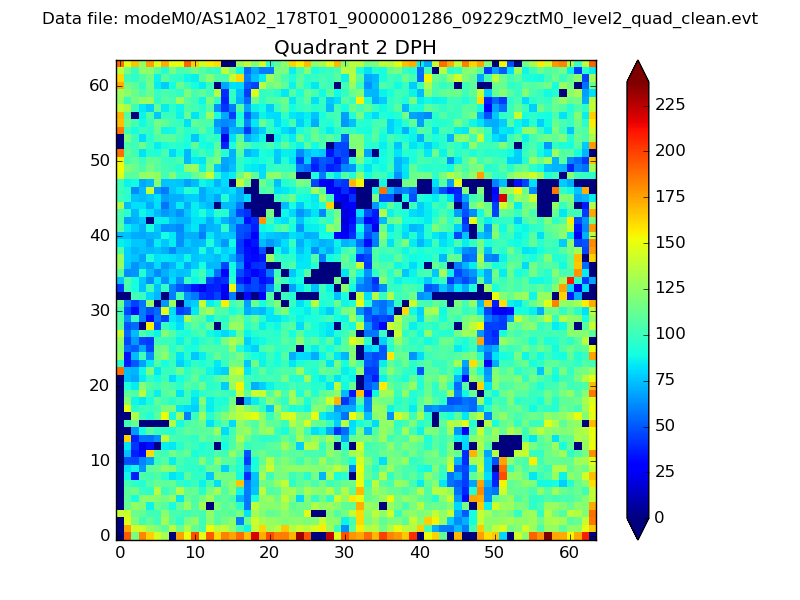
Histogram calculated using DETX and DETY for each event in the final _common_clean file
| Quadrant A | 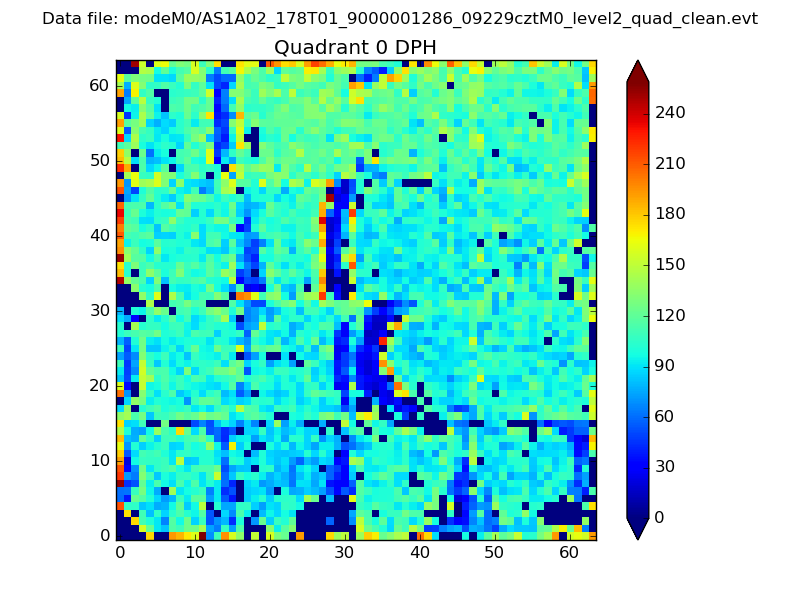 |
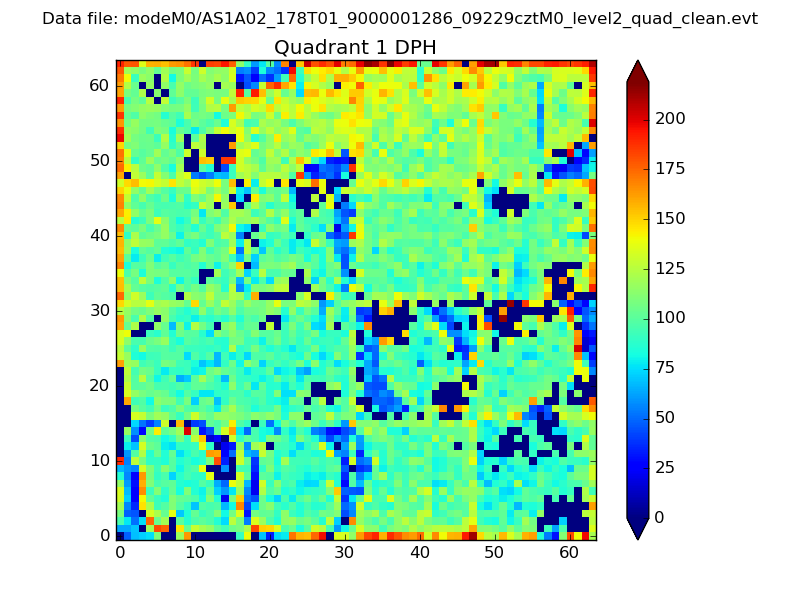 |
Quadrant B |
|---|---|---|---|
| Quadrant D | 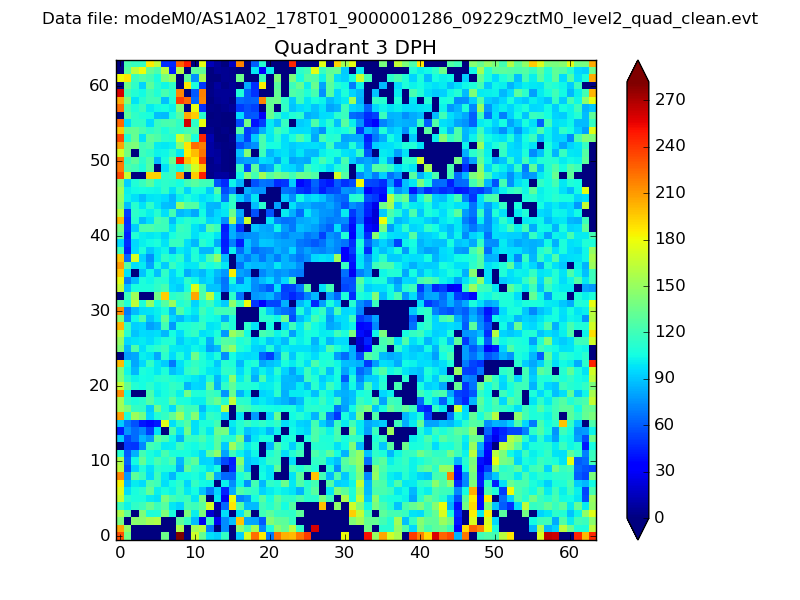 |
 |
Quadrant C |
| Plot type | Count rate plots | Images |
|---|---|---|
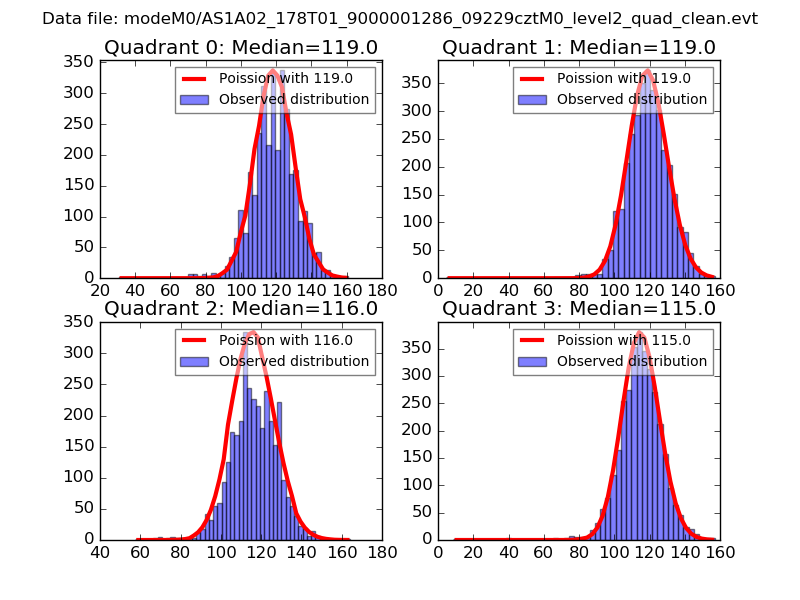
| Comparison with Poisson distribution Blue bars denote a histogram of data divided into 1 sec bins. Red curve is a Poisson curve with rate = median count rate of data. |
 |
 |
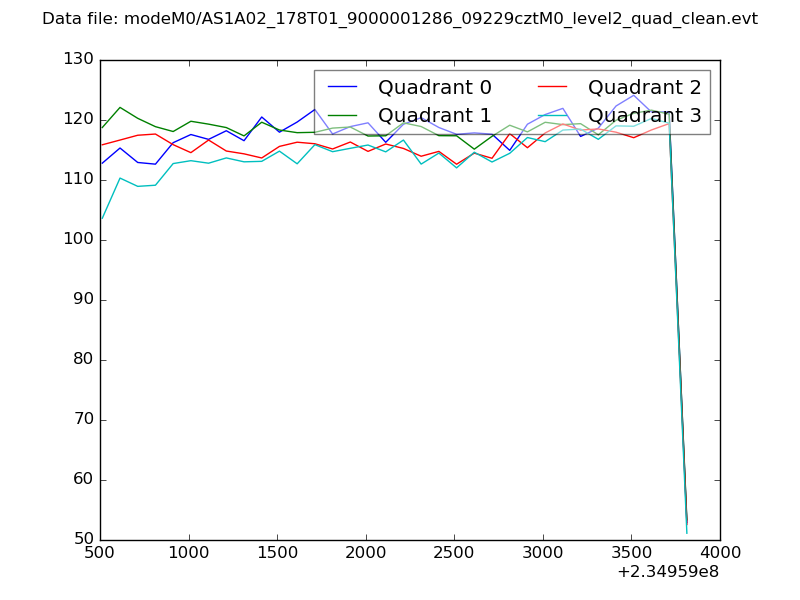
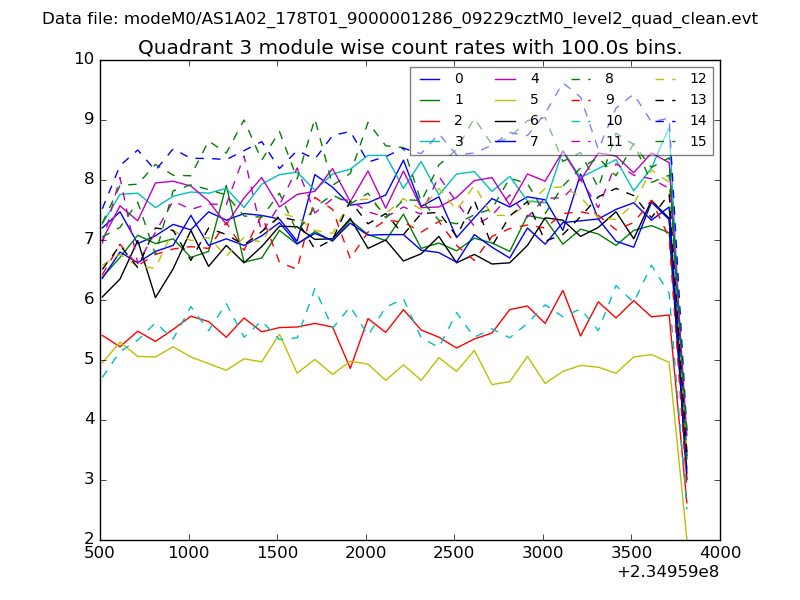
| Quadrant-wise count rates Data is divided into 100 sec bins |
 |
|
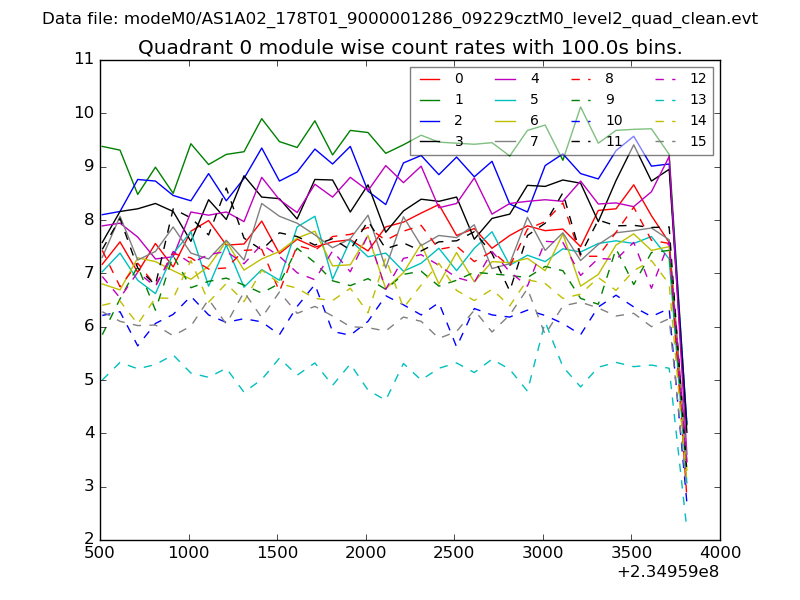
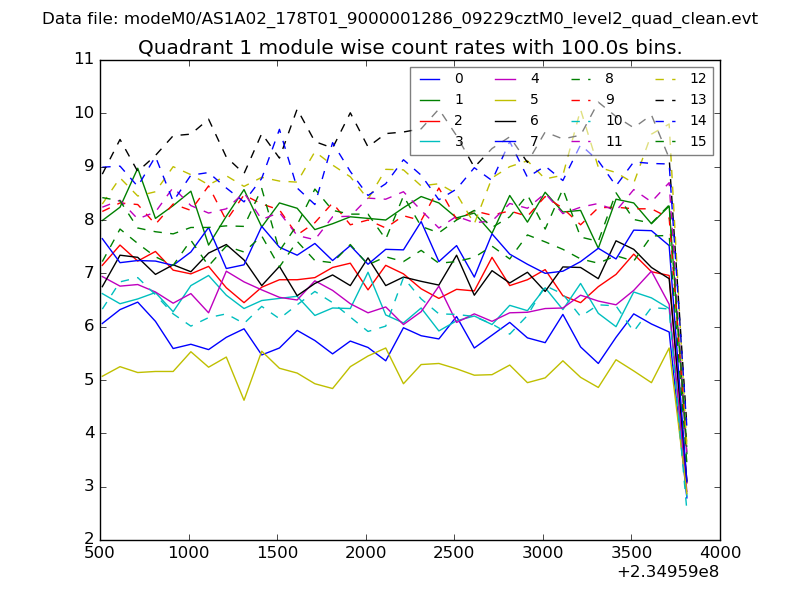
| Module-wise count rates for Quadrant A Data is divided into 100 sec bins |
 |
 |
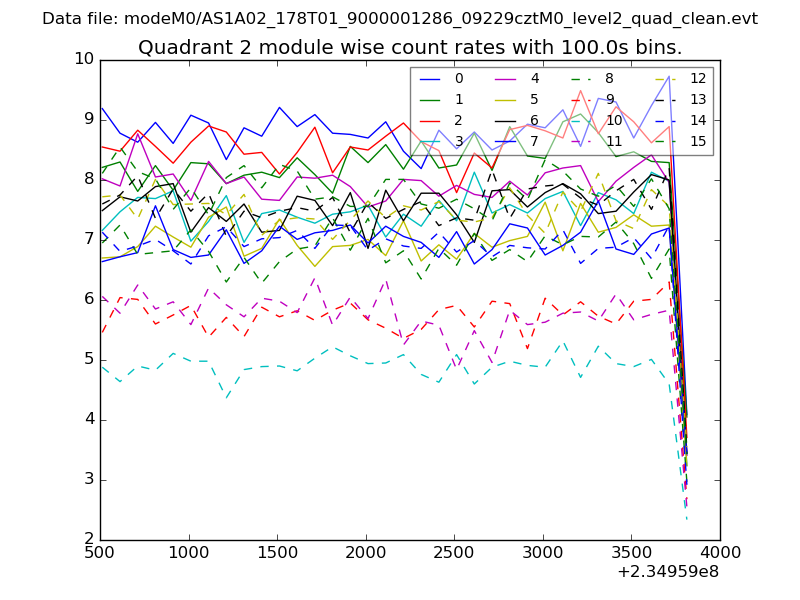
| Module-wise count rates for Quadrant B Data is divided into 100 sec bins |
 |
 |
| Module-wise count rates for Quadrant C Data is divided into 100 sec bins |
 |
 |
| Module-wise count rates for Quadrant D Data is divided into 100 sec bins |
 |
 |
| Parameter | Plot |
|---|---|
| CZT HV Monitor | 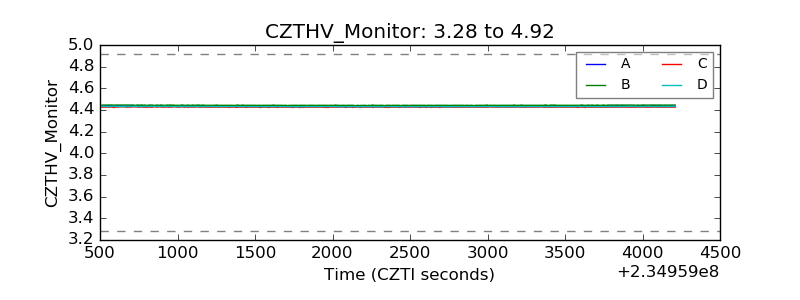 |
| D_VDD | 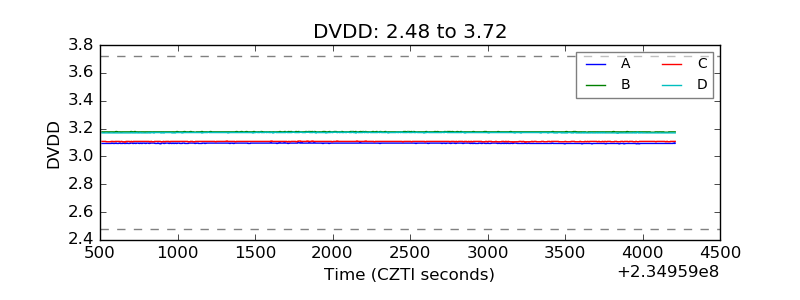 |
| Temperature 1 | 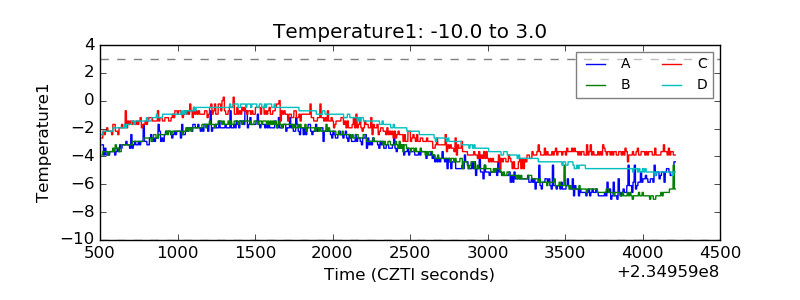 |
| Veto HV Monitor | 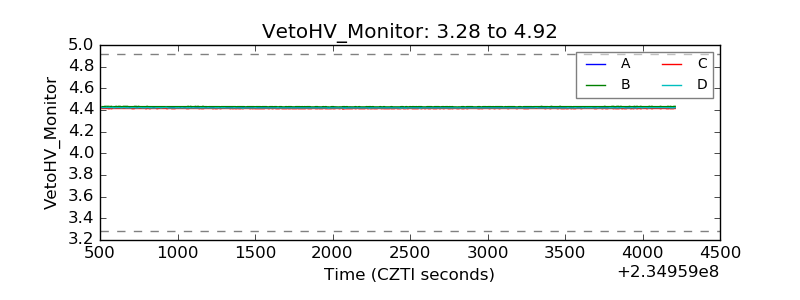 |
| Veto LLD | 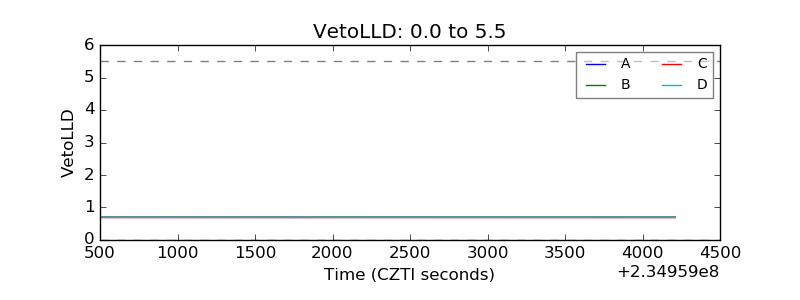 |
| Alpha Counter | 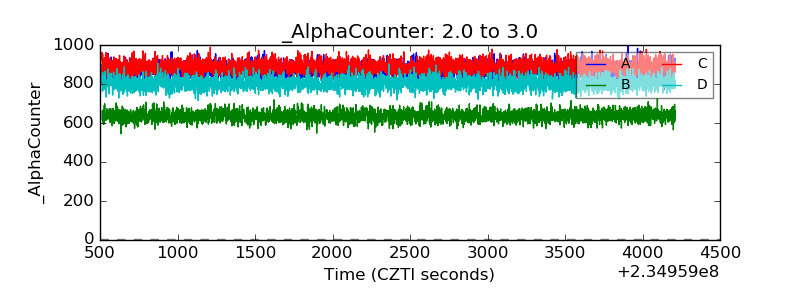 |
| _CPM_Rate | 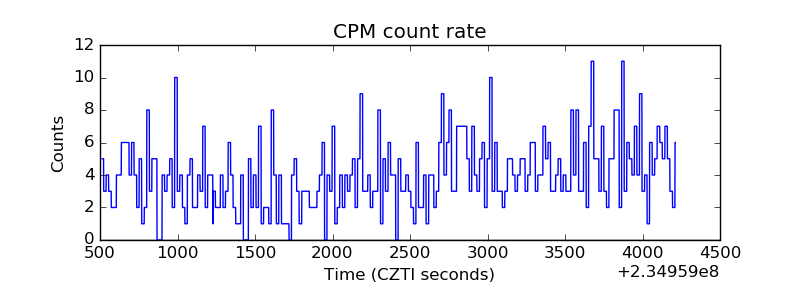 |
| CZT Counter | 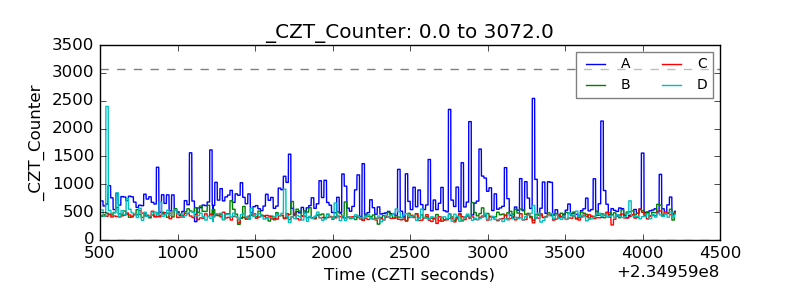 |
| +2.5 Volts monitor |  |
| +5 Volts monitor |  |
| _ROLL_ROT | 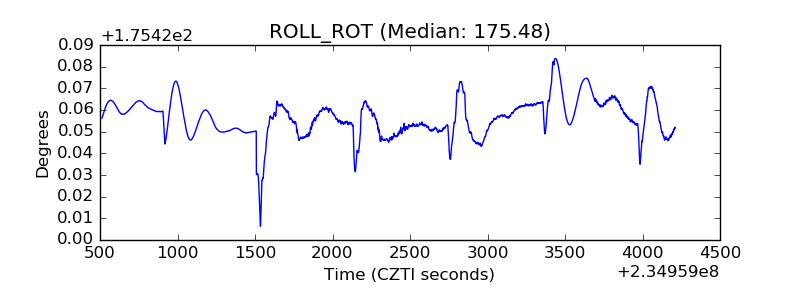 |
| _Roll_DEC | 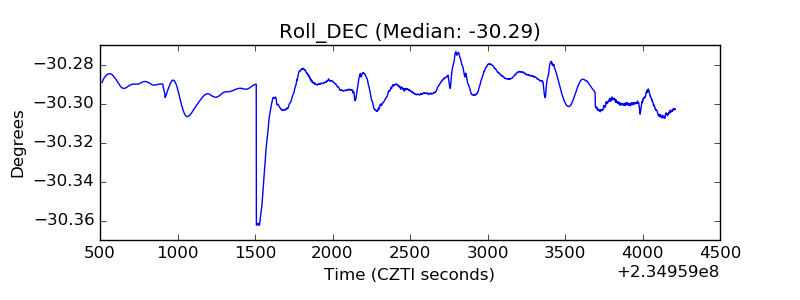 |
| _Roll_RA | 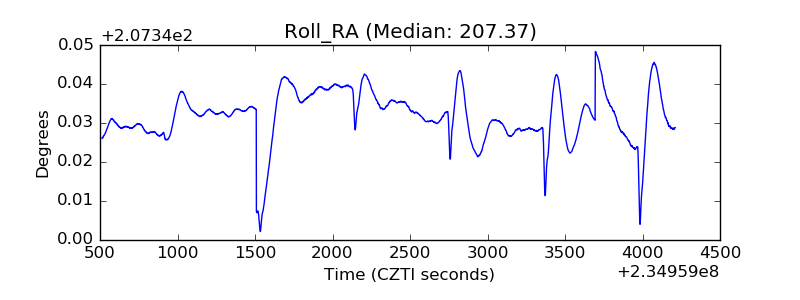 |
| Veto Counter | 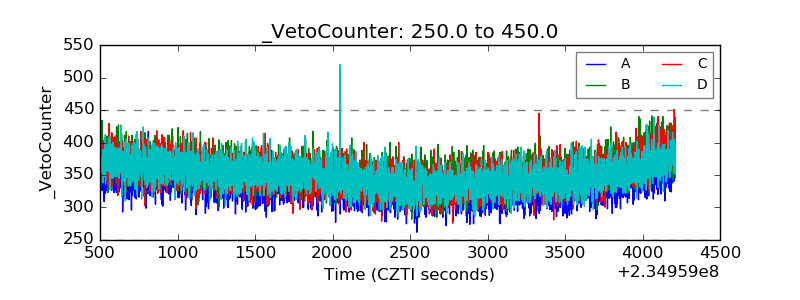 |