| Param | Original file | Final file |
|---|---|---|
| Filename | modeM0/AS1A03_051T01_9000001288cztM0_level2.fits | modeM0/AS1A03_051T01_9000001288cztM0_level2_quad_clean.evt |
| Size (bytes) | 630,313,920 | 556,974,720 |
| Size | 601.1 MB | 531.2 MB |
| Events in quadrant A | 3,742,396 | 3,166,283 |
| Events in quadrant B | 3,680,606 | 3,171,747 |
| Events in quadrant C | 3,774,759 | 3,054,285 |
| Events in quadrant D | 3,253,702 | 2,839,820 |
| Mode SS | |||
|---|---|---|---|
| Quadrant | BADHDUFLAG | Total packets | Discarded packets |
| A | 0 | 1384 | 0 |
| B | 0 | 1400 | 0 |
| C | 0 | 1379 | 0 |
| D | 0 | 1375 | 0 |
| Mode M0 | |||
|---|---|---|---|
| Quadrant | BADHDUFLAG | Total packets | Discarded packets |
| A | 0 | 167419 | 0 |
| B | 0 | 149670 | 0 |
| C | 0 | 138399 | 0 |
| D | 0 | 148964 | 0 |
| Mode M9 | |||
|---|---|---|---|
| Quadrant | BADHDUFLAG | Total packets | Discarded packets |
| A | 0 | 112 | 0 |
| B | 0 | 112 | 0 |
| C | 0 | 110 | 0 |
| D | 0 | 112 | 0 |
| Quadrant | Total seconds | Saturated seconds | Saturation percentage |
|---|---|---|---|
| A | 67358 | 1870 | 2.776211% |
| B | 67456 | 1387 | 2.056155% |
| C | 67734 | 493 | 0.727847% |
| D | 67562 | 896 | 1.326189% |
Noise dominated data is calculated using 1-second bins in cleaned event files. If a bin has >2000 counts, and if more than 50% of those come from <1% of pixels, then it is considered to be noise-dominated and hence unusable.
| Quadrant | # 1 sec bins | Bins with >0 counts | Bins with >2000 counts | High rate bins dominated by noise | Noise dominated (total time) | Noise dominated (detector-on time) | Marked lightcurve |
|---|---|---|---|---|---|---|---|
| A | 82363 | 68912 | 0 | 0 | 0.00% | 0.00% |  |
| B | 82364 | 68910 | 0 | 0 | 0.00% | 0.00% | 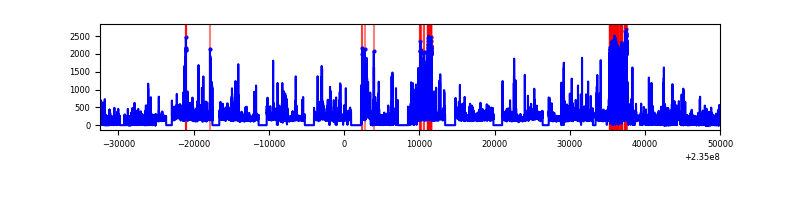 |
| C | 82362 | 69186 | 0 | 0 | 0.00% | 0.00% |  |
| D | 82364 | 69009 | 0 | 0 | 0.00% | 0.00% |  |
Top three noisy pixels from each quadrant. If the there are fewer than three noisy pixels in the level2.evt file, extra rows are filled as -1
| Pixel properties | Quadrant properties | ||||||
|---|---|---|---|---|---|---|---|
| Quadrant | DetID | PixID | Counts | Sigma | Mean | Median | Sigma |
| A | 0 | 29 | 3817 | 11.84 | 973 | 910 | 245.6 |
| A | 7 | 110 | 3089 | 8.87 | 973 | 910 | 245.6 |
| A | 0 | 30 | 2887 | 8.05 | 973 | 910 | 245.6 |
| B | 2 | 9 | 3163 | 11.59 | 970 | 922 | 193.3 |
| B | 3 | 17 | 2530 | 8.32 | 970 | 922 | 193.3 |
| B | 5 | 128 | 2490 | 8.11 | 970 | 922 | 193.3 |
| C | 1 | 80 | 2756 | 6.98 | 996 | 921 | 262.8 |
| C | 1 | 81 | 2690 | 6.73 | 996 | 921 | 262.8 |
| C | 12 | 241 | 2658 | 6.61 | 996 | 921 | 262.8 |
| D | 6 | 231 | 2451 | 6.42 | 926 | 841 | 250.6 |
| D | 3 | 14 | 2372 | 6.11 | 926 | 841 | 250.6 |
| D | 7 | 5 | 2357 | 6.05 | 926 | 841 | 250.6 |
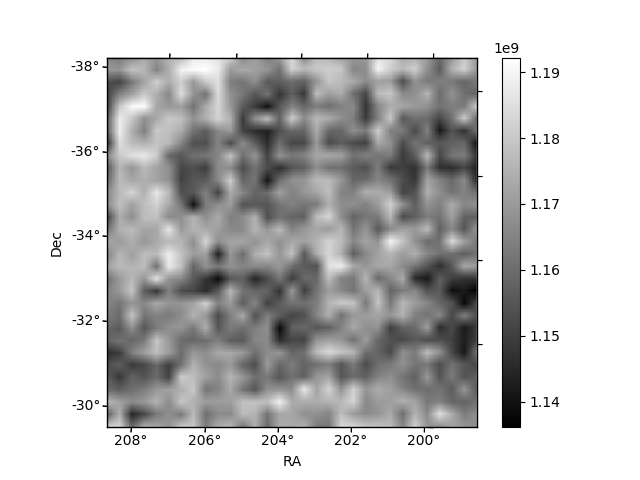
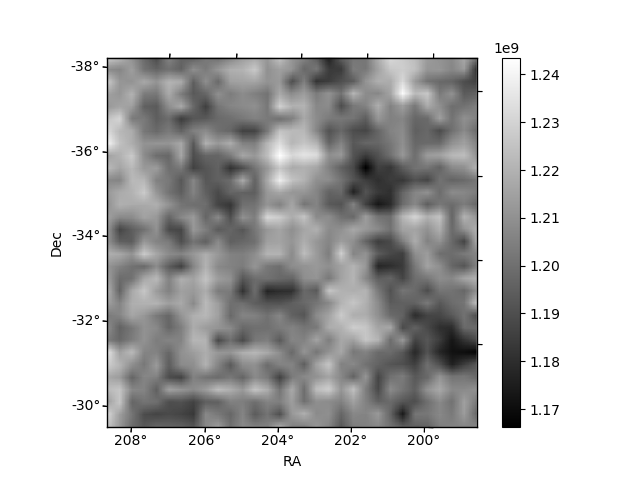
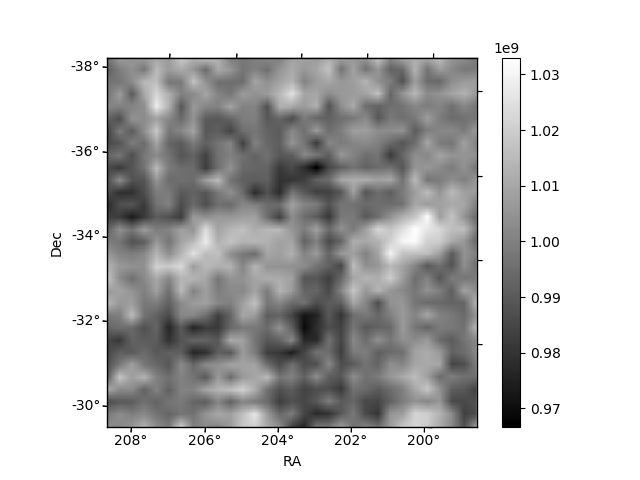
Histogram calculated using DETX and DETY for each event in the final _common_clean file
| Quadrant A | 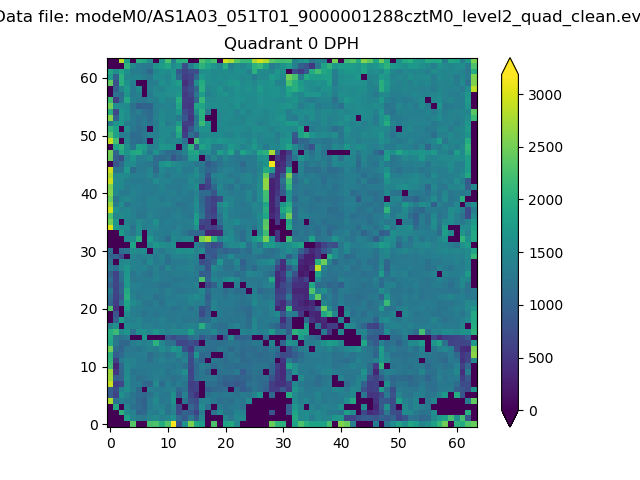 |
 |
Quadrant B |
|---|---|---|---|
| Quadrant D |  |
 |
Quadrant C |
| Plot type | Count rate plots | Images |
|---|---|---|
| Comparison with Poisson distribution Blue bars denote a histogram of data divided into 1 sec bins. Red curve is a Poisson curve with rate = median count rate of data. |
 |
 |
| Quadrant-wise count rates Data is divided into 100 sec bins |
 |
|
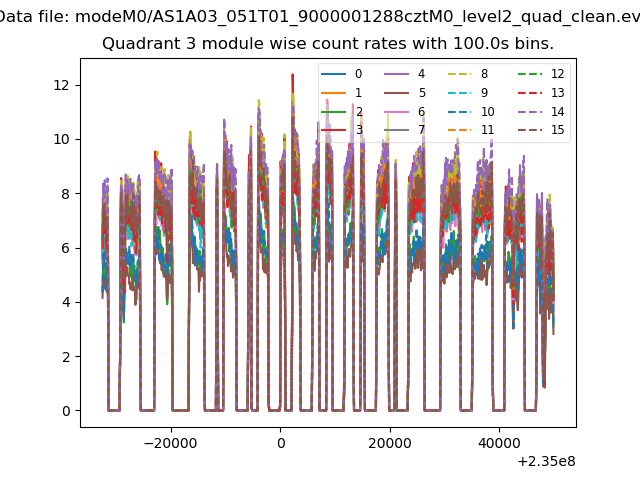
| Module-wise count rates for Quadrant A Data is divided into 100 sec bins |
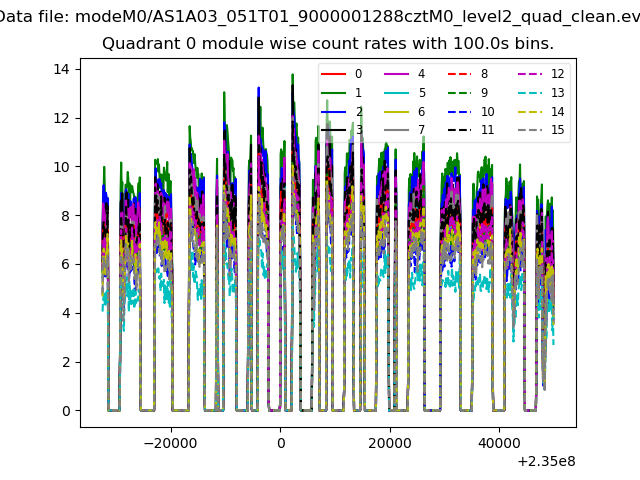 |
 |
| Module-wise count rates for Quadrant B Data is divided into 100 sec bins |
 |
 |
| Module-wise count rates for Quadrant C Data is divided into 100 sec bins |
 |
 |
| Module-wise count rates for Quadrant D Data is divided into 100 sec bins |
 |
 |
| Parameter | Plot |
|---|---|
| CZT HV Monitor |  |
| D_VDD | 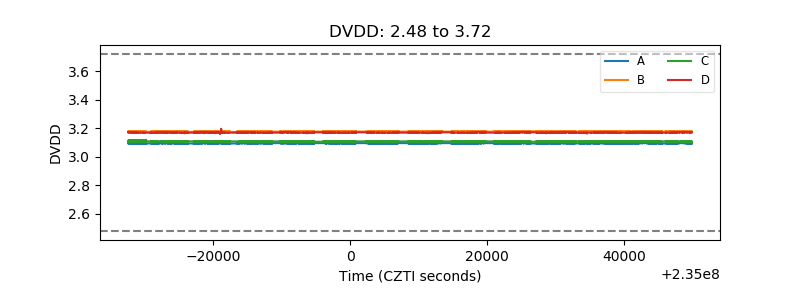 |
| Temperature 1 | 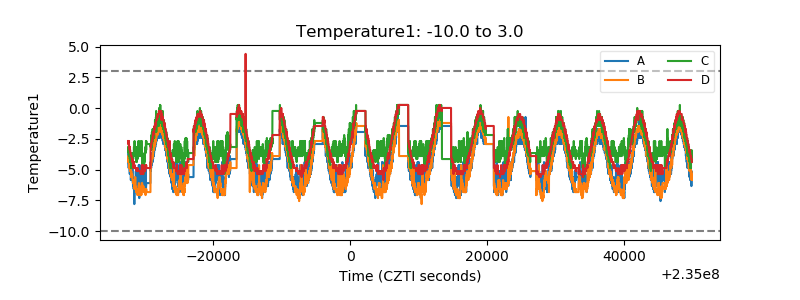 |
| Veto HV Monitor |  |
| Veto LLD | 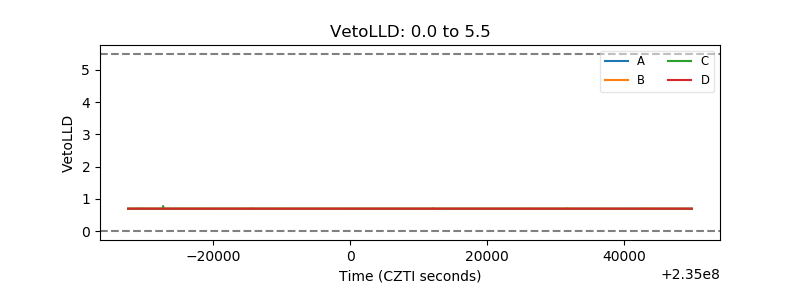 |
| Alpha Counter |  |
| _CPM_Rate |  |
| CZT Counter |  |
| +2.5 Volts monitor |  |
| +5 Volts monitor |  |
| _ROLL_ROT | 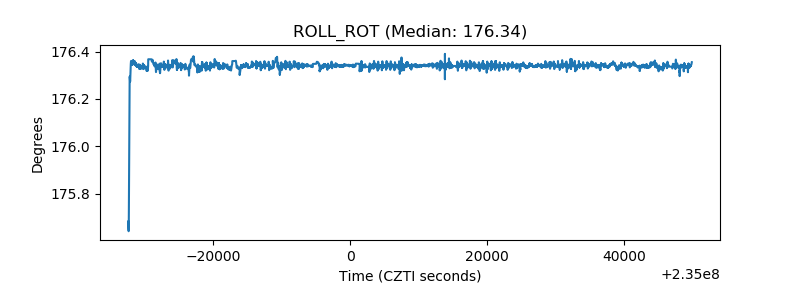 |
| _Roll_DEC |  |
| _Roll_RA |  |
| Veto Counter | 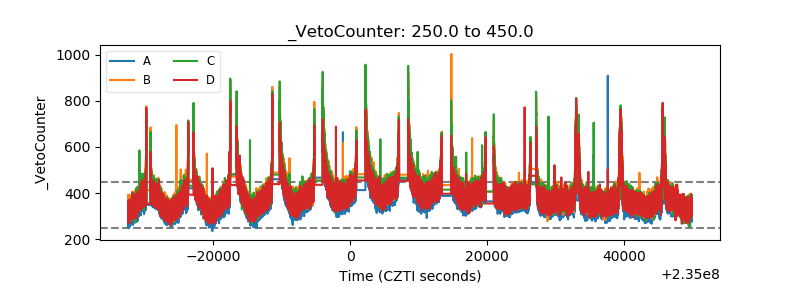 |