| Param | Original file | Final file |
|---|---|---|
| Filename | modeM0/AS1A03_051T01_9000001288_09229cztM0_level2.evt | modeM0/AS1A03_051T01_9000001288_09229cztM0_level2_quad_clean.evt |
| Size (bytes) | 699,802,560 | 101,744,640 |
| Size | 667.4 MB | 97.0 MB |
| Events in quadrant A | 7,083,740 | 621,191 |
| Events in quadrant B | 4,751,920 | 626,526 |
| Events in quadrant C | 4,105,419 | 610,236 |
| Events in quadrant D | 4,640,188 | 595,855 |
| Mode SS | |||
|---|---|---|---|
| Quadrant | BADHDUFLAG | Total packets | Discarded packets |
| A | 0 | 186 | 0 |
| B | 0 | 186 | 0 |
| C | 0 | 186 | 0 |
| D | 0 | 186 | 0 |
| Mode M0 | |||
|---|---|---|---|
| Quadrant | BADHDUFLAG | Total packets | Discarded packets |
| A | 0 | 27262 | 3 |
| B | 0 | 19997 | 2 |
| C | 0 | 18419 | 2 |
| D | 0 | 20044 | 2 |
| Mode M9 | |||
|---|---|---|---|
| Quadrant | BADHDUFLAG | Total packets | Discarded packets |
| A | 0 | 17 | 0 |
| B | 0 | 17 | 0 |
| C | 0 | 17 | 0 |
| D | 0 | 17 | 0 |
| Quadrant | Total seconds | Saturated seconds | Saturation percentage |
|---|---|---|---|
| A | 9035 | 687 | 7.603763% |
| B | 9035 | 107 | 1.184283% |
| C | 9035 | 41 | 0.453791% |
| D | 9035 | 156 | 1.726619% |
Noise dominated data is calculated using 1-second bins in cleaned event files. If a bin has >2000 counts, and if more than 50% of those come from <1% of pixels, then it is considered to be noise-dominated and hence unusable.
| Quadrant | # 1 sec bins | Bins with >0 counts | Bins with >2000 counts | High rate bins dominated by noise | Noise dominated (total time) | Noise dominated (detector-on time) | Marked lightcurve |
|---|---|---|---|---|---|---|---|
| A | 10720 | 9037 | 446 | 446 | 4.16% | 4.94% | 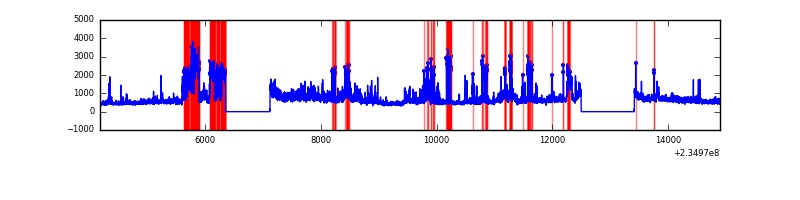 |
| B | 10720 | 9037 | 23 | 23 | 0.21% | 0.25% | 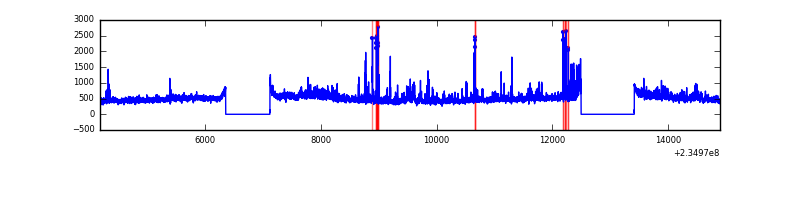 |
| C | 10720 | 9037 | 0 | 0 | 0.00% | 0.00% | 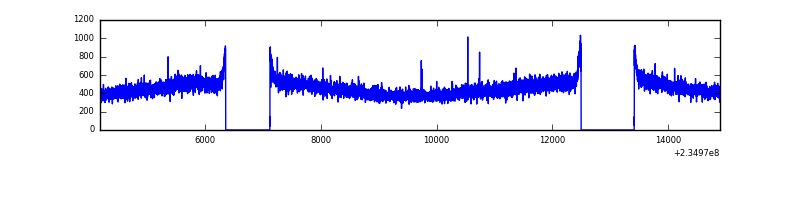 |
| D | 10720 | 9037 | 75 | 75 | 0.70% | 0.83% | 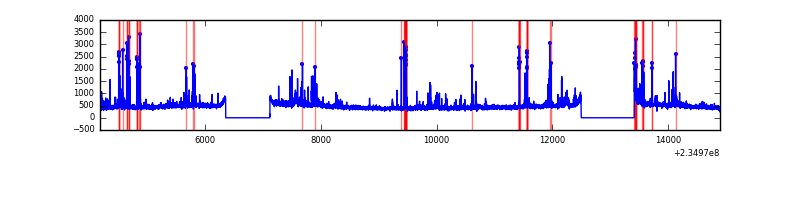 |
Top three noisy pixels from each quadrant. If the there are fewer than three noisy pixels in the level2.evt file, extra rows are filled as -1
| Pixel properties | Quadrant properties | ||||||
|---|---|---|---|---|---|---|---|
| Quadrant | DetID | PixID | Counts | Sigma | Mean | Median | Sigma |
| A | 8 | 5 | 1536717 | 7171.75 | 1048 | 1030 | 214.1 |
| A | 15 | 174 | 1006204 | 4694.22 | 1048 | 1030 | 214.1 |
| A | 1 | 162 | 152308 | 706.48 | 1048 | 1030 | 214.1 |
| B | 8 | 234 | 186942 | 886.76 | 1090 | 1065 | 209.6 |
| B | 0 | 214 | 87760 | 413.59 | 1090 | 1065 | 209.6 |
| B | 6 | 51 | 58890 | 275.86 | 1090 | 1065 | 209.6 |
| C | 14 | 67 | 14110 | 53.84 | 1044 | 1047 | 242.6 |
| C | 3 | 233 | 10531 | 39.09 | 1044 | 1047 | 242.6 |
| C | 13 | 61 | 7872 | 28.13 | 1044 | 1047 | 242.6 |
| D | 7 | 71 | 209823 | 807.64 | 1046 | 1013 | 258.5 |
| D | 1 | 52 | 152846 | 587.26 | 1046 | 1013 | 258.5 |
| D | 5 | 97 | 106396 | 407.6 | 1046 | 1013 | 258.5 |
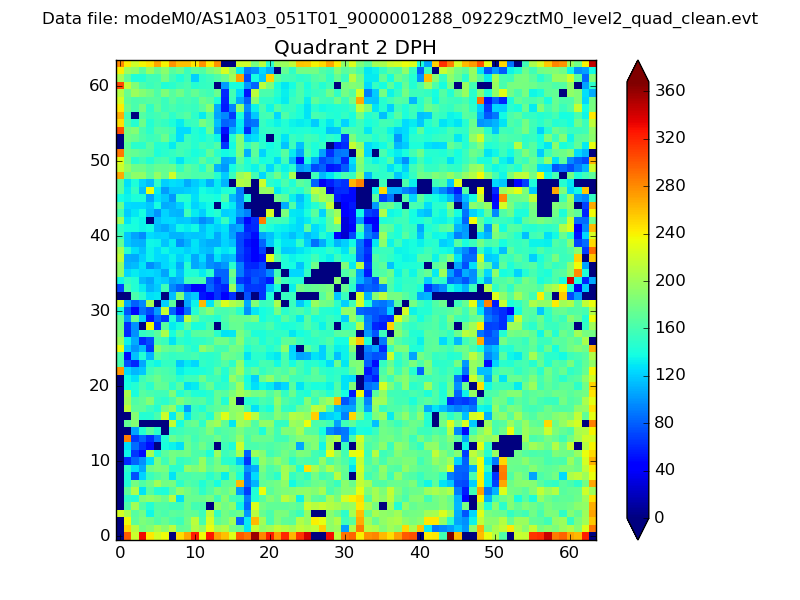
Histogram calculated using DETX and DETY for each event in the final _common_clean file
| Quadrant A | 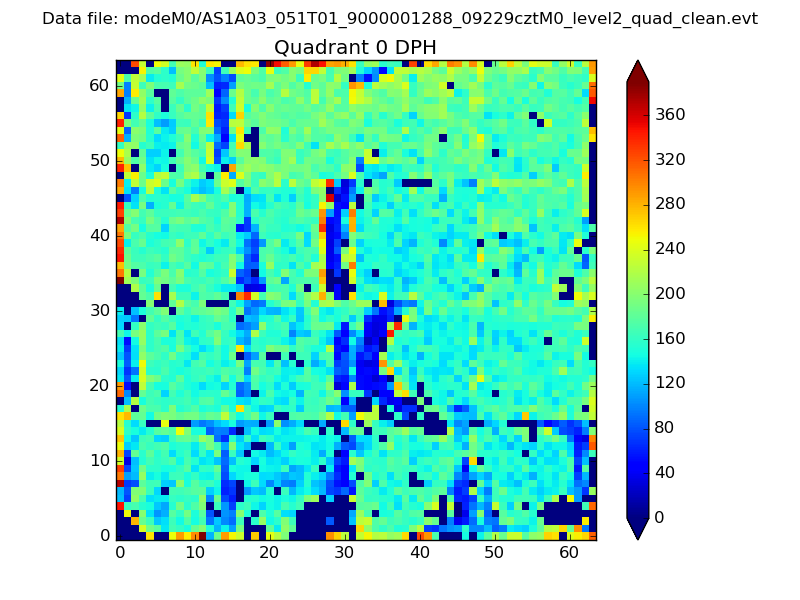 |
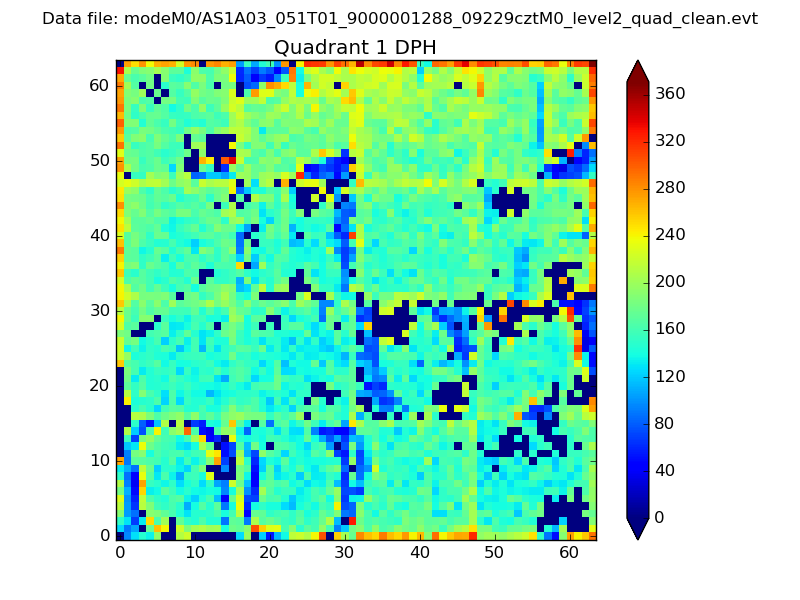 |
Quadrant B |
|---|---|---|---|
| Quadrant D | 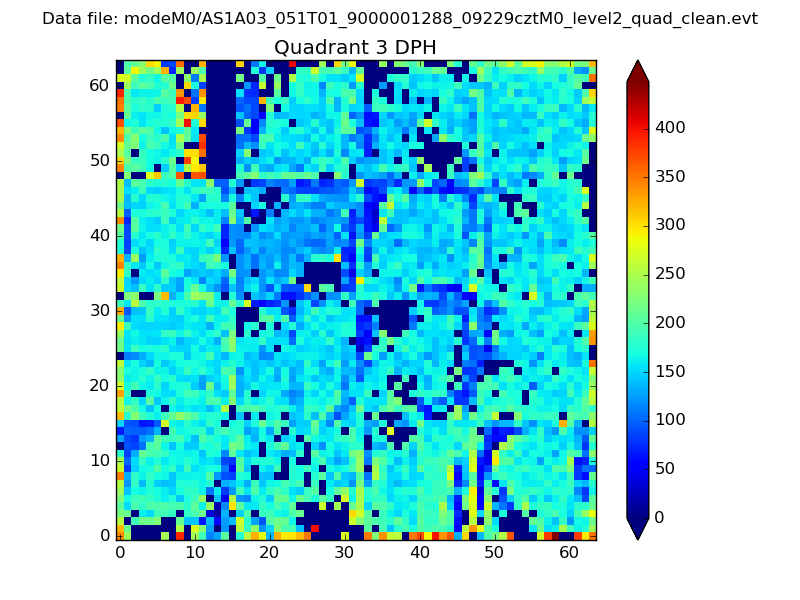 |
 |
Quadrant C |
| Plot type | Count rate plots | Images |
|---|---|---|
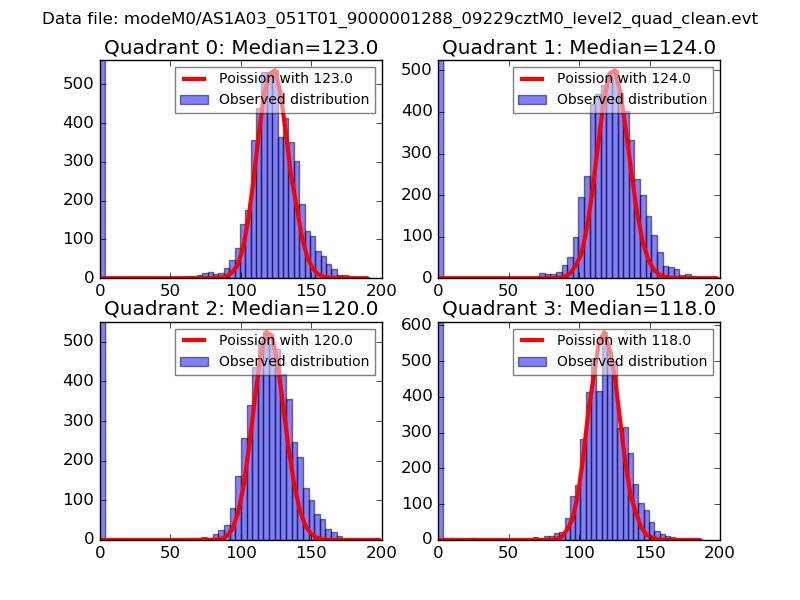
| Comparison with Poisson distribution Blue bars denote a histogram of data divided into 1 sec bins. Red curve is a Poisson curve with rate = median count rate of data. |
 |
 |
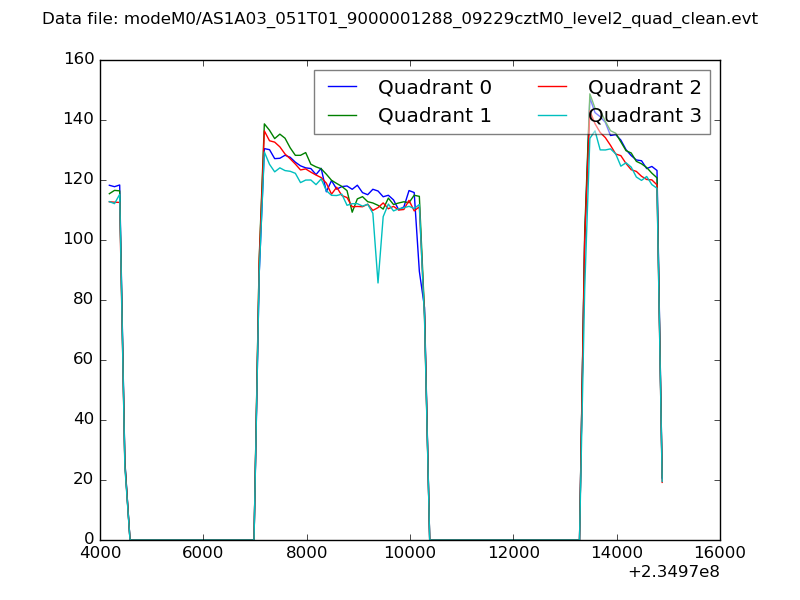
| Quadrant-wise count rates Data is divided into 100 sec bins |
 |
|
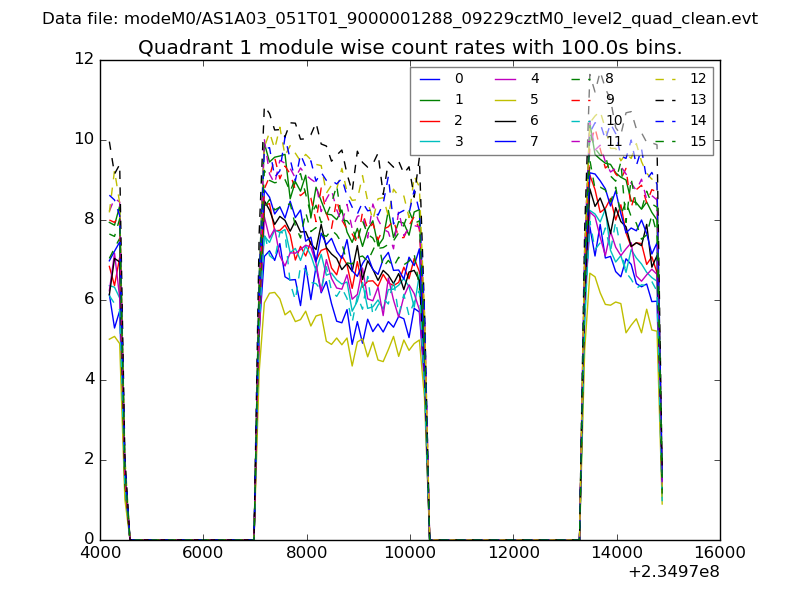
| Module-wise count rates for Quadrant A Data is divided into 100 sec bins |
 |
 |
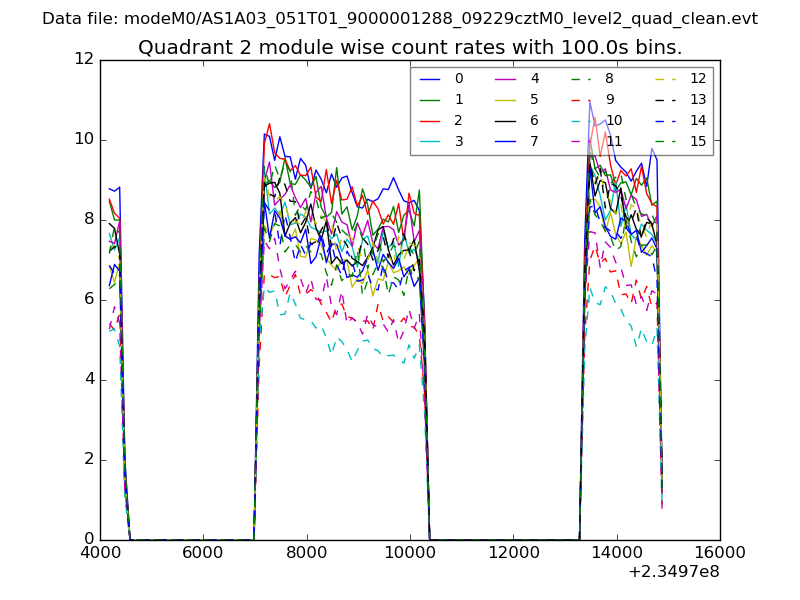
| Module-wise count rates for Quadrant B Data is divided into 100 sec bins |
 |
 |
| Module-wise count rates for Quadrant C Data is divided into 100 sec bins |
 |
 |
| Module-wise count rates for Quadrant D Data is divided into 100 sec bins |
 |
 |
| Parameter | Plot |
|---|---|
| CZT HV Monitor | 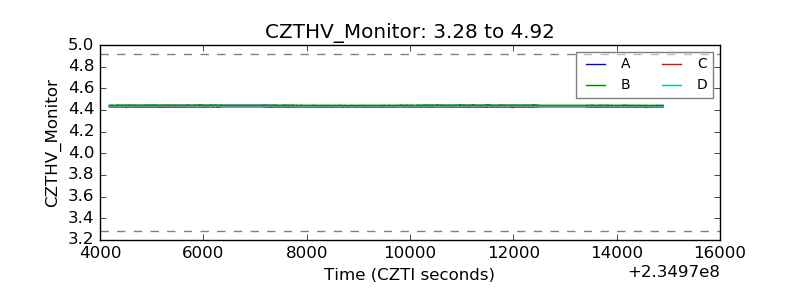 |
| D_VDD | 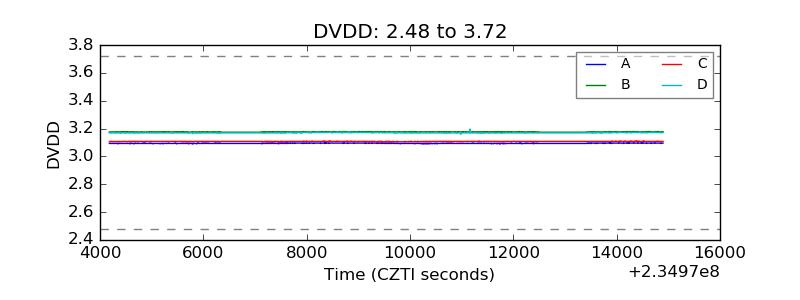 |
| Temperature 1 |  |
| Veto HV Monitor | 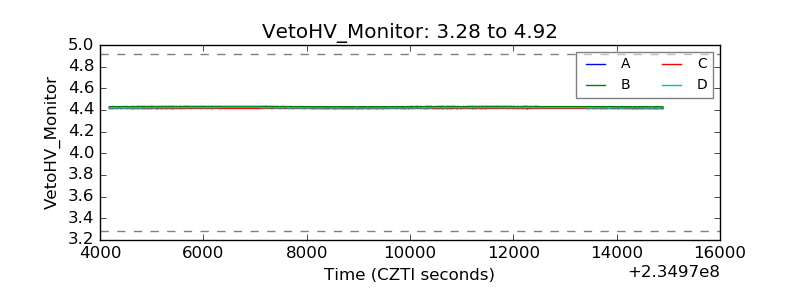 |
| Veto LLD | 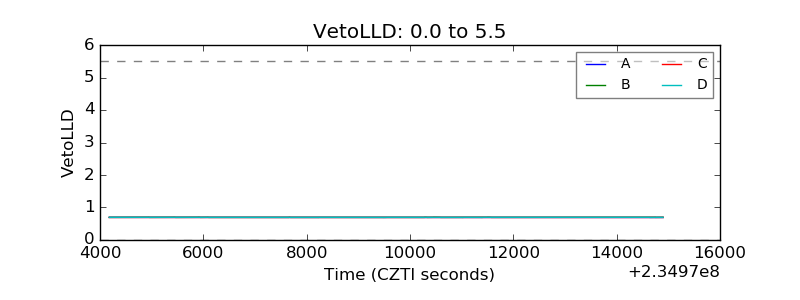 |
| Alpha Counter | 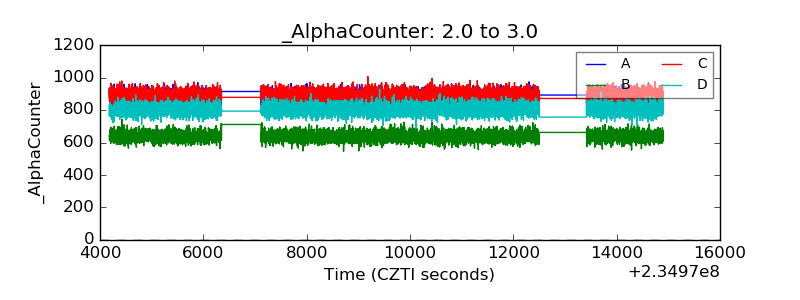 |
| _CPM_Rate | 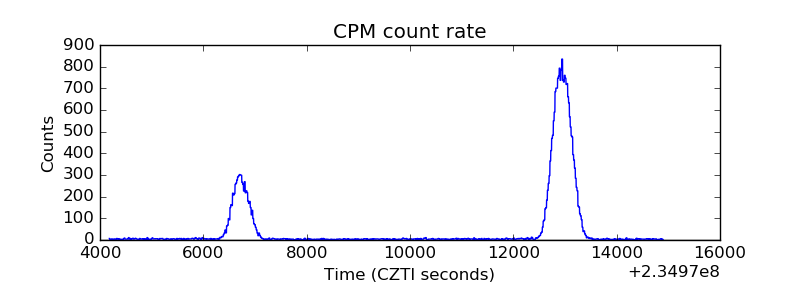 |
| CZT Counter | 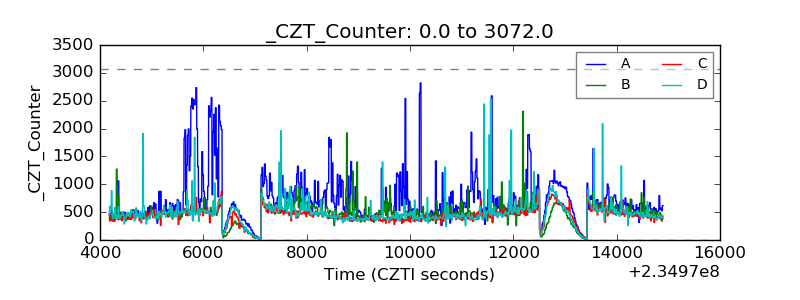 |
| +2.5 Volts monitor |  |
| +5 Volts monitor |  |
| _ROLL_ROT | 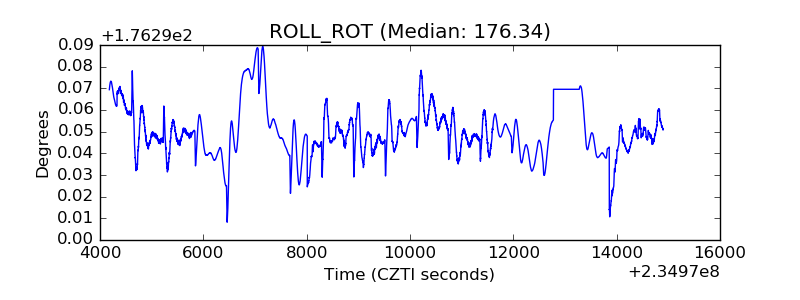 |
| _Roll_DEC | 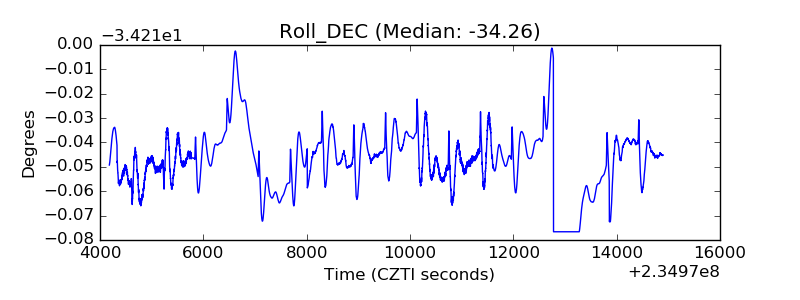 |
| _Roll_RA | 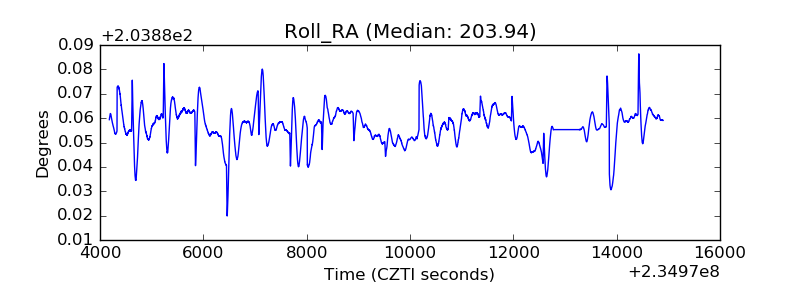 |
| Veto Counter | 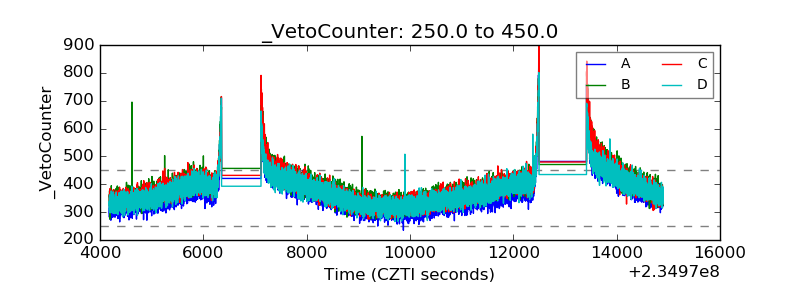 |