| Param | Original file | Final file |
|---|---|---|
| Filename | modeM0/AS1A03_051T01_9000001288_09231cztM0_level2.evt | modeM0/AS1A03_051T01_9000001288_09231cztM0_level2_quad_clean.evt |
| Size (bytes) | 465,053,760 | 86,685,120 |
| Size | 443.5 MB | 82.7 MB |
| Events in quadrant A | 4,196,195 | 549,549 |
| Events in quadrant B | 3,266,264 | 556,572 |
| Events in quadrant C | 2,921,235 | 540,139 |
| Events in quadrant D | 3,263,390 | 529,785 |
| Mode SS | |||
|---|---|---|---|
| Quadrant | BADHDUFLAG | Total packets | Discarded packets |
| A | 0 | 130 | 0 |
| B | 0 | 130 | 0 |
| C | 0 | 130 | 0 |
| D | 0 | 130 | 0 |
| Mode M0 | |||
|---|---|---|---|
| Quadrant | BADHDUFLAG | Total packets | Discarded packets |
| A | 0 | 16830 | 6 |
| B | 0 | 13932 | 2 |
| C | 0 | 13178 | 4 |
| D | 0 | 14175 | 2 |
| Mode M9 | |||
|---|---|---|---|
| Quadrant | BADHDUFLAG | Total packets | Discarded packets |
| A | 0 | 12 | 0 |
| B | 0 | 12 | 0 |
| C | 0 | 12 | 0 |
| D | 0 | 13 | 0 |
| Quadrant | Total seconds | Saturated seconds | Saturation percentage |
|---|---|---|---|
| A | 6436 | 185 | 2.874456% |
| B | 6437 | 49 | 0.761224% |
| C | 6436 | 27 | 0.419515% |
| D | 6437 | 74 | 1.149604% |
Noise dominated data is calculated using 1-second bins in cleaned event files. If a bin has >2000 counts, and if more than 50% of those come from <1% of pixels, then it is considered to be noise-dominated and hence unusable.
| Quadrant | # 1 sec bins | Bins with >0 counts | Bins with >2000 counts | High rate bins dominated by noise | Noise dominated (total time) | Noise dominated (detector-on time) | Marked lightcurve |
|---|---|---|---|---|---|---|---|
| A | 7512 | 6438 | 88 | 88 | 1.17% | 1.37% | 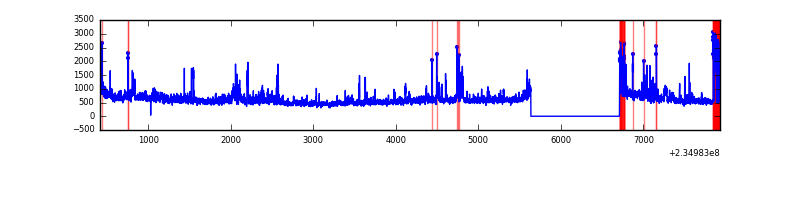 |
| B | 7512 | 6438 | 6 | 6 | 0.08% | 0.09% | 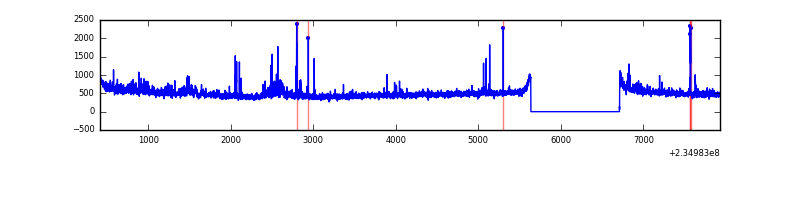 |
| C | 7512 | 6438 | 0 | 0 | 0.00% | 0.00% | 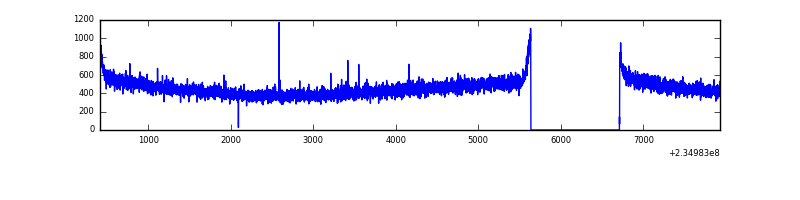 |
| D | 7512 | 6438 | 30 | 30 | 0.40% | 0.47% |  |
Top three noisy pixels from each quadrant. If the there are fewer than three noisy pixels in the level2.evt file, extra rows are filled as -1
| Pixel properties | Quadrant properties | ||||||
|---|---|---|---|---|---|---|---|
| Quadrant | DetID | PixID | Counts | Sigma | Mean | Median | Sigma |
| A | 8 | 5 | 931630 | 5900.89 | 775 | 760 | 157.8 |
| A | 1 | 162 | 90909 | 571.46 | 775 | 760 | 157.8 |
| A | 13 | 251 | 44019 | 274.22 | 775 | 760 | 157.8 |
| B | 0 | 214 | 58328 | 381.9 | 780 | 764 | 150.7 |
| B | 0 | 245 | 50966 | 333.06 | 780 | 764 | 150.7 |
| B | 4 | 48 | 33280 | 215.72 | 780 | 764 | 150.7 |
| C | 13 | 61 | 5691 | 28.4 | 745 | 749 | 174.0 |
| C | 3 | 233 | 5517 | 27.4 | 745 | 749 | 174.0 |
| C | 14 | 67 | 3813 | 17.61 | 745 | 749 | 174.0 |
| D | 1 | 52 | 123928 | 668.88 | 749 | 725 | 184.2 |
| D | 7 | 71 | 109224 | 589.05 | 749 | 725 | 184.2 |
| D | 12 | 233 | 70125 | 376.78 | 749 | 725 | 184.2 |
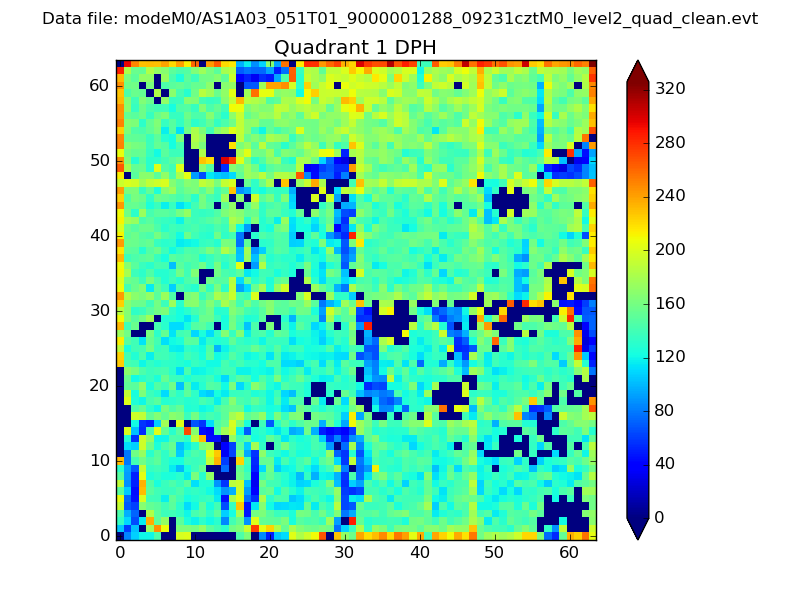
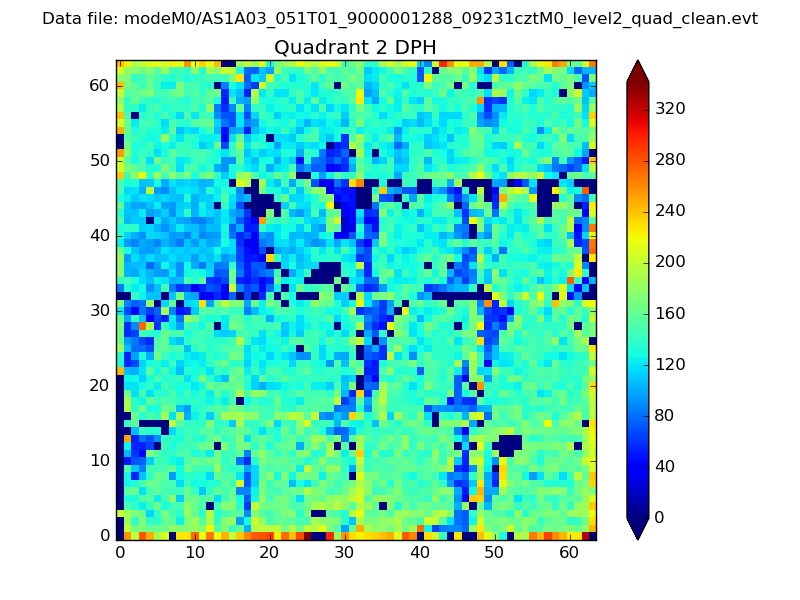
Histogram calculated using DETX and DETY for each event in the final _common_clean file
| Quadrant A |  |
 |
Quadrant B |
|---|---|---|---|
| Quadrant D | 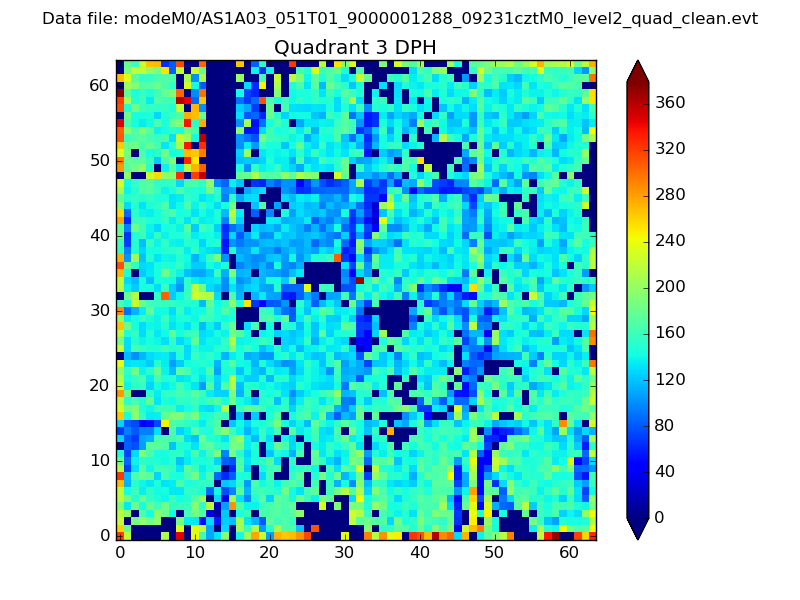 |
 |
Quadrant C |
| Plot type | Count rate plots | Images |
|---|---|---|
| Comparison with Poisson distribution Blue bars denote a histogram of data divided into 1 sec bins. Red curve is a Poisson curve with rate = median count rate of data. |
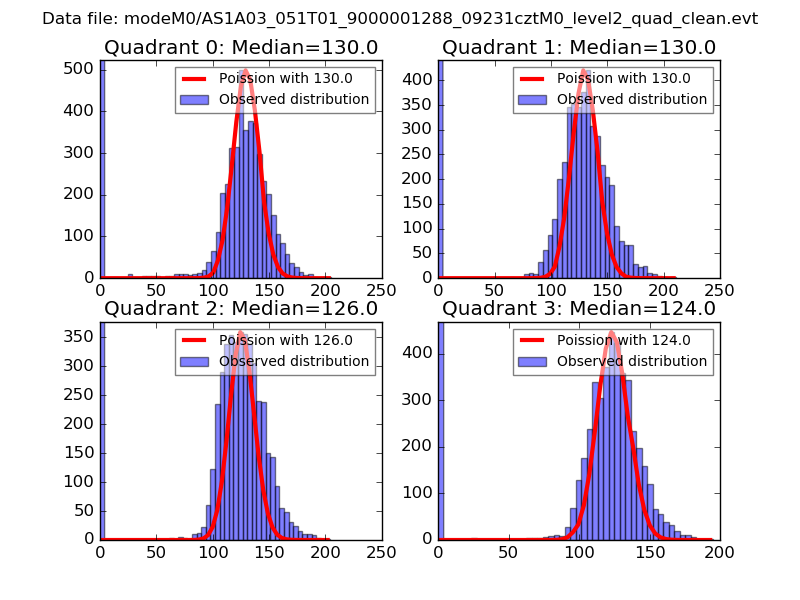 |
 |
| Quadrant-wise count rates Data is divided into 100 sec bins |
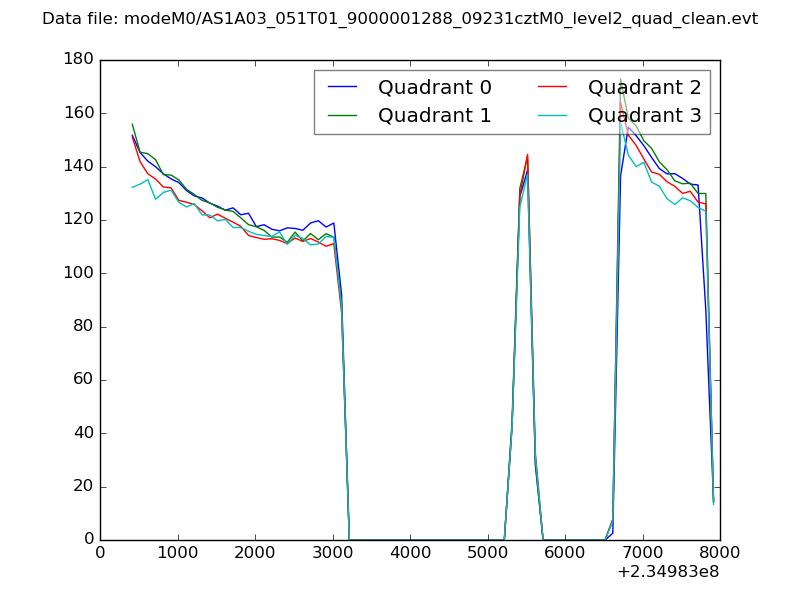 |
|
| Module-wise count rates for Quadrant A Data is divided into 100 sec bins |
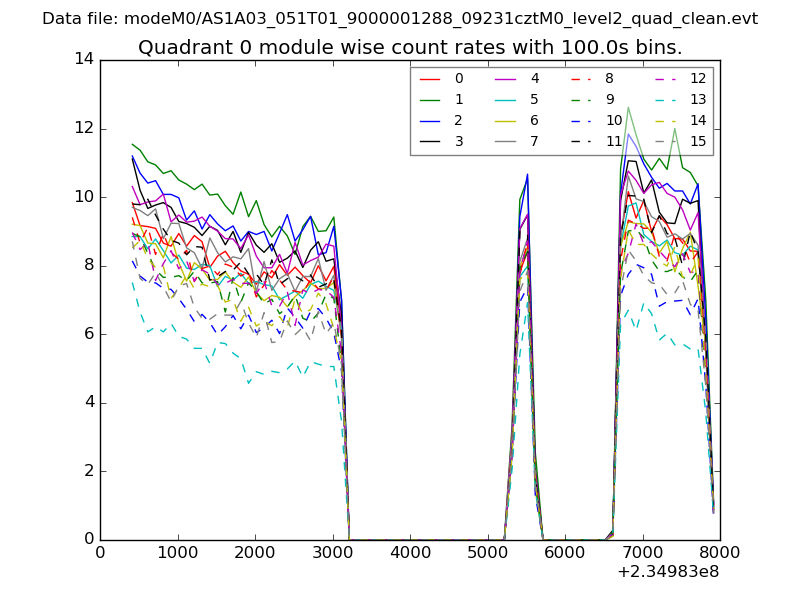 |
 |
| Module-wise count rates for Quadrant B Data is divided into 100 sec bins |
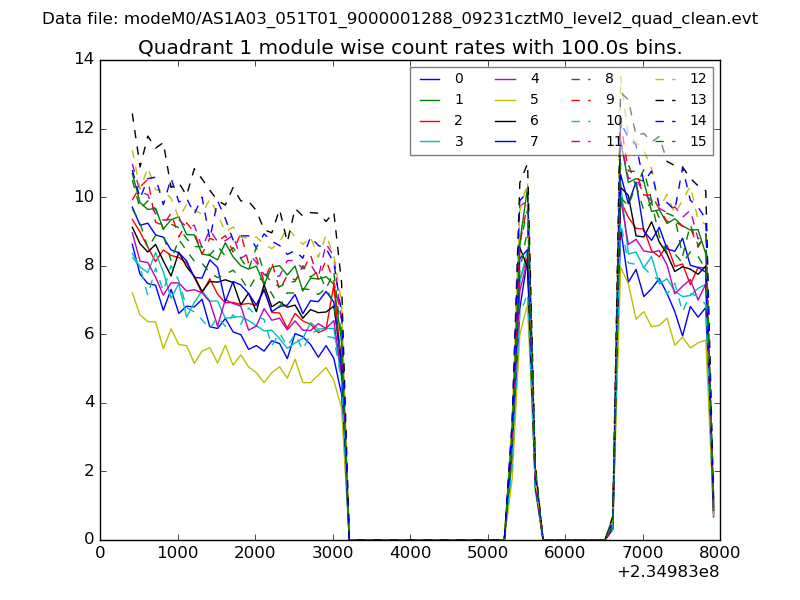 |
 |
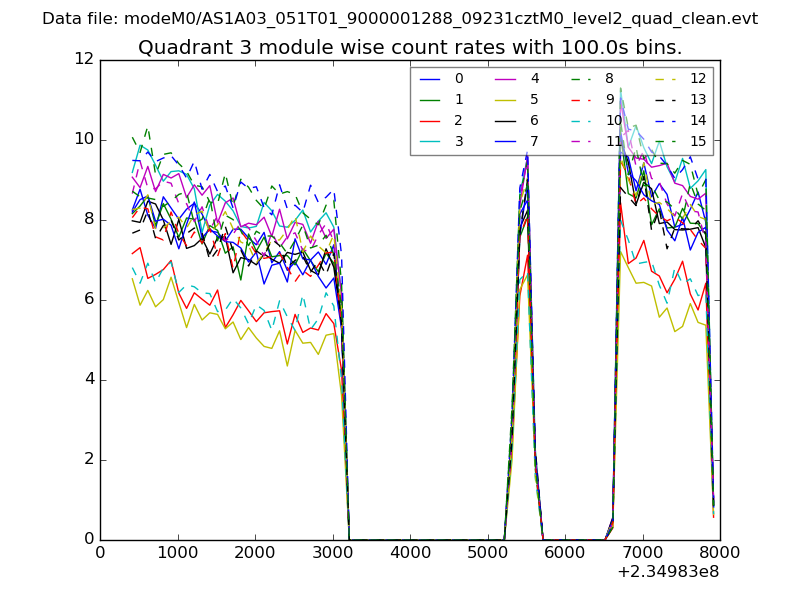
| Module-wise count rates for Quadrant C Data is divided into 100 sec bins |
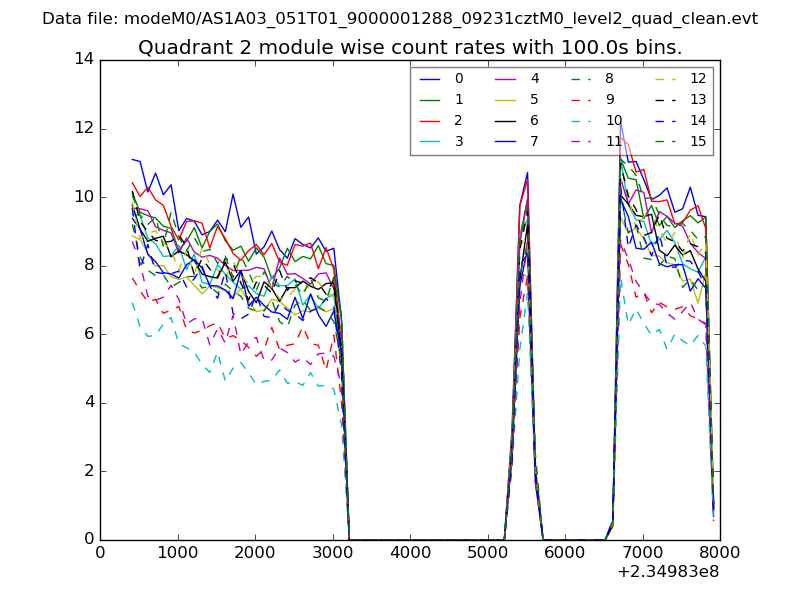 |
 |
| Module-wise count rates for Quadrant D Data is divided into 100 sec bins |
 |
 |
| Parameter | Plot |
|---|---|
| CZT HV Monitor | 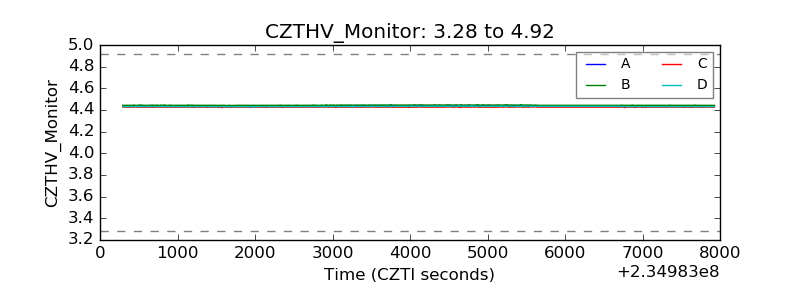 |
| D_VDD | 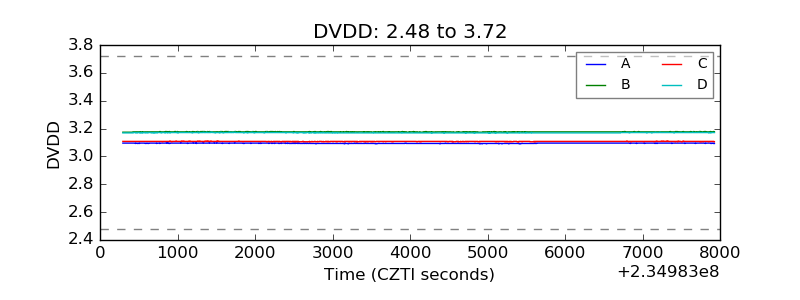 |
| Temperature 1 | 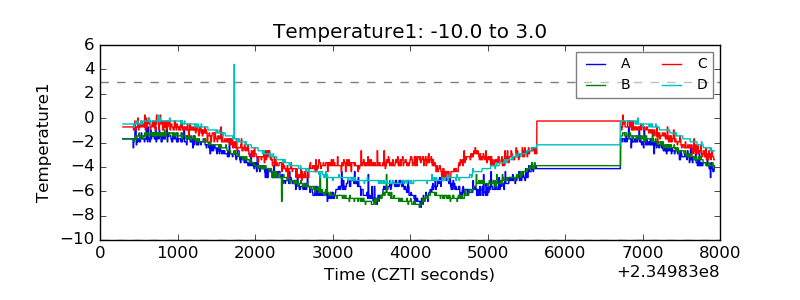 |
| Veto HV Monitor | 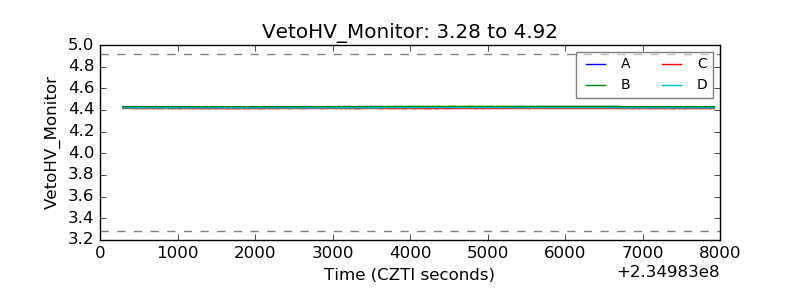 |
| Veto LLD | 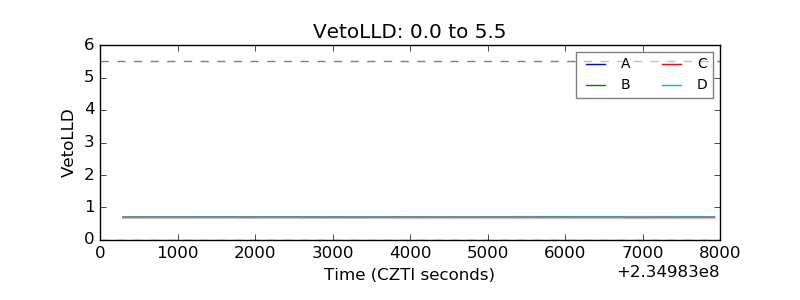 |
| Alpha Counter | 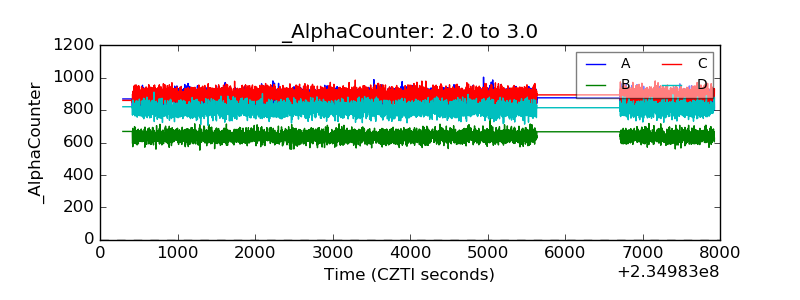 |
| _CPM_Rate | 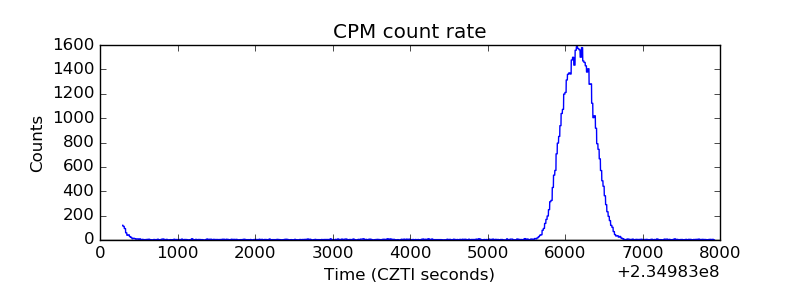 |
| CZT Counter | 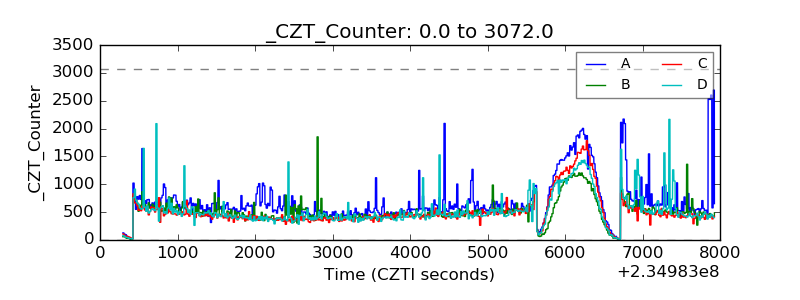 |
| +2.5 Volts monitor |  |
| +5 Volts monitor | 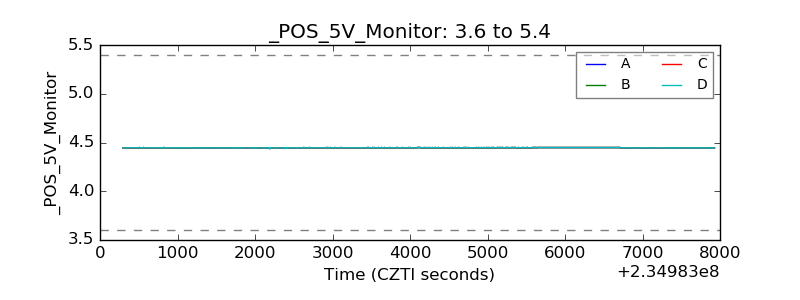 |
| _ROLL_ROT | 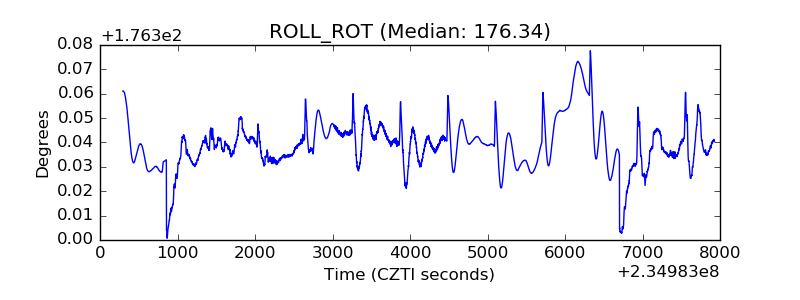 |
| _Roll_DEC | 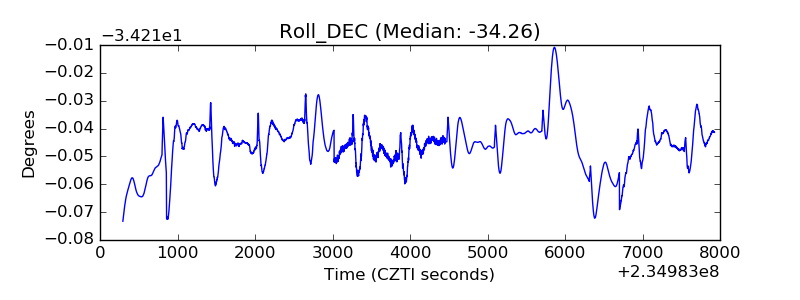 |
| _Roll_RA |  |
| Veto Counter | 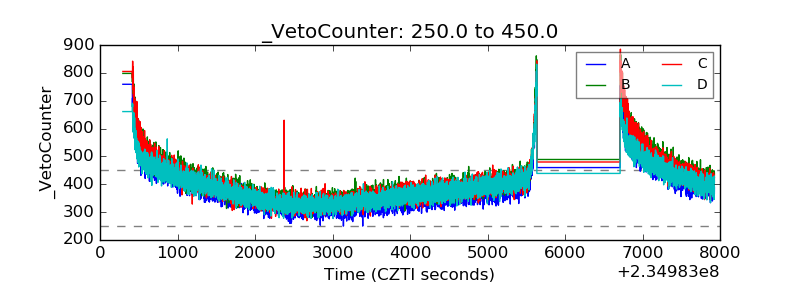 |