| Param | Original file | Final file |
|---|---|---|
| Filename | modeM0/AS1A03_051T01_9000001288_09232cztM0_level2.evt | modeM0/AS1A03_051T01_9000001288_09232cztM0_level2_quad_clean.evt |
| Size (bytes) | 458,225,280 | 88,122,240 |
| Size | 437.0 MB | 84.0 MB |
| Events in quadrant A | 3,839,302 | 561,625 |
| Events in quadrant B | 3,307,843 | 571,884 |
| Events in quadrant C | 2,899,241 | 553,809 |
| Events in quadrant D | 3,400,845 | 539,568 |
| Mode SS | |||
|---|---|---|---|
| Quadrant | BADHDUFLAG | Total packets | Discarded packets |
| A | 0 | 128 | 0 |
| B | 0 | 128 | 0 |
| C | 0 | 128 | 0 |
| D | 0 | 128 | 0 |
| Mode M0 | |||
|---|---|---|---|
| Quadrant | BADHDUFLAG | Total packets | Discarded packets |
| A | 0 | 15425 | 18 |
| B | 0 | 13864 | 13 |
| C | 0 | 12966 | 12 |
| D | 0 | 14727 | 28 |
| Mode M9 | |||
|---|---|---|---|
| Quadrant | BADHDUFLAG | Total packets | Discarded packets |
| A | 0 | 21 | 0 |
| B | 0 | 21 | 0 |
| C | 0 | 21 | 0 |
| D | 0 | 22 | 0 |
| Quadrant | Total seconds | Saturated seconds | Saturation percentage |
|---|---|---|---|
| A | 6334 | 138 | 2.178718% |
| B | 6333 | 38 | 0.600032% |
| C | 6333 | 11 | 0.173693% |
| D | 6328 | 55 | 0.869153% |
Noise dominated data is calculated using 1-second bins in cleaned event files. If a bin has >2000 counts, and if more than 50% of those come from <1% of pixels, then it is considered to be noise-dominated and hence unusable.
| Quadrant | # 1 sec bins | Bins with >0 counts | Bins with >2000 counts | High rate bins dominated by noise | Noise dominated (total time) | Noise dominated (detector-on time) | Marked lightcurve |
|---|---|---|---|---|---|---|---|
| A | 7553 | 6338 | 87 | 87 | 1.15% | 1.37% | 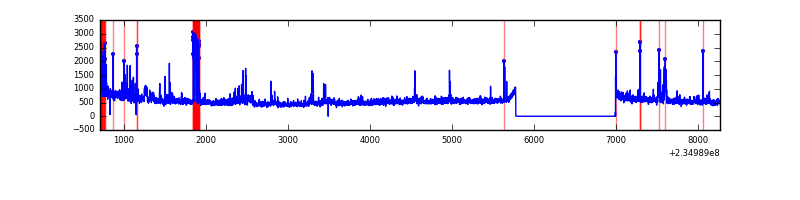 |
| B | 7553 | 6338 | 11 | 11 | 0.15% | 0.17% | 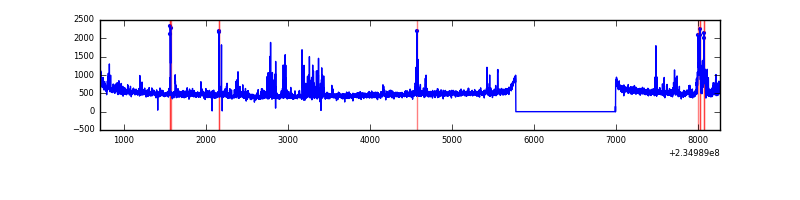 |
| C | 7553 | 6338 | 0 | 0 | 0.00% | 0.00% | 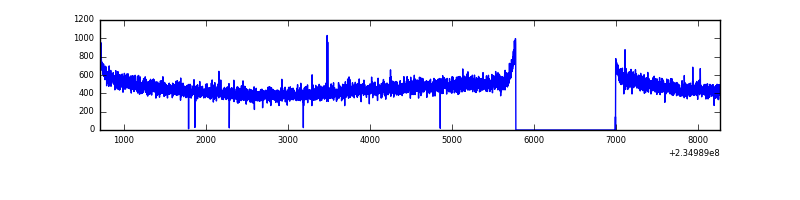 |
| D | 7553 | 6339 | 46 | 46 | 0.61% | 0.73% | 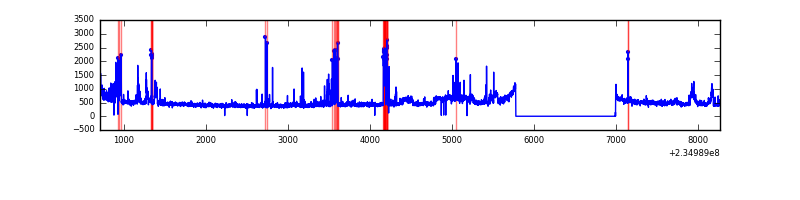 |
Top three noisy pixels from each quadrant. If the there are fewer than three noisy pixels in the level2.evt file, extra rows are filled as -1
| Pixel properties | Quadrant properties | ||||||
|---|---|---|---|---|---|---|---|
| Quadrant | DetID | PixID | Counts | Sigma | Mean | Median | Sigma |
| A | 8 | 5 | 689988 | 4414.74 | 767 | 753 | 156.1 |
| A | 1 | 162 | 80817 | 512.83 | 767 | 753 | 156.1 |
| A | 13 | 251 | 29148 | 181.88 | 767 | 753 | 156.1 |
| B | 4 | 48 | 117057 | 782.99 | 778 | 760 | 148.5 |
| B | 0 | 245 | 75894 | 505.85 | 778 | 760 | 148.5 |
| B | 0 | 214 | 25368 | 165.68 | 778 | 760 | 148.5 |
| C | 13 | 61 | 5740 | 28.96 | 741 | 744 | 172.5 |
| C | 8 | 222 | 4643 | 22.6 | 741 | 744 | 172.5 |
| C | 14 | 67 | 3123 | 13.79 | 741 | 744 | 172.5 |
| D | 1 | 52 | 392127 | 1961.2 | 731 | 717 | 199.6 |
| D | 5 | 97 | 79601 | 395.26 | 731 | 717 | 199.6 |
| D | 7 | 71 | 62611 | 310.13 | 731 | 717 | 199.6 |
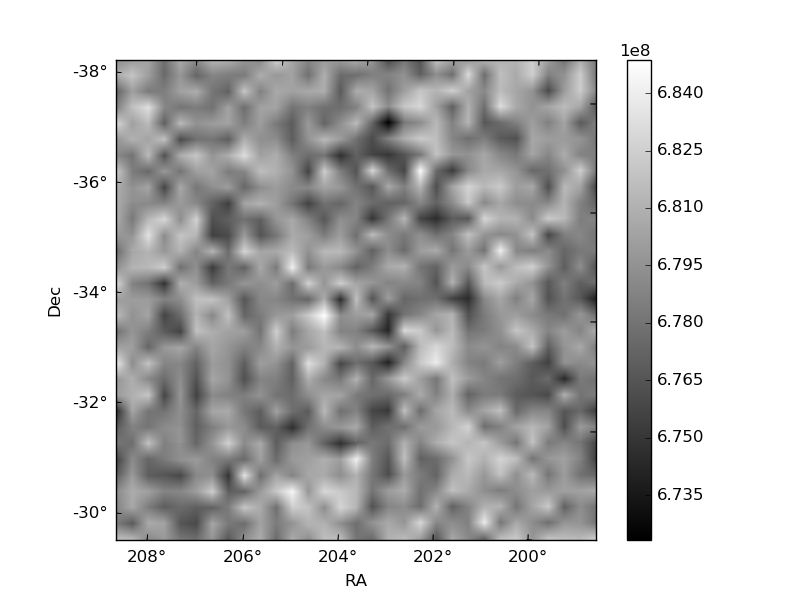
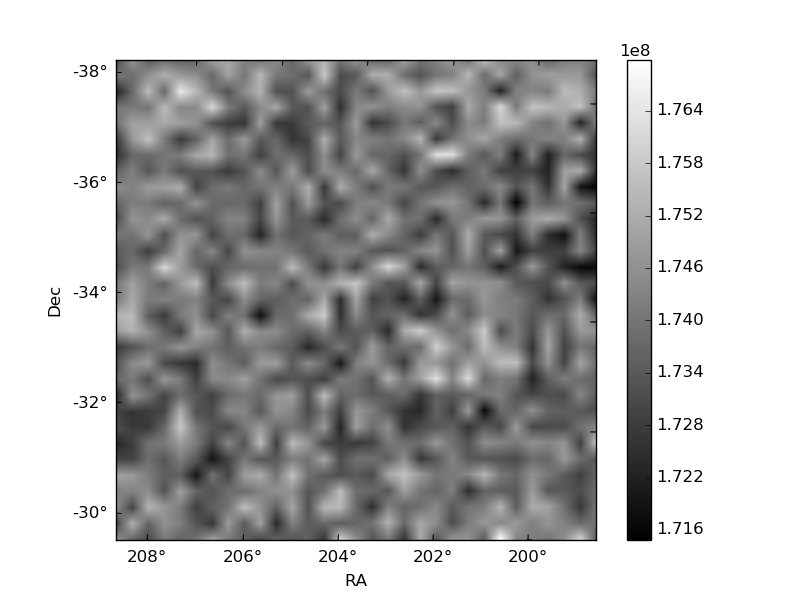
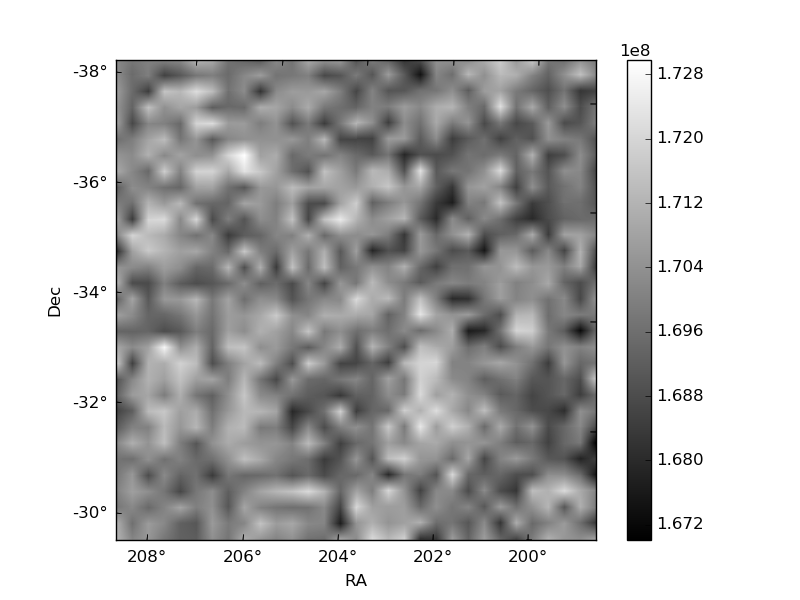
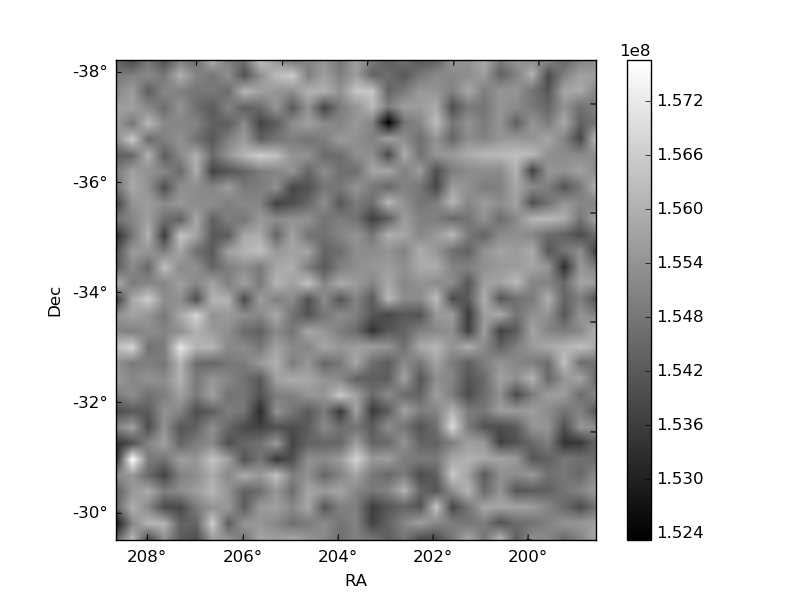
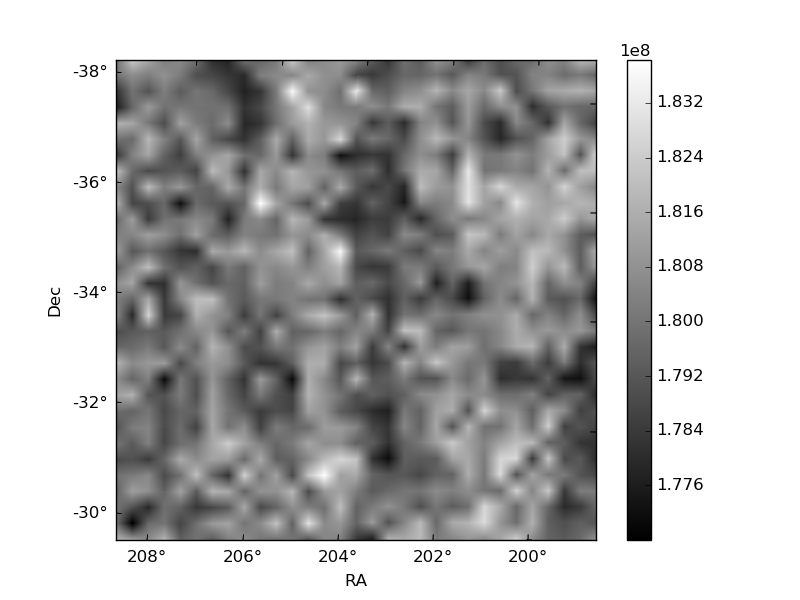
Histogram calculated using DETX and DETY for each event in the final _common_clean file
| Quadrant A | 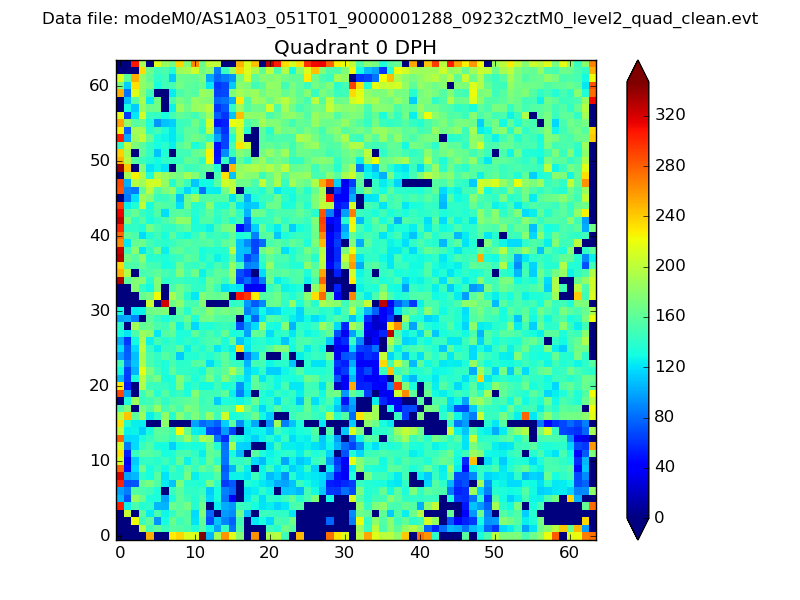 |
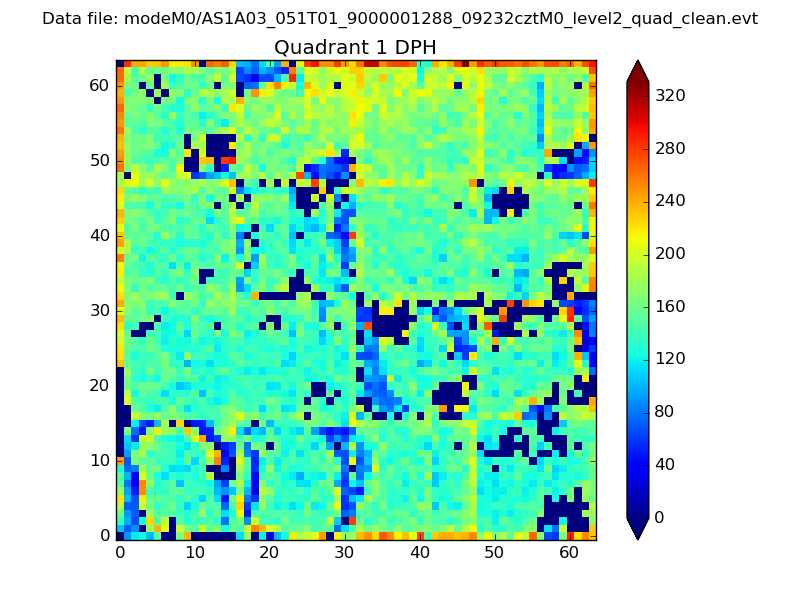 |
Quadrant B |
|---|---|---|---|
| Quadrant D | 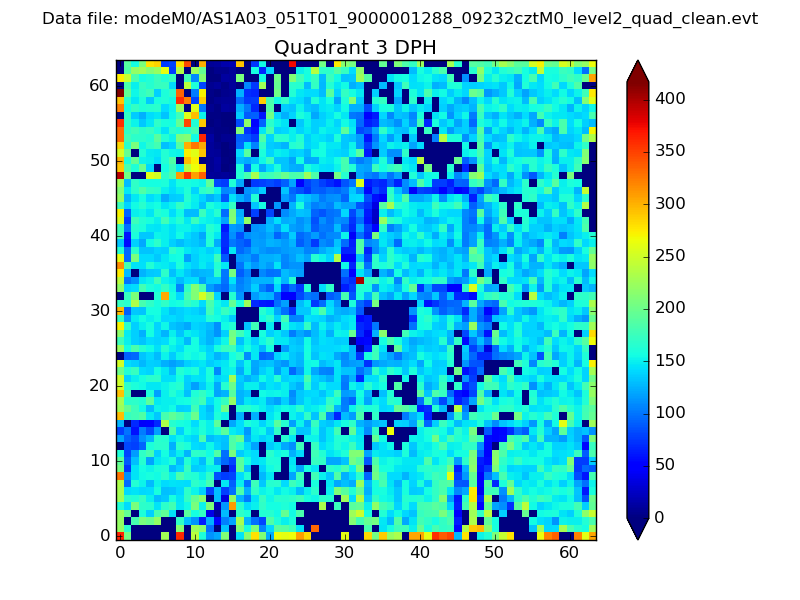 |
 |
Quadrant C |
| Plot type | Count rate plots | Images |
|---|---|---|
| Comparison with Poisson distribution Blue bars denote a histogram of data divided into 1 sec bins. Red curve is a Poisson curve with rate = median count rate of data. |
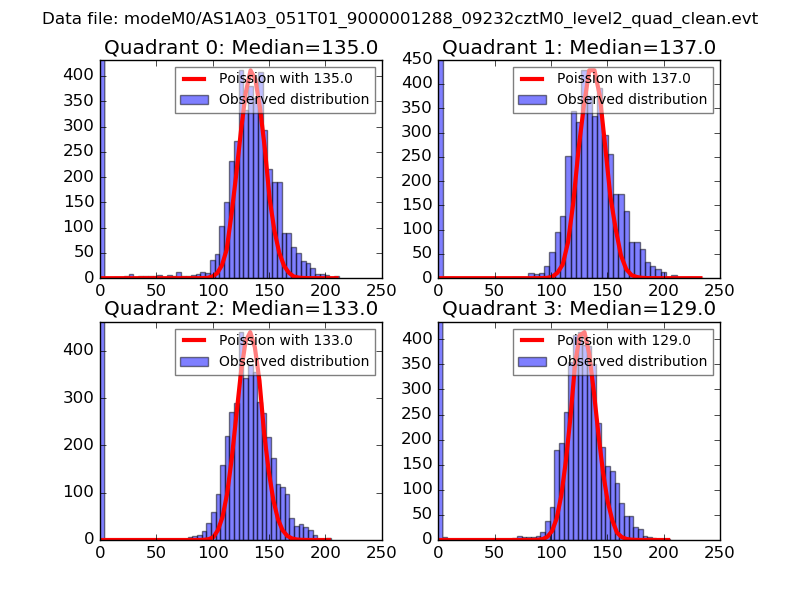 |
 |
| Quadrant-wise count rates Data is divided into 100 sec bins |
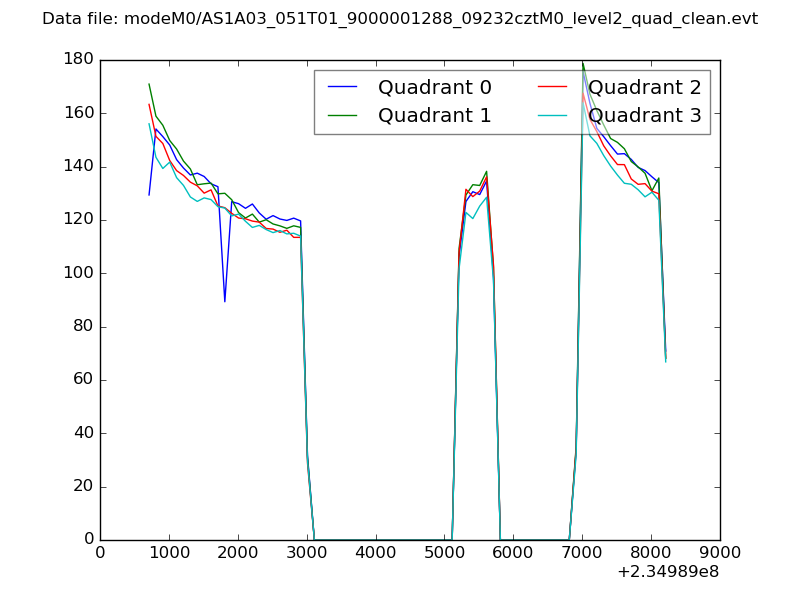 |
|
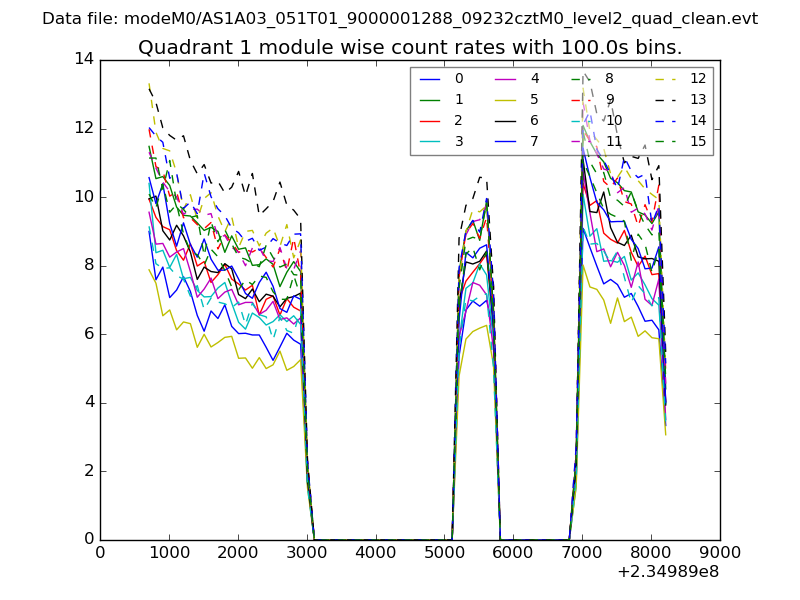
| Module-wise count rates for Quadrant A Data is divided into 100 sec bins |
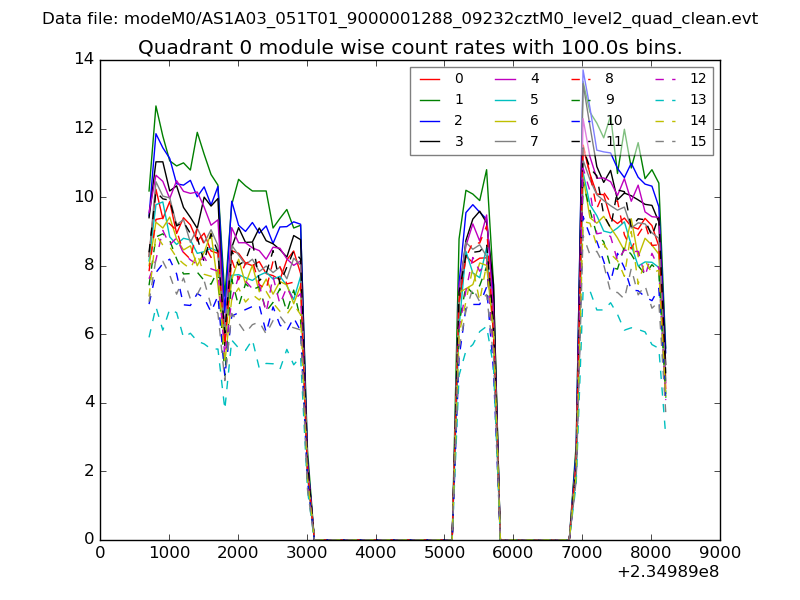 |
 |
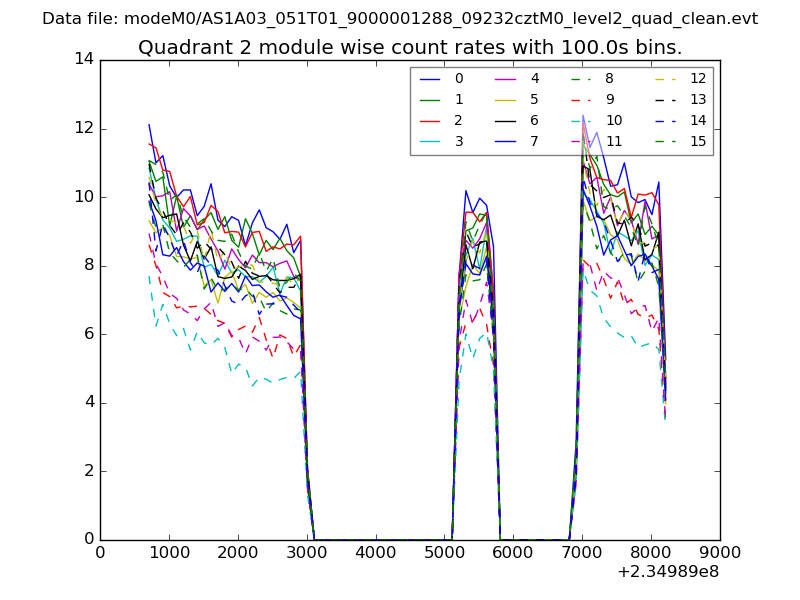
| Module-wise count rates for Quadrant B Data is divided into 100 sec bins |
 |
 |
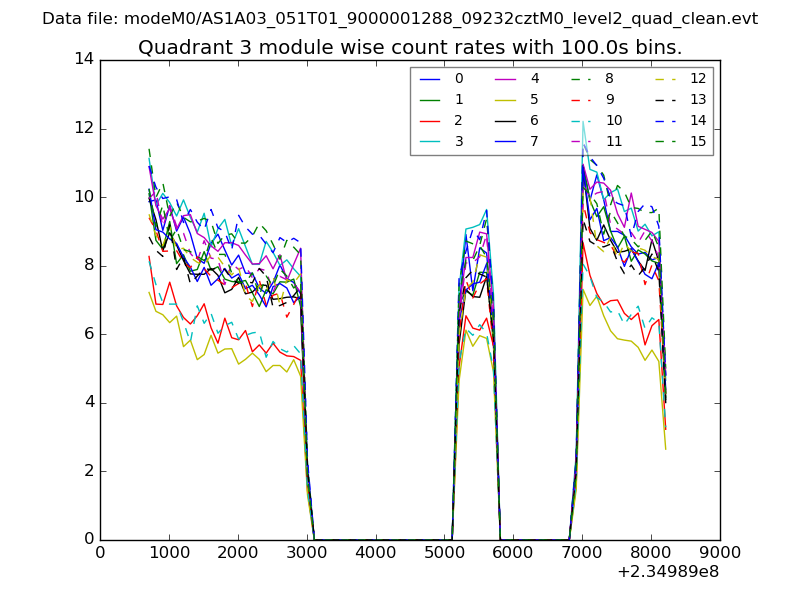
| Module-wise count rates for Quadrant C Data is divided into 100 sec bins |
 |
 |
| Module-wise count rates for Quadrant D Data is divided into 100 sec bins |
 |
 |
| Parameter | Plot |
|---|---|
| CZT HV Monitor | 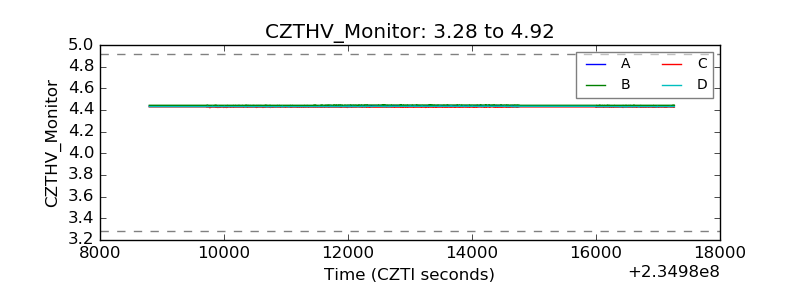 |
| D_VDD | 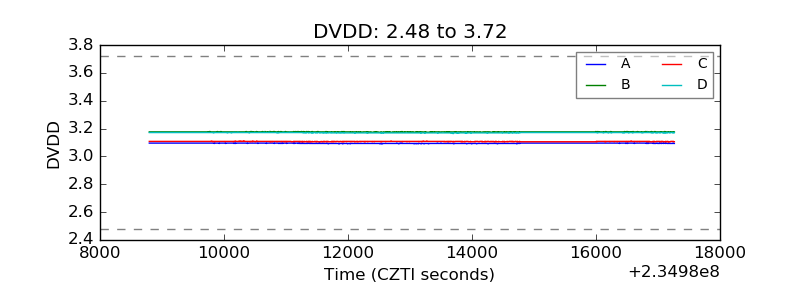 |
| Temperature 1 | 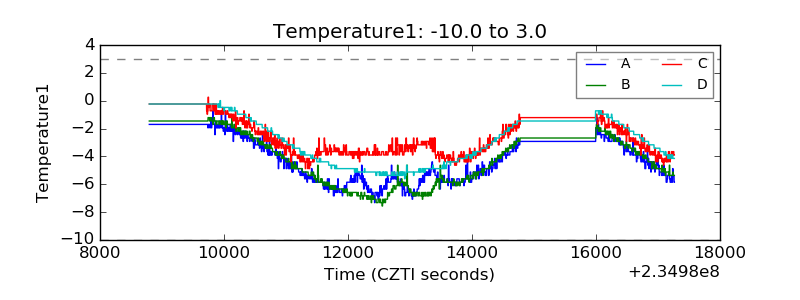 |
| Veto HV Monitor |  |
| Veto LLD | 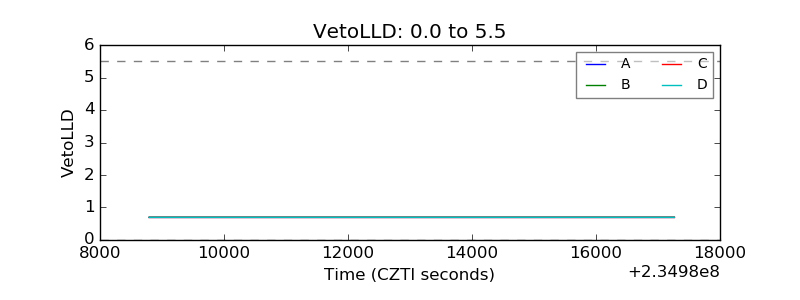 |
| Alpha Counter | 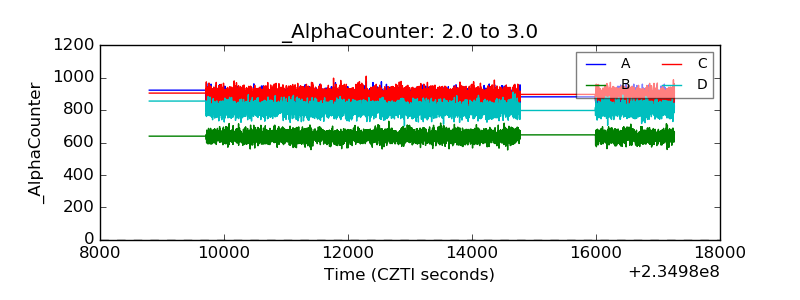 |
| _CPM_Rate | 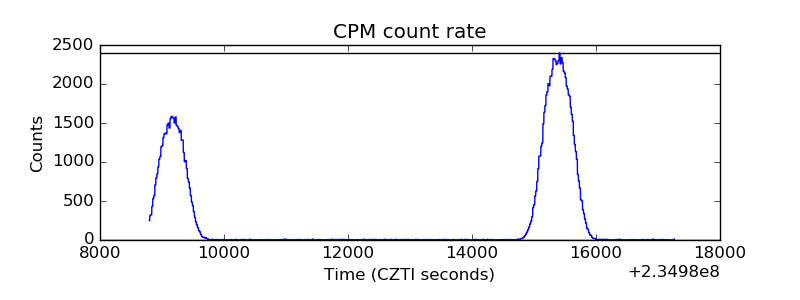 |
| CZT Counter |  |
| +2.5 Volts monitor |  |
| +5 Volts monitor |  |
| _ROLL_ROT |  |
| _Roll_DEC | 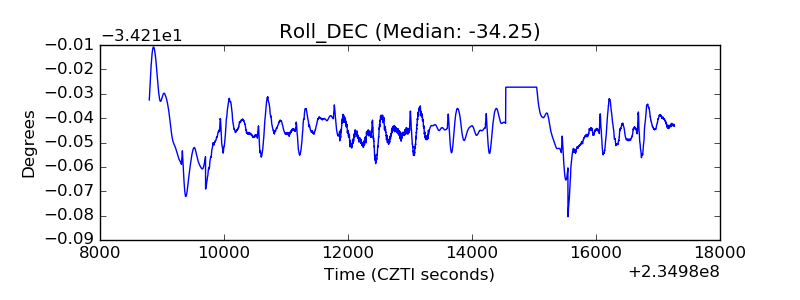 |
| _Roll_RA | 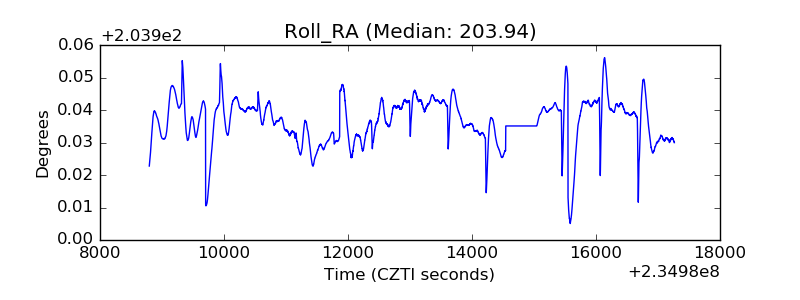 |
| Veto Counter | 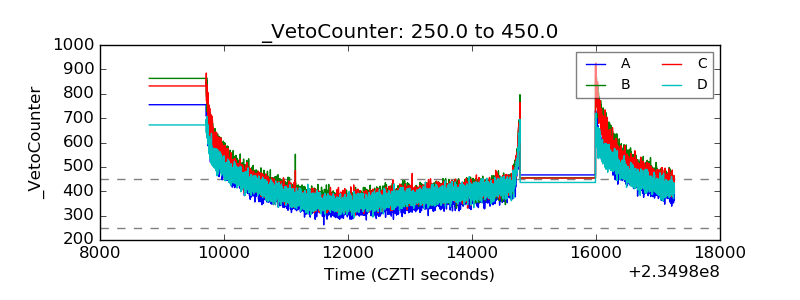 |