| Param | Original file | Final file |
|---|---|---|
| Filename | modeM0/AS1A03_051T01_9000001288_09233cztM0_level2.evt | modeM0/AS1A03_051T01_9000001288_09233cztM0_level2_quad_clean.evt |
| Size (bytes) | 451,537,920 | 88,977,600 |
| Size | 430.6 MB | 84.9 MB |
| Events in quadrant A | 3,421,649 | 577,319 |
| Events in quadrant B | 3,519,939 | 581,802 |
| Events in quadrant C | 2,903,367 | 562,873 |
| Events in quadrant D | 3,406,939 | 537,803 |
| Mode SS | |||
|---|---|---|---|
| Quadrant | BADHDUFLAG | Total packets | Discarded packets |
| A | 0 | 128 | 0 |
| B | 0 | 128 | 0 |
| C | 0 | 128 | 0 |
| D | 0 | 128 | 0 |
| Mode M0 | |||
|---|---|---|---|
| Quadrant | BADHDUFLAG | Total packets | Discarded packets |
| A | 0 | 14099 | 33 |
| B | 0 | 14442 | 34 |
| C | 0 | 12788 | 24 |
| D | 0 | 14293 | 29 |
| Mode M9 | |||
|---|---|---|---|
| Quadrant | BADHDUFLAG | Total packets | Discarded packets |
| A | 0 | 21 | 0 |
| B | 0 | 21 | 0 |
| C | 0 | 21 | 0 |
| D | 0 | 22 | 0 |
| Quadrant | Total seconds | Saturated seconds | Saturation percentage |
|---|---|---|---|
| A | 6221 | 25 | 0.401865% |
| B | 6221 | 62 | 0.996624% |
| C | 6223 | 13 | 0.208902% |
| D | 6222 | 25 | 0.401800% |
Noise dominated data is calculated using 1-second bins in cleaned event files. If a bin has >2000 counts, and if more than 50% of those come from <1% of pixels, then it is considered to be noise-dominated and hence unusable.
| Quadrant | # 1 sec bins | Bins with >0 counts | Bins with >2000 counts | High rate bins dominated by noise | Noise dominated (total time) | Noise dominated (detector-on time) | Marked lightcurve |
|---|---|---|---|---|---|---|---|
| A | 7554 | 6234 | 10 | 10 | 0.13% | 0.16% |  |
| B | 7554 | 6234 | 32 | 32 | 0.42% | 0.51% |  |
| C | 7554 | 6233 | 3 | 3 | 0.04% | 0.05% | 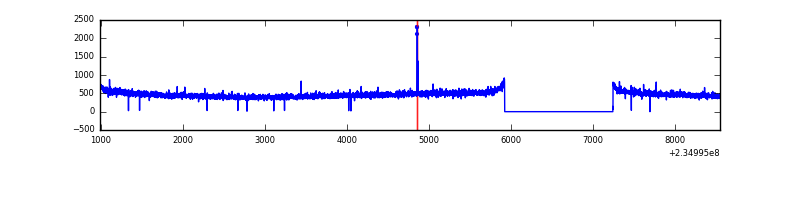 |
| D | 7554 | 6235 | 23 | 23 | 0.30% | 0.37% | 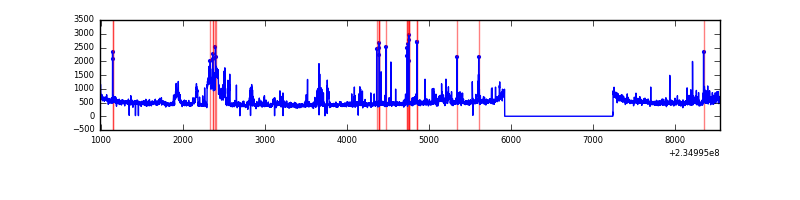 |
Top three noisy pixels from each quadrant. If the there are fewer than three noisy pixels in the level2.evt file, extra rows are filled as -1
| Pixel properties | Quadrant properties | ||||||
|---|---|---|---|---|---|---|---|
| Quadrant | DetID | PixID | Counts | Sigma | Mean | Median | Sigma |
| A | 8 | 5 | 235992 | 1501.13 | 769 | 758 | 156.7 |
| A | 1 | 162 | 104970 | 665.02 | 769 | 758 | 156.7 |
| A | 13 | 251 | 23356 | 144.21 | 769 | 758 | 156.7 |
| B | 0 | 245 | 170981 | 1156.44 | 775 | 757 | 147.2 |
| B | 4 | 48 | 108224 | 730.09 | 775 | 757 | 147.2 |
| B | 8 | 234 | 101126 | 681.87 | 775 | 757 | 147.2 |
| C | 14 | 234 | 11469 | 62.69 | 740 | 746 | 171.1 |
| C | 13 | 61 | 5914 | 30.21 | 740 | 746 | 171.1 |
| C | 14 | 67 | 3589 | 16.62 | 740 | 746 | 171.1 |
| D | 1 | 52 | 424620 | 2357.62 | 733 | 712 | 179.8 |
| D | 11 | 129 | 74119 | 408.26 | 733 | 712 | 179.8 |
| D | 2 | 14 | 43108 | 235.79 | 733 | 712 | 179.8 |
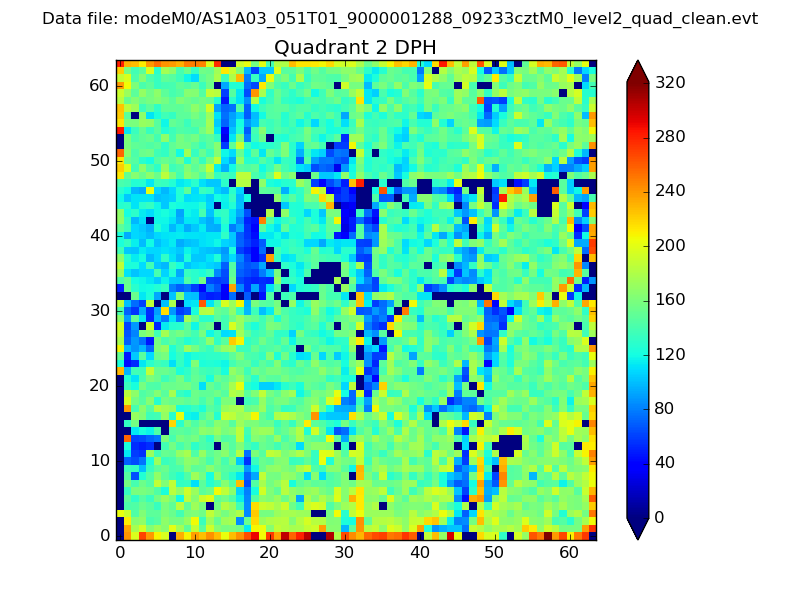
Histogram calculated using DETX and DETY for each event in the final _common_clean file
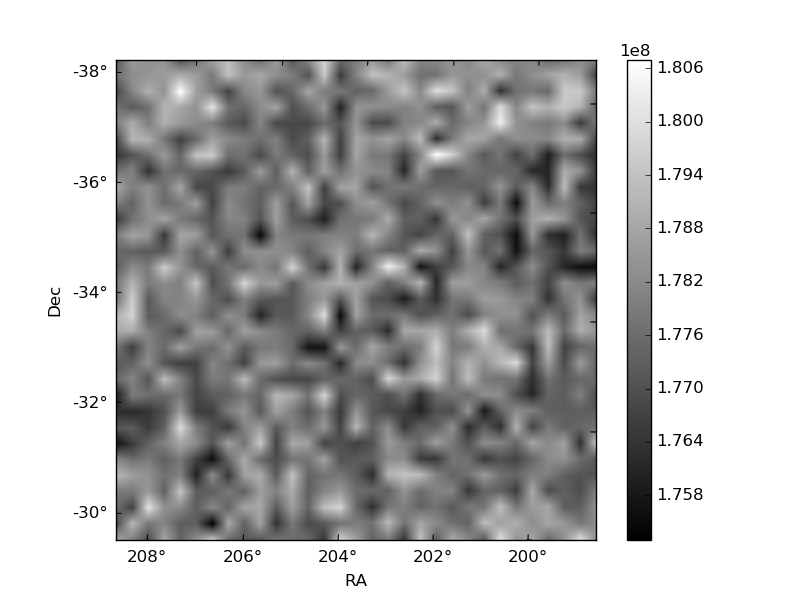
| Quadrant A | 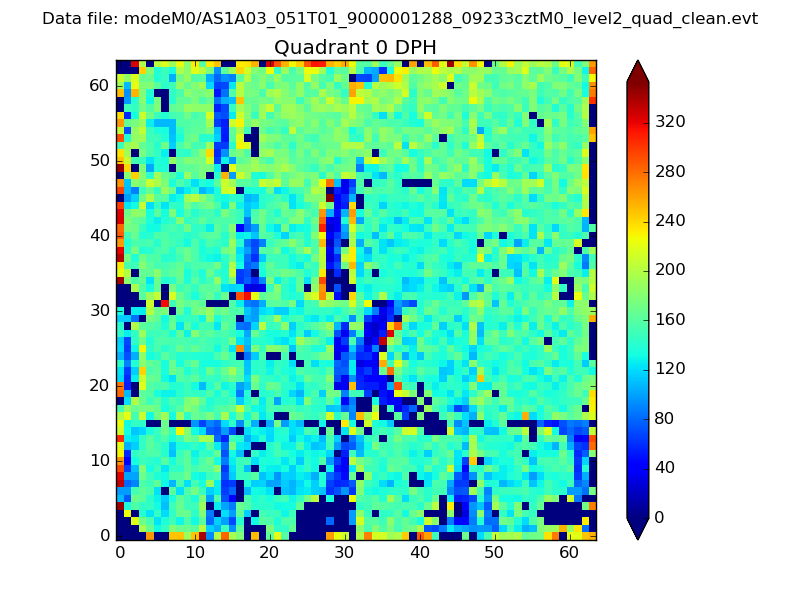 |
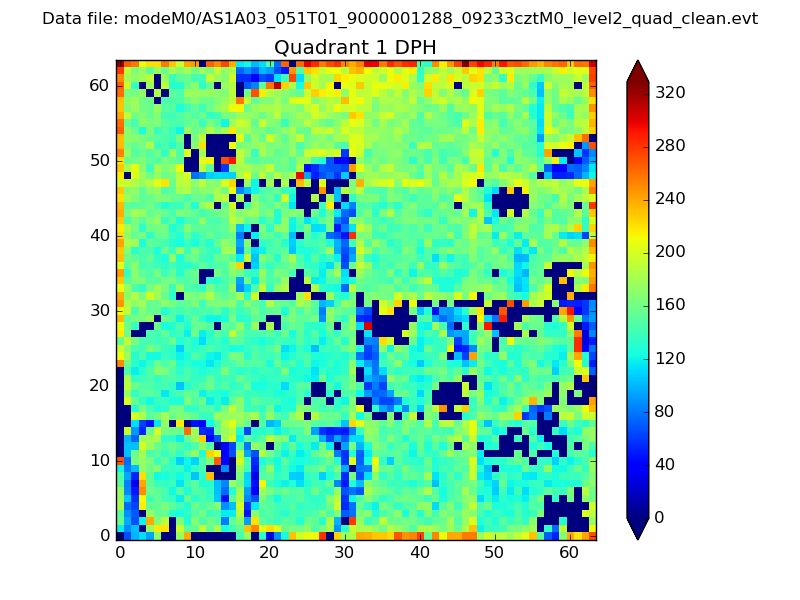 |
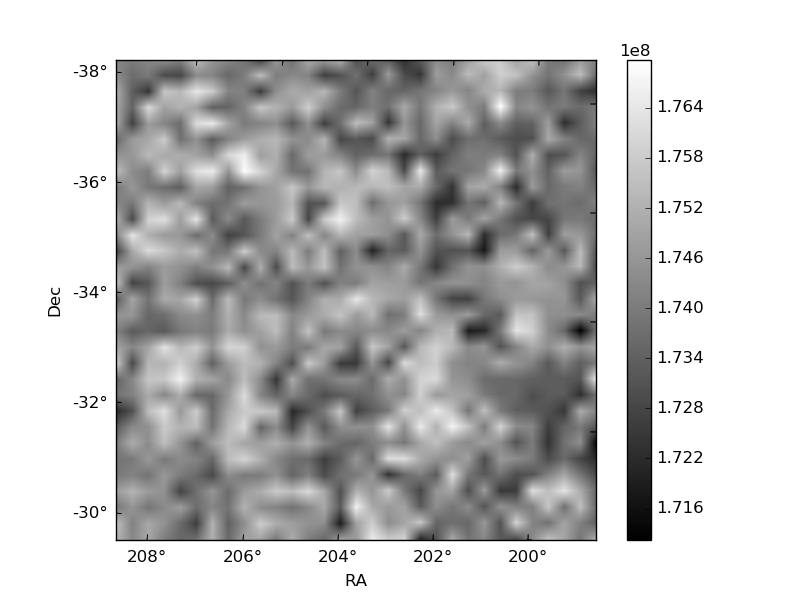
Quadrant B |
|---|---|---|---|
| Quadrant D | 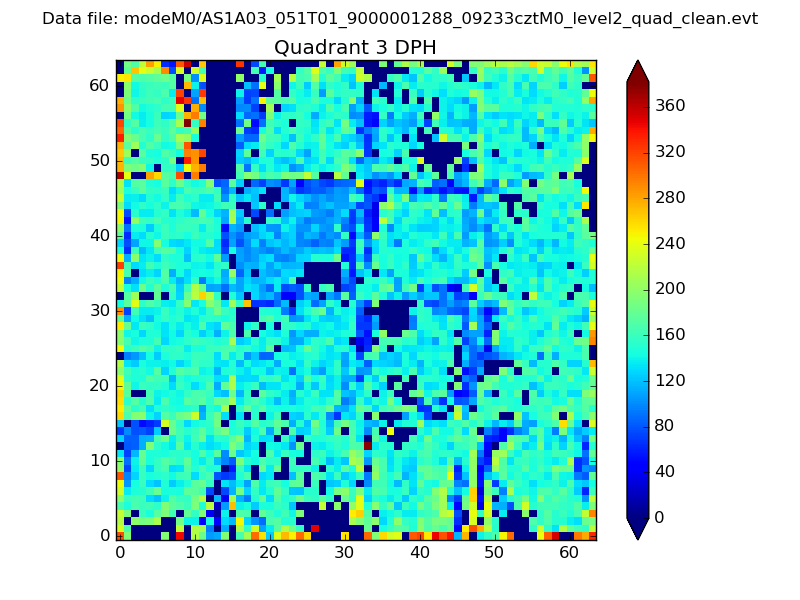 |
 |
Quadrant C |
| Plot type | Count rate plots | Images |
|---|---|---|
| Comparison with Poisson distribution Blue bars denote a histogram of data divided into 1 sec bins. Red curve is a Poisson curve with rate = median count rate of data. |
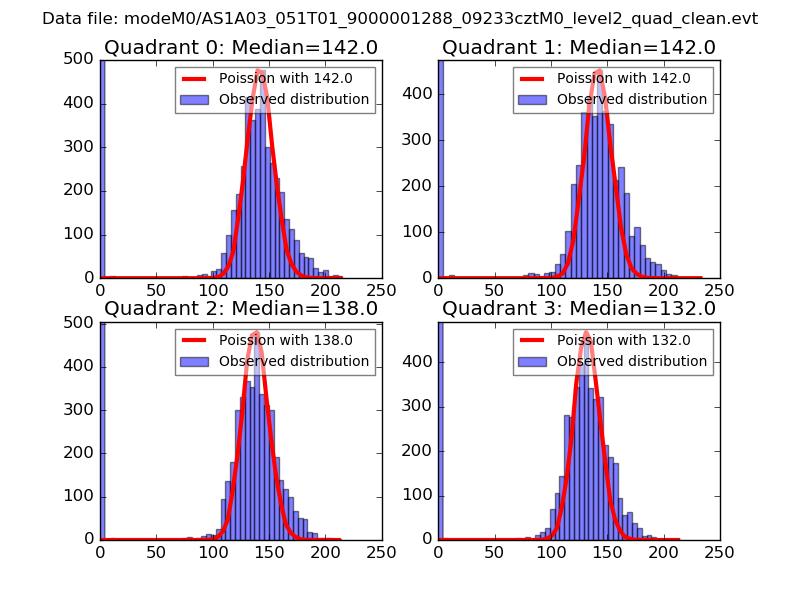 |
 |
| Quadrant-wise count rates Data is divided into 100 sec bins |
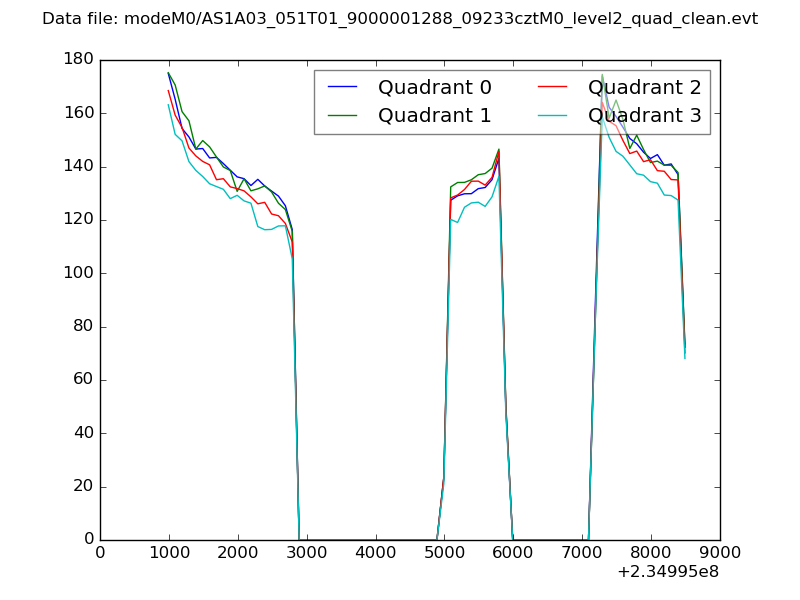 |
|
| Module-wise count rates for Quadrant A Data is divided into 100 sec bins |
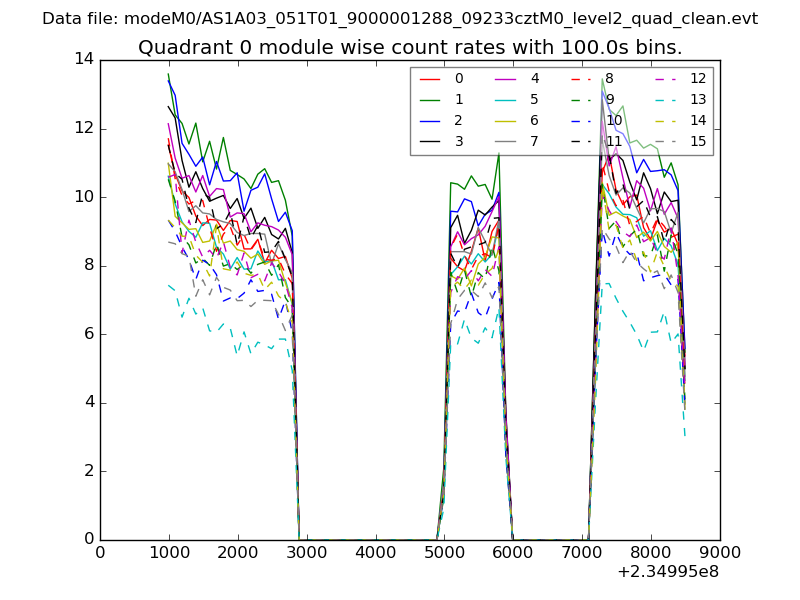 |
 |
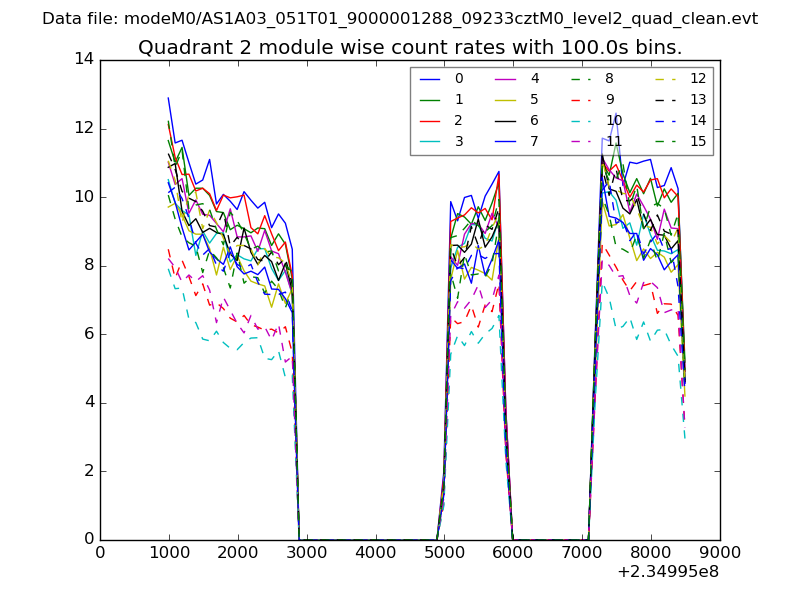
| Module-wise count rates for Quadrant B Data is divided into 100 sec bins |
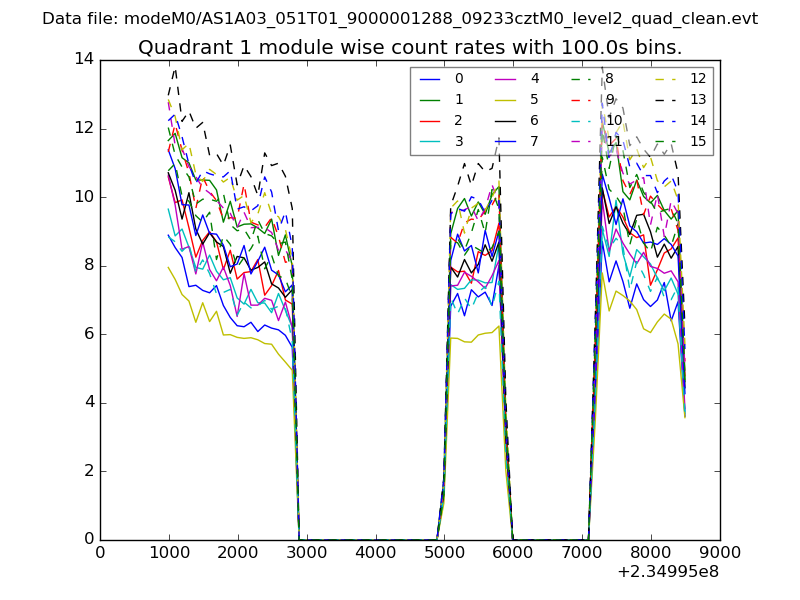 |
 |
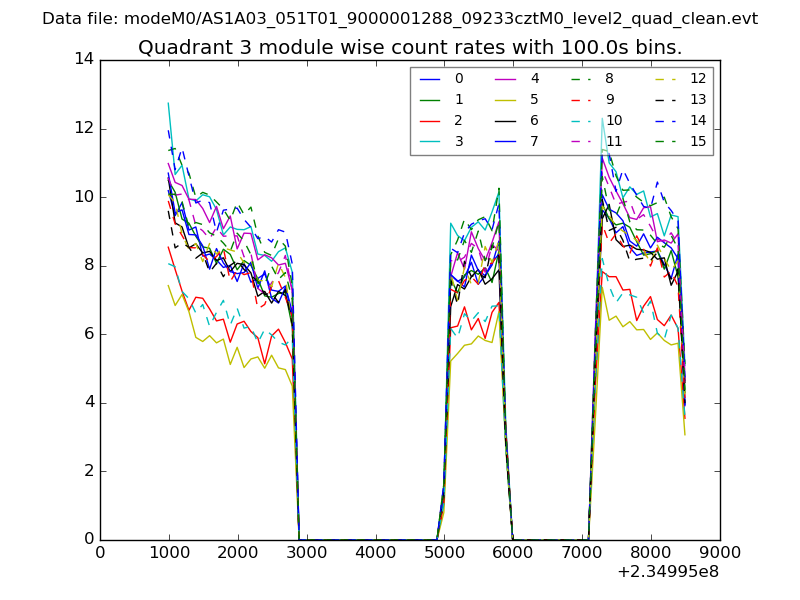
| Module-wise count rates for Quadrant C Data is divided into 100 sec bins |
 |
 |
| Module-wise count rates for Quadrant D Data is divided into 100 sec bins |
 |
 |
| Parameter | Plot |
|---|---|
| CZT HV Monitor | 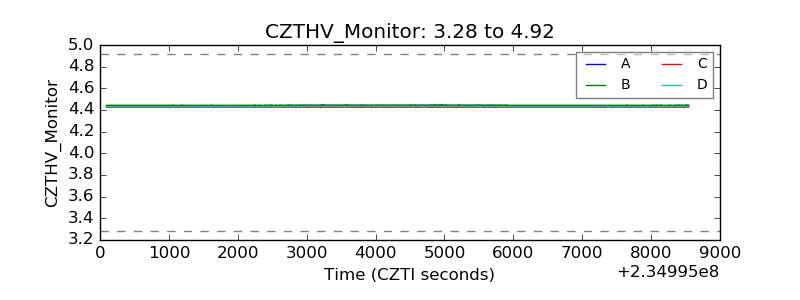 |
| D_VDD | 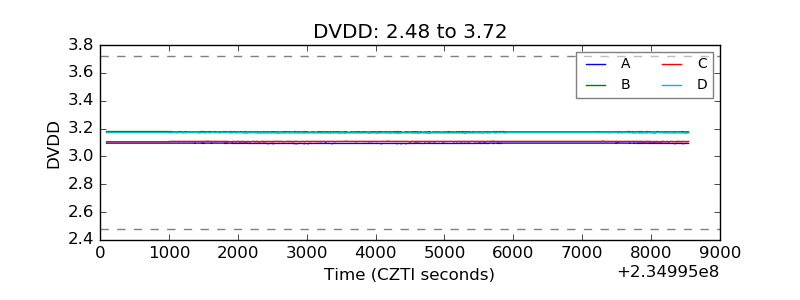 |
| Temperature 1 | 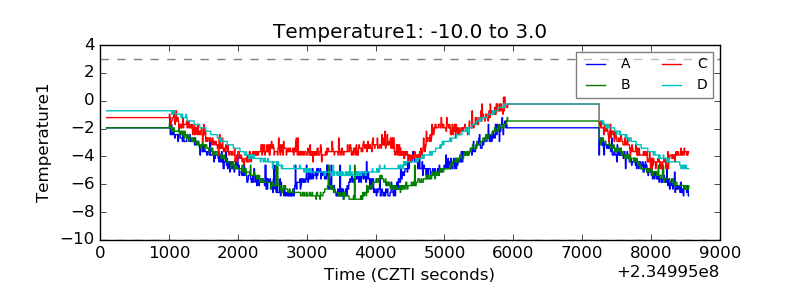 |
| Veto HV Monitor | 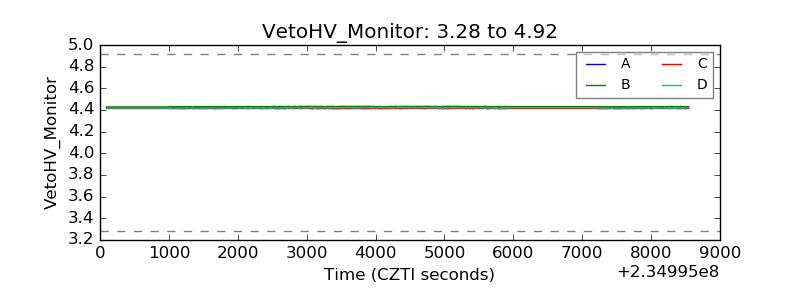 |
| Veto LLD | 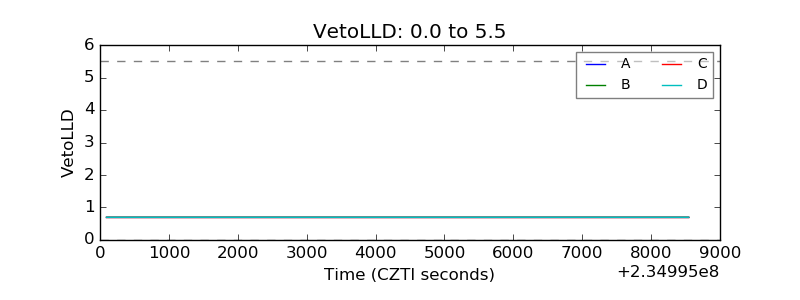 |
| Alpha Counter | 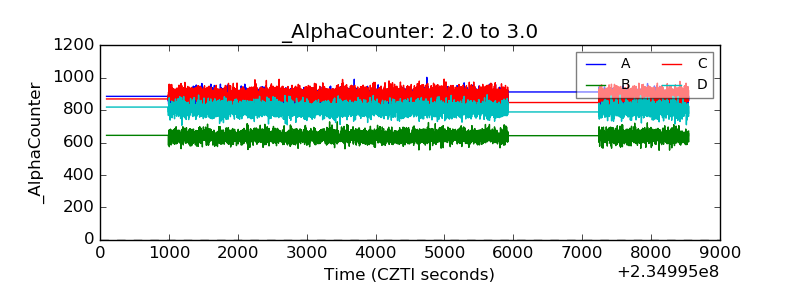 |
| _CPM_Rate | 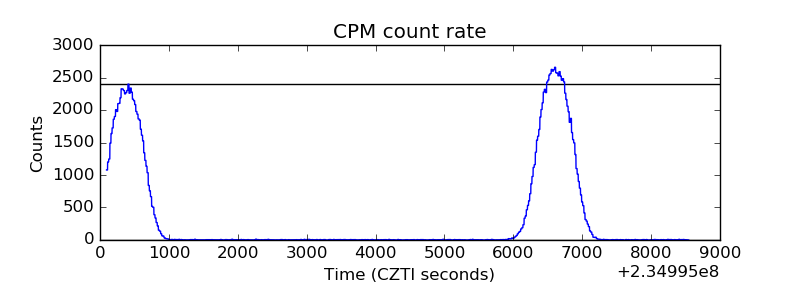 |
| CZT Counter | 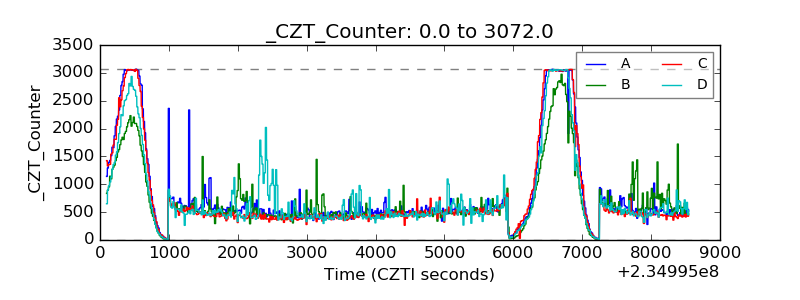 |
| +2.5 Volts monitor |  |
| +5 Volts monitor |  |
| _ROLL_ROT | 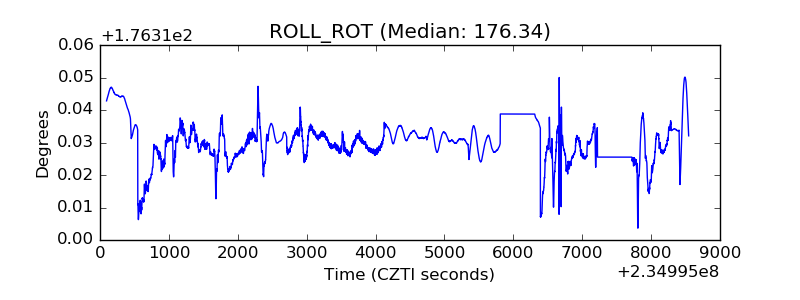 |
| _Roll_DEC | 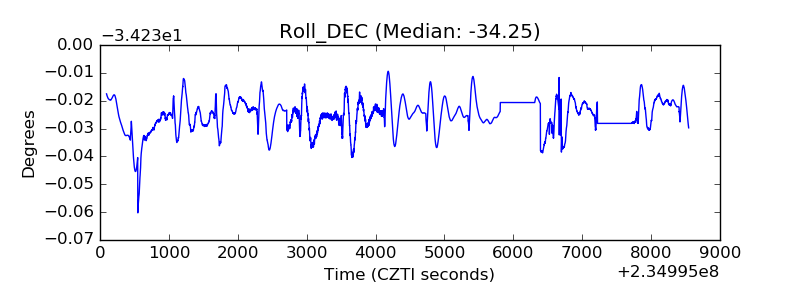 |
| _Roll_RA |  |
| Veto Counter | 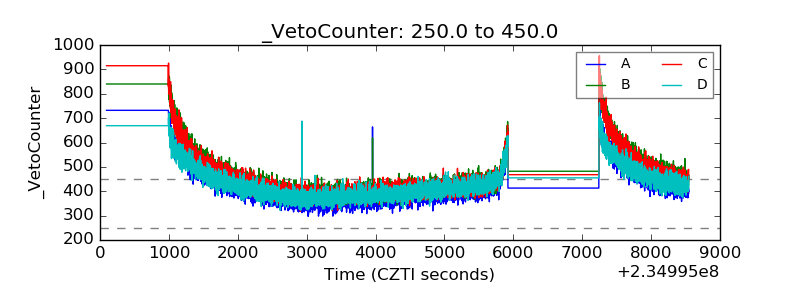 |