| Param | Original file | Final file |
|---|---|---|
| Filename | modeM0/AS1A03_051T01_9000001288_09234cztM0_level2.evt | modeM0/AS1A03_051T01_9000001288_09234cztM0_level2_quad_clean.evt |
| Size (bytes) | 433,183,680 | 80,910,720 |
| Size | 413.1 MB | 77.2 MB |
| Events in quadrant A | 3,482,810 | 510,749 |
| Events in quadrant B | 3,357,039 | 521,340 |
| Events in quadrant C | 2,822,620 | 515,489 |
| Events in quadrant D | 3,054,486 | 489,622 |
| Mode SS | |||
|---|---|---|---|
| Quadrant | BADHDUFLAG | Total packets | Discarded packets |
| A | 0 | 126 | 6 |
| B | 0 | 126 | 4 |
| C | 0 | 126 | 6 |
| D | 0 | 126 | 4 |
| Mode M0 | |||
|---|---|---|---|
| Quadrant | BADHDUFLAG | Total packets | Discarded packets |
| A | 0 | 14987 | 841 |
| B | 0 | 14636 | 913 |
| C | 0 | 12738 | 501 |
| D | 0 | 13664 | 690 |
| Mode M9 | |||
|---|---|---|---|
| Quadrant | BADHDUFLAG | Total packets | Discarded packets |
| A | 0 | 21 | 0 |
| B | 0 | 21 | 2 |
| C | 0 | 21 | 1 |
| D | 0 | 22 | 1 |
| Quadrant | Total seconds | Saturated seconds | Saturation percentage |
|---|---|---|---|
| A | 5877 | 115 | 1.956781% |
| B | 5871 | 69 | 1.175268% |
| C | 5958 | 11 | 0.184626% |
| D | 5903 | 29 | 0.491276% |
Noise dominated data is calculated using 1-second bins in cleaned event files. If a bin has >2000 counts, and if more than 50% of those come from <1% of pixels, then it is considered to be noise-dominated and hence unusable.
| Quadrant | # 1 sec bins | Bins with >0 counts | Bins with >2000 counts | High rate bins dominated by noise | Noise dominated (total time) | Noise dominated (detector-on time) | Marked lightcurve |
|---|---|---|---|---|---|---|---|
| A | 7545 | 6159 | 67 | 67 | 0.89% | 1.09% | 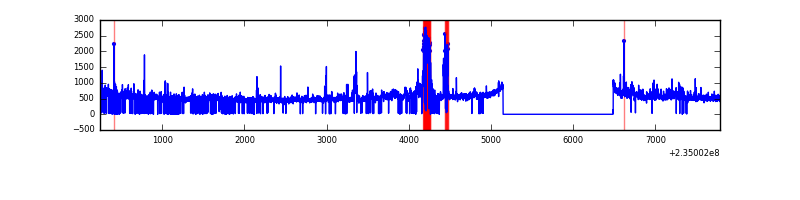 |
| B | 7544 | 6139 | 23 | 23 | 0.30% | 0.37% | 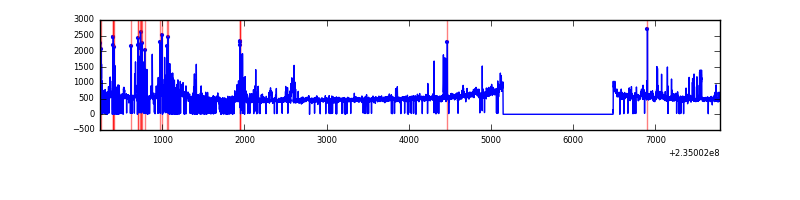 |
| C | 7545 | 6169 | 0 | 0 | 0.00% | 0.00% | 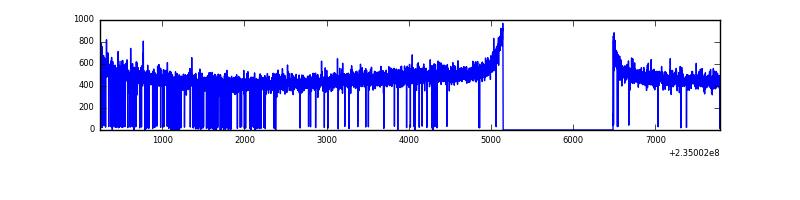 |
| D | 7545 | 6162 | 13 | 13 | 0.17% | 0.21% | 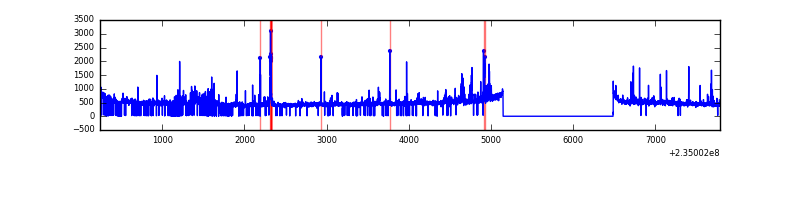 |
Top three noisy pixels from each quadrant. If the there are fewer than three noisy pixels in the level2.evt file, extra rows are filled as -1
| Pixel properties | Quadrant properties | ||||||
|---|---|---|---|---|---|---|---|
| Quadrant | DetID | PixID | Counts | Sigma | Mean | Median | Sigma |
| A | 15 | 174 | 272637 | 1822.43 | 733 | 720 | 149.2 |
| A | 8 | 5 | 221266 | 1478.13 | 733 | 720 | 149.2 |
| A | 1 | 162 | 92985 | 618.37 | 733 | 720 | 149.2 |
| B | 8 | 234 | 200532 | 1425.17 | 742 | 725 | 140.2 |
| B | 0 | 245 | 87855 | 621.48 | 742 | 725 | 140.2 |
| B | 0 | 246 | 42884 | 300.71 | 742 | 725 | 140.2 |
| C | 13 | 61 | 5603 | 29.24 | 721 | 726 | 166.8 |
| C | 14 | 67 | 5533 | 28.82 | 721 | 726 | 166.8 |
| C | 8 | 222 | 3590 | 17.17 | 721 | 726 | 166.8 |
| D | 2 | 14 | 78947 | 415.34 | 701 | 686 | 188.4 |
| D | 11 | 129 | 77738 | 408.92 | 701 | 686 | 188.4 |
| D | 7 | 71 | 62869 | 330.01 | 701 | 686 | 188.4 |
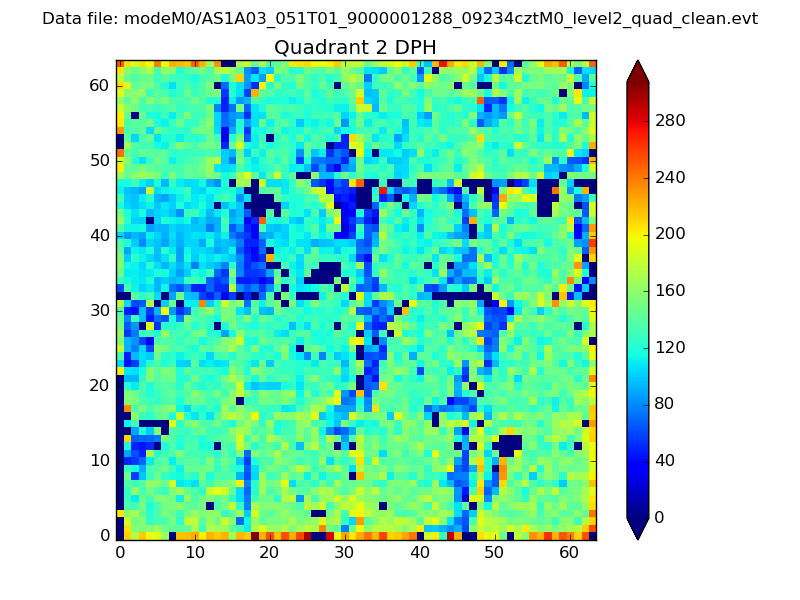
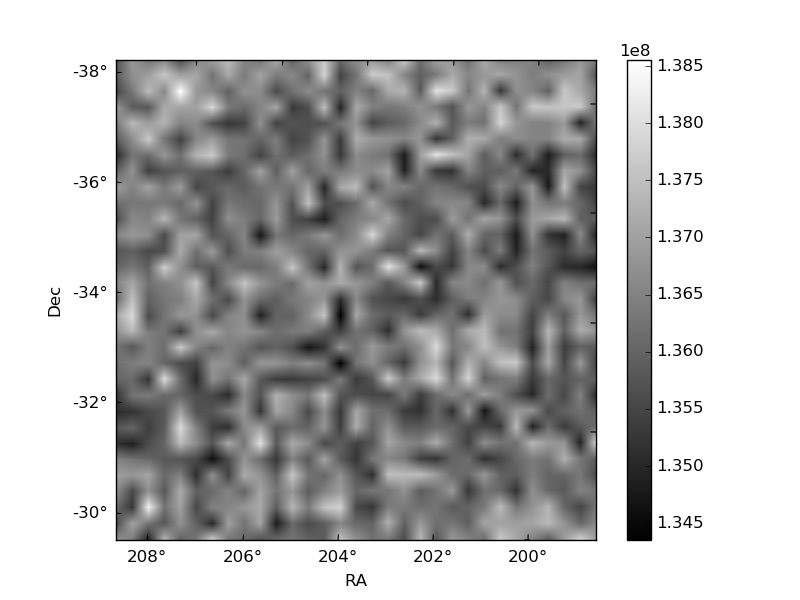
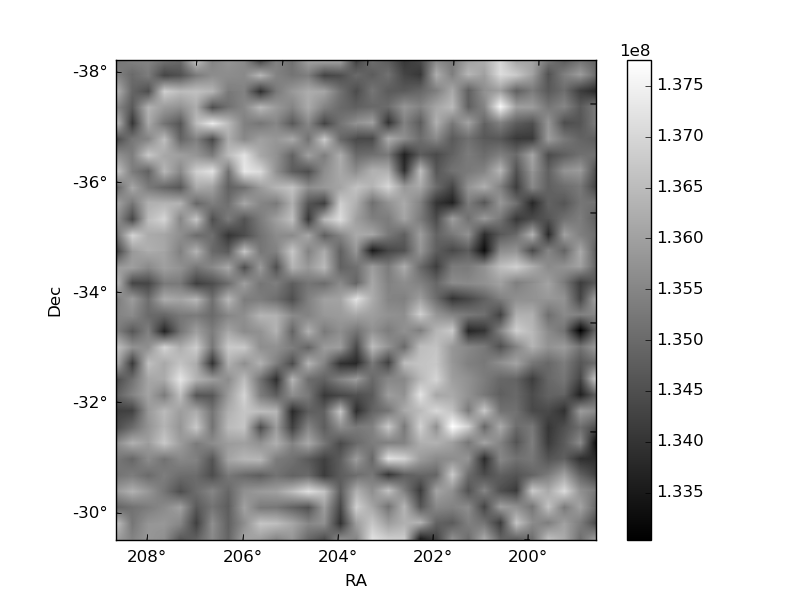
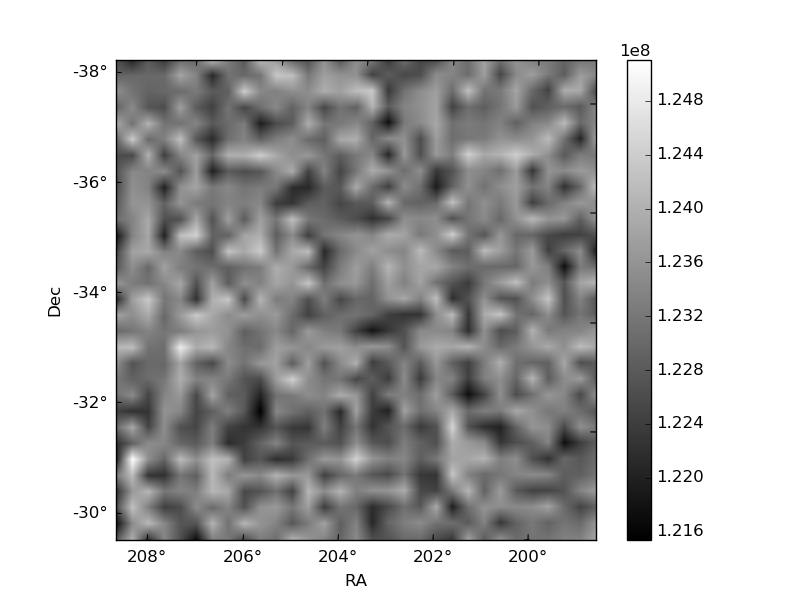
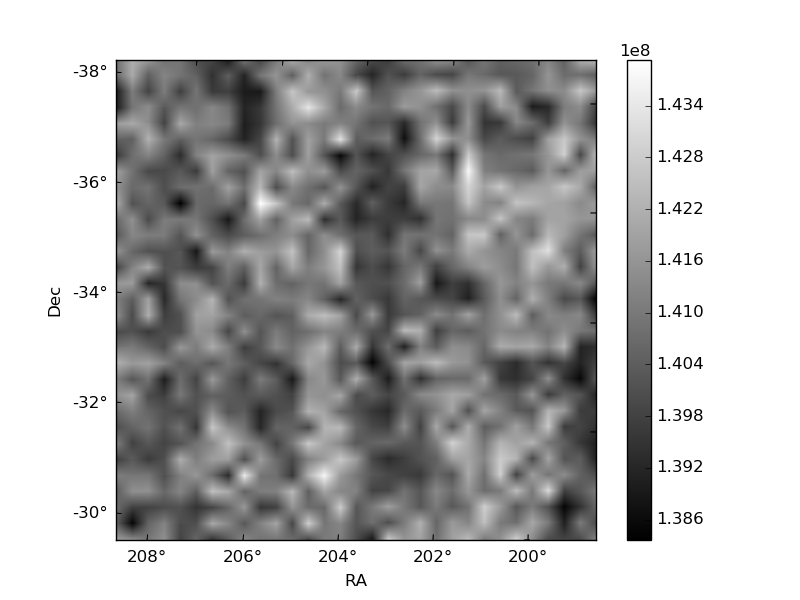
Histogram calculated using DETX and DETY for each event in the final _common_clean file
| Quadrant A | 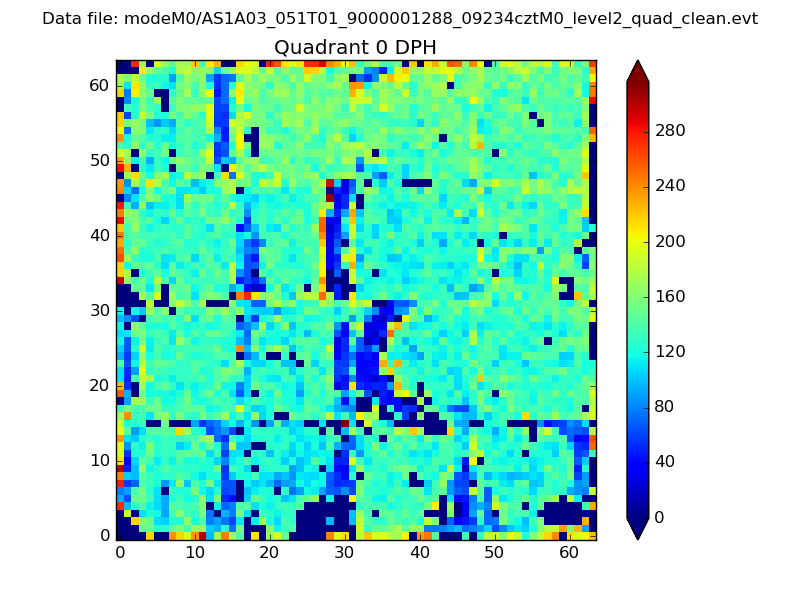 |
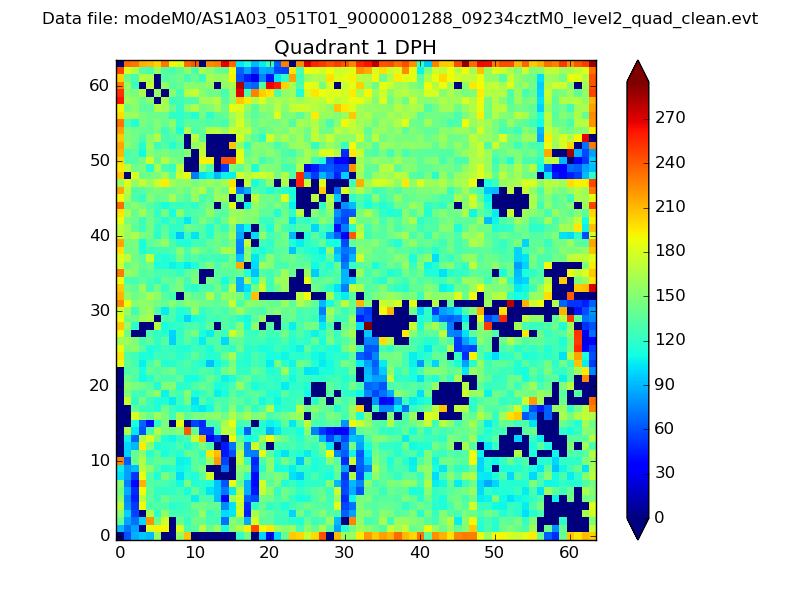 |
Quadrant B |
|---|---|---|---|
| Quadrant D | 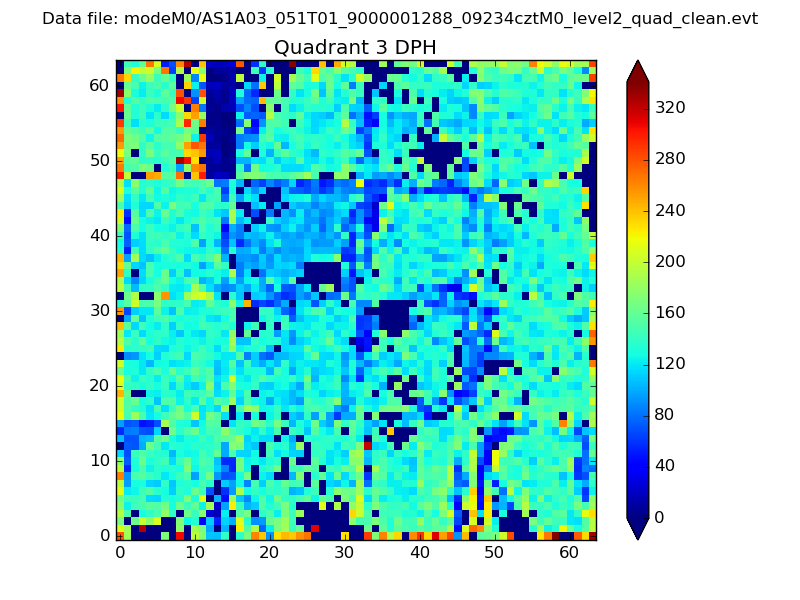 |
 |
Quadrant C |
| Plot type | Count rate plots | Images |
|---|---|---|
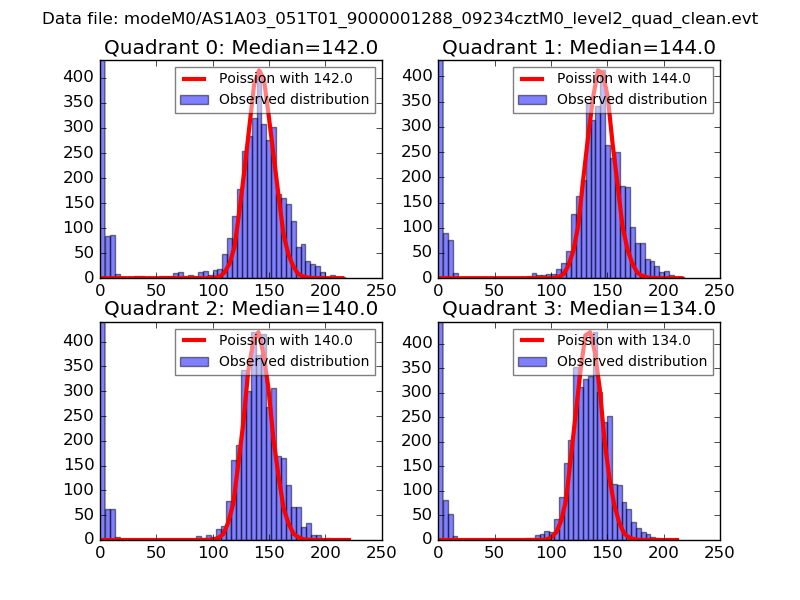
| Comparison with Poisson distribution Blue bars denote a histogram of data divided into 1 sec bins. Red curve is a Poisson curve with rate = median count rate of data. |
 |
 |
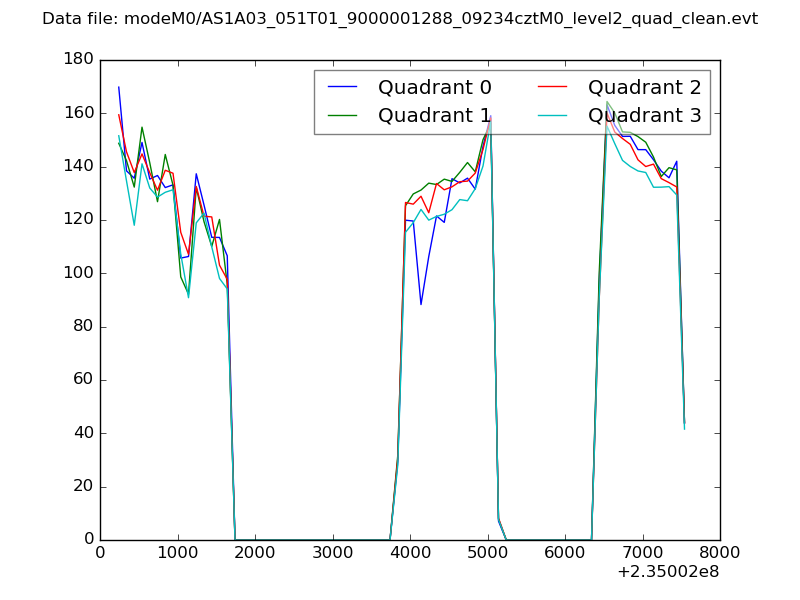
| Quadrant-wise count rates Data is divided into 100 sec bins |
 |
|
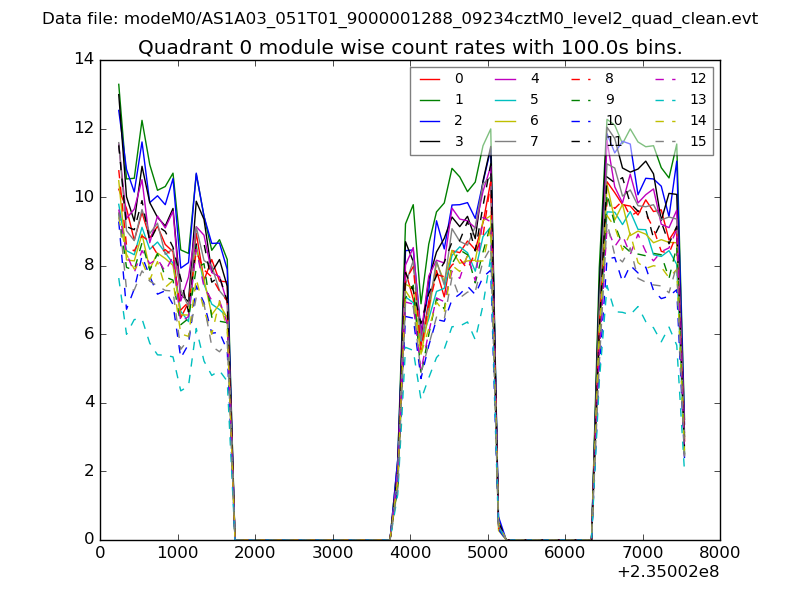
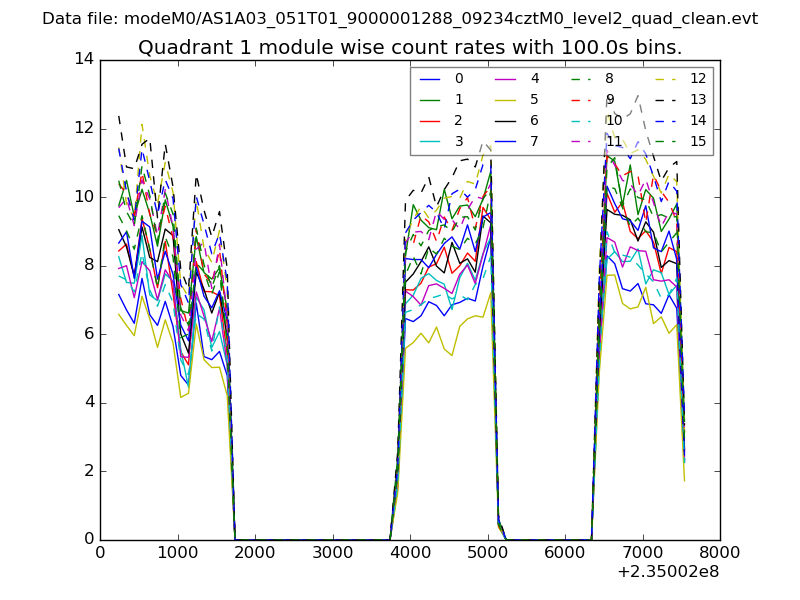
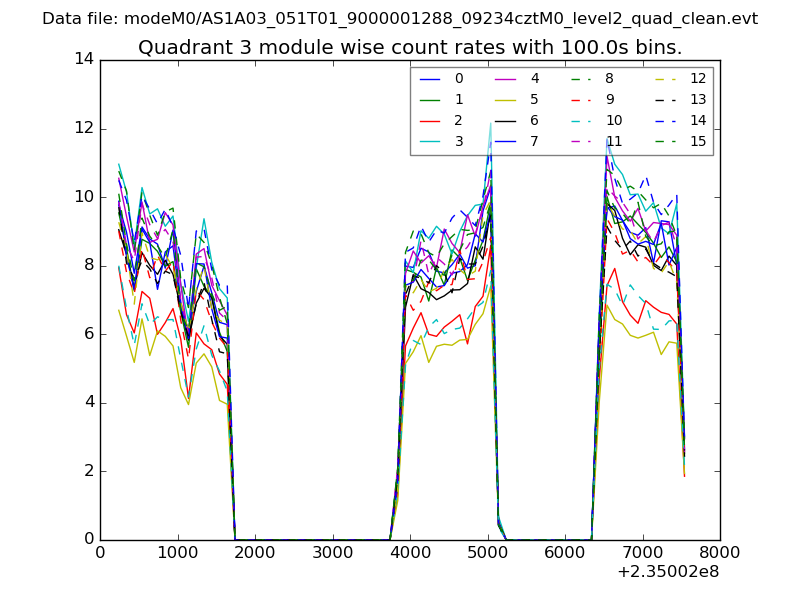
| Module-wise count rates for Quadrant A Data is divided into 100 sec bins |
 |
 |
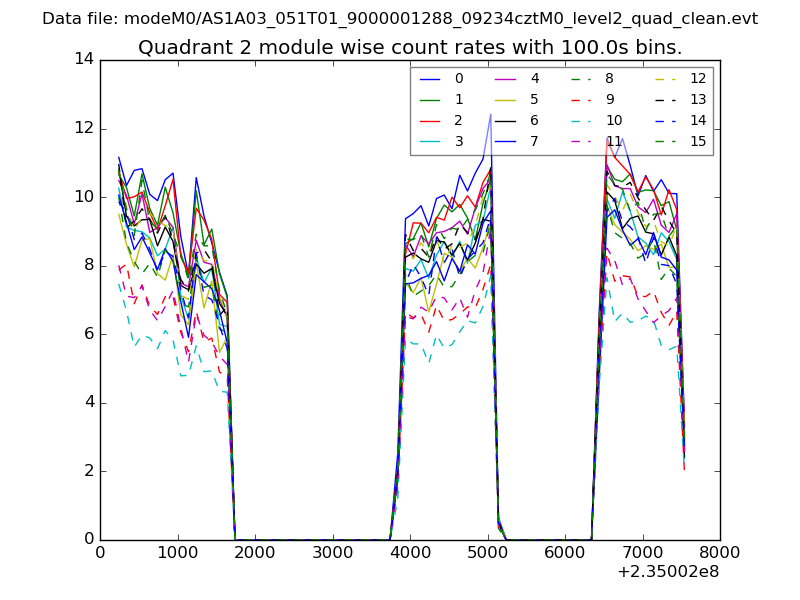
| Module-wise count rates for Quadrant B Data is divided into 100 sec bins |
 |
 |
| Module-wise count rates for Quadrant C Data is divided into 100 sec bins |
 |
 |
| Module-wise count rates for Quadrant D Data is divided into 100 sec bins |
 |
 |
| Parameter | Plot |
|---|---|
| CZT HV Monitor | 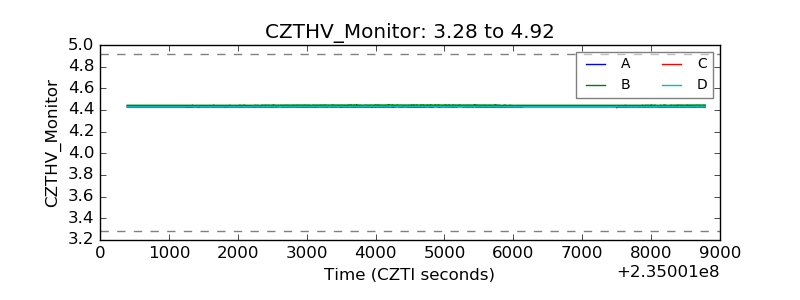 |
| D_VDD | 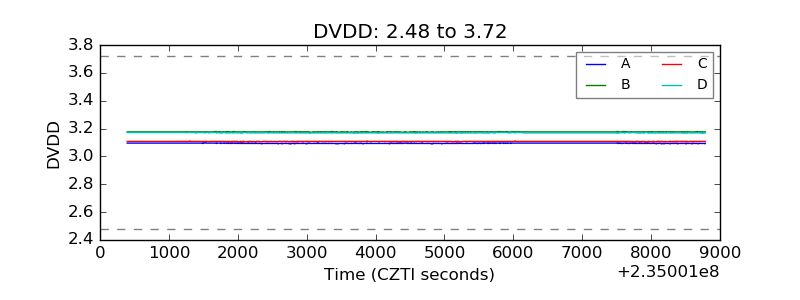 |
| Temperature 1 | 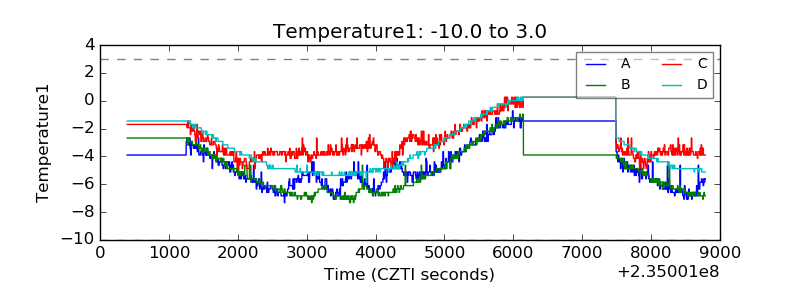 |
| Veto HV Monitor |  |
| Veto LLD | 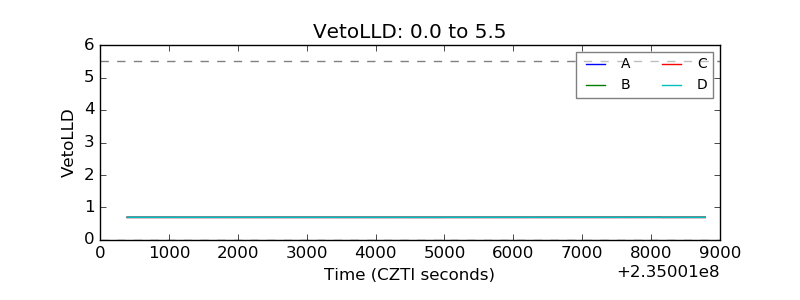 |
| Alpha Counter | 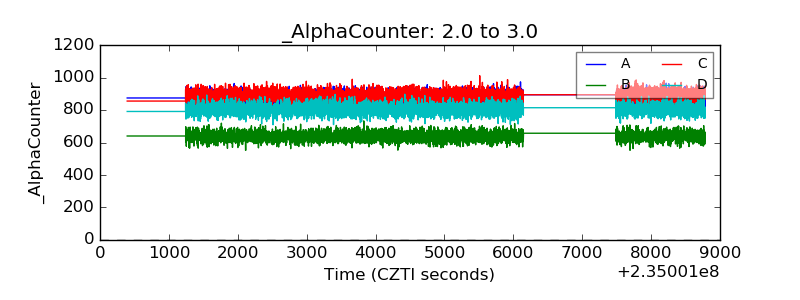 |
| _CPM_Rate | 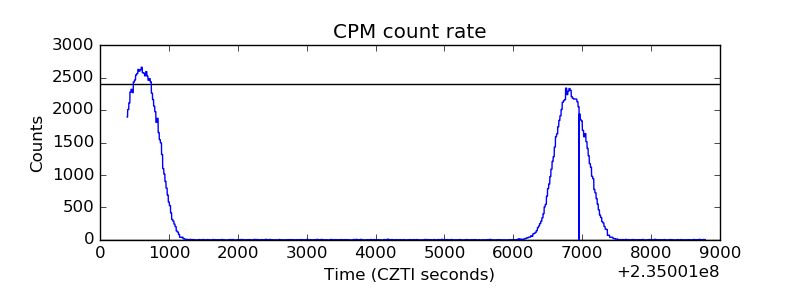 |
| CZT Counter | 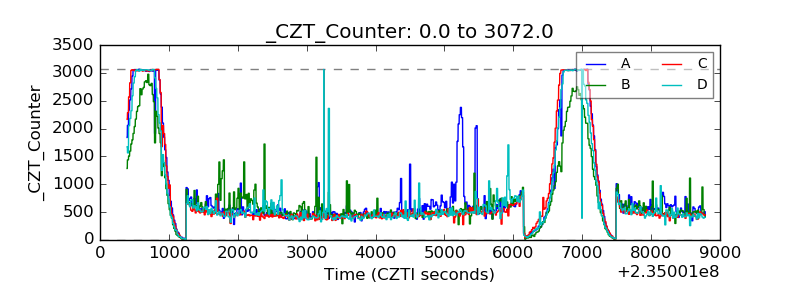 |
| +2.5 Volts monitor |  |
| +5 Volts monitor | 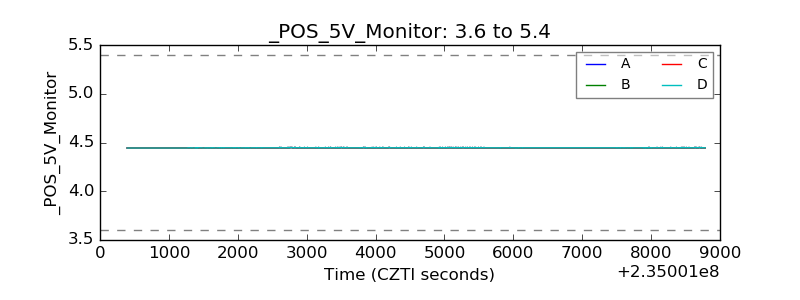 |
| _ROLL_ROT | 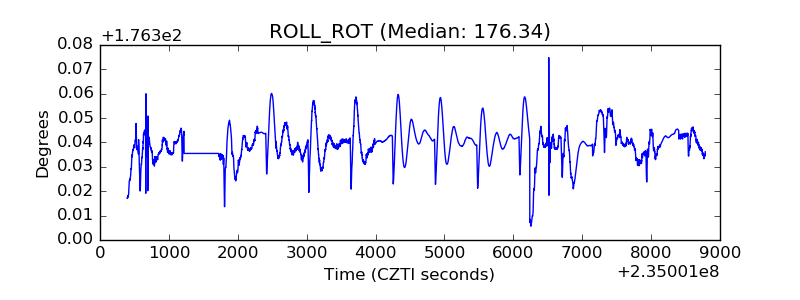 |
| _Roll_DEC |  |
| _Roll_RA | 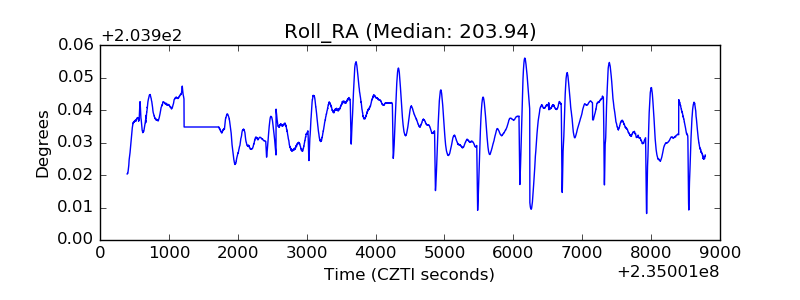 |
| Veto Counter | 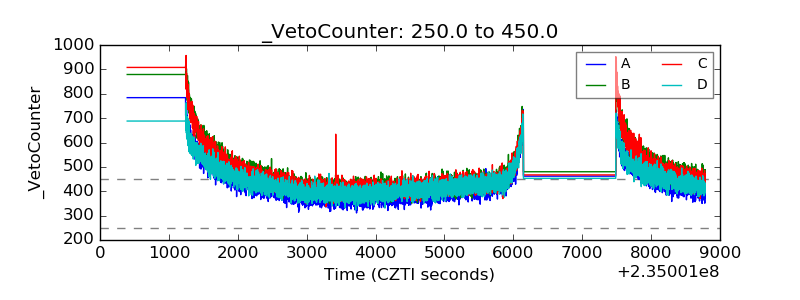 |