| Param | Original file | Final file |
|---|---|---|
| Filename | modeM0/AS1A03_051T01_9000001288_09235cztM0_level2.evt | modeM0/AS1A03_051T01_9000001288_09235cztM0_level2_quad_clean.evt |
| Size (bytes) | 407,010,240 | 69,235,200 |
| Size | 388.2 MB | 66.0 MB |
| Events in quadrant A | 3,110,483 | 429,753 |
| Events in quadrant B | 3,496,891 | 444,414 |
| Events in quadrant C | 2,571,215 | 433,079 |
| Events in quadrant D | 2,777,105 | 408,160 |
| Mode SS | |||
|---|---|---|---|
| Quadrant | BADHDUFLAG | Total packets | Discarded packets |
| A | 0 | 126 | 16 |
| B | 0 | 126 | 12 |
| C | 0 | 126 | 16 |
| D | 0 | 126 | 22 |
| Mode M0 | |||
|---|---|---|---|
| Quadrant | BADHDUFLAG | Total packets | Discarded packets |
| A | 0 | 14334 | 1740 |
| B | 0 | 15691 | 1903 |
| C | 0 | 12588 | 1400 |
| D | 0 | 13501 | 1582 |
| Mode M9 | |||
|---|---|---|---|
| Quadrant | BADHDUFLAG | Total packets | Discarded packets |
| A | 0 | 20 | 1 |
| B | 0 | 20 | 0 |
| C | 0 | 20 | 0 |
| D | 0 | 21 | 1 |
| Quadrant | Total seconds | Saturated seconds | Saturation percentage |
|---|---|---|---|
| A | 5443 | 46 | 0.845122% |
| B | 5417 | 246 | 4.541259% |
| C | 5462 | 8 | 0.146466% |
| D | 5445 | 23 | 0.422406% |
Noise dominated data is calculated using 1-second bins in cleaned event files. If a bin has >2000 counts, and if more than 50% of those come from <1% of pixels, then it is considered to be noise-dominated and hence unusable.
| Quadrant | # 1 sec bins | Bins with >0 counts | Bins with >2000 counts | High rate bins dominated by noise | Noise dominated (total time) | Noise dominated (detector-on time) | Marked lightcurve |
|---|---|---|---|---|---|---|---|
| A | 7504 | 5863 | 15 | 15 | 0.20% | 0.26% | 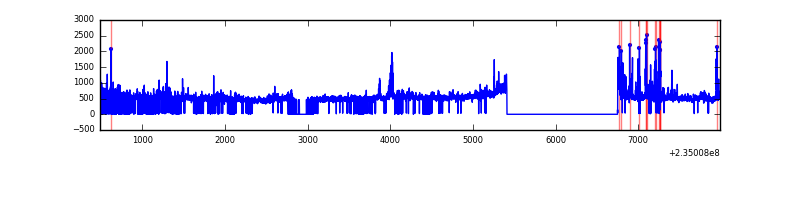 |
| B | 7504 | 5844 | 209 | 209 | 2.79% | 3.58% |  |
| C | 7503 | 5848 | 0 | 0 | 0.00% | 0.00% |  |
| D | 7504 | 5871 | 10 | 10 | 0.13% | 0.17% | 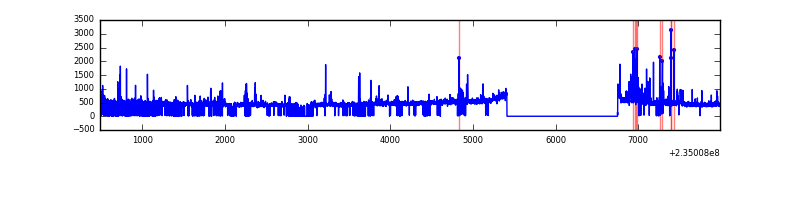 |
Top three noisy pixels from each quadrant. If the there are fewer than three noisy pixels in the level2.evt file, extra rows are filled as -1
| Pixel properties | Quadrant properties | ||||||
|---|---|---|---|---|---|---|---|
| Quadrant | DetID | PixID | Counts | Sigma | Mean | Median | Sigma |
| A | 8 | 5 | 335123 | 2418.53 | 677 | 663 | 138.3 |
| A | 13 | 251 | 82935 | 594.92 | 677 | 663 | 138.3 |
| A | 1 | 162 | 46780 | 333.48 | 677 | 663 | 138.3 |
| B | 6 | 51 | 697694 | 5505.38 | 669 | 655 | 126.6 |
| B | 8 | 234 | 60493 | 472.61 | 669 | 655 | 126.6 |
| B | 0 | 245 | 51738 | 403.47 | 669 | 655 | 126.6 |
| C | 13 | 61 | 5071 | 29.0 | 658 | 661 | 152.1 |
| C | 14 | 67 | 3586 | 19.23 | 658 | 661 | 152.1 |
| C | 8 | 222 | 2776 | 13.91 | 658 | 661 | 152.1 |
| D | 1 | 52 | 87304 | 542.08 | 650 | 630 | 159.9 |
| D | 7 | 71 | 68863 | 426.74 | 650 | 630 | 159.9 |
| D | 2 | 152 | 45203 | 278.77 | 650 | 630 | 159.9 |
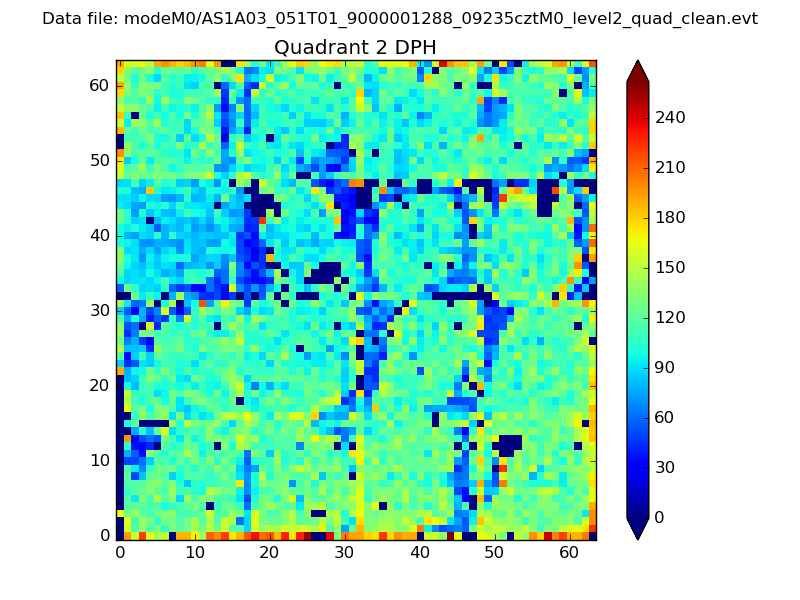
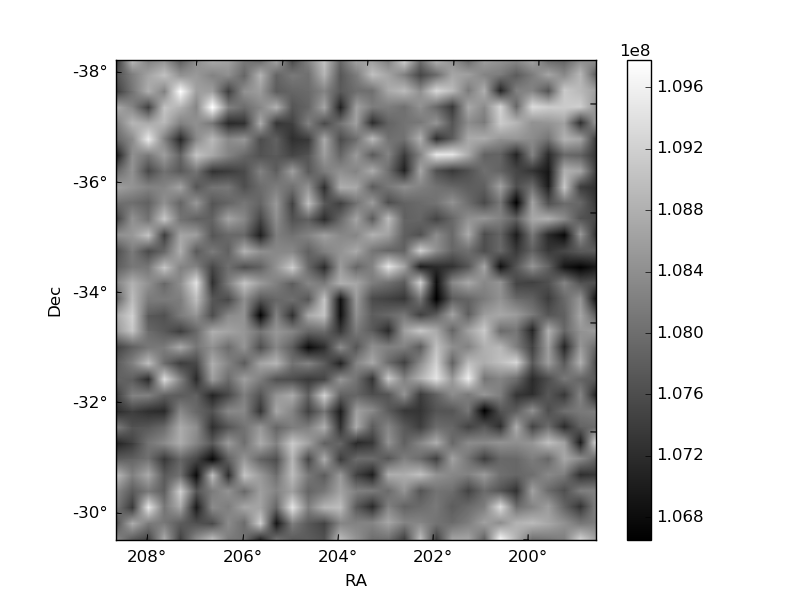
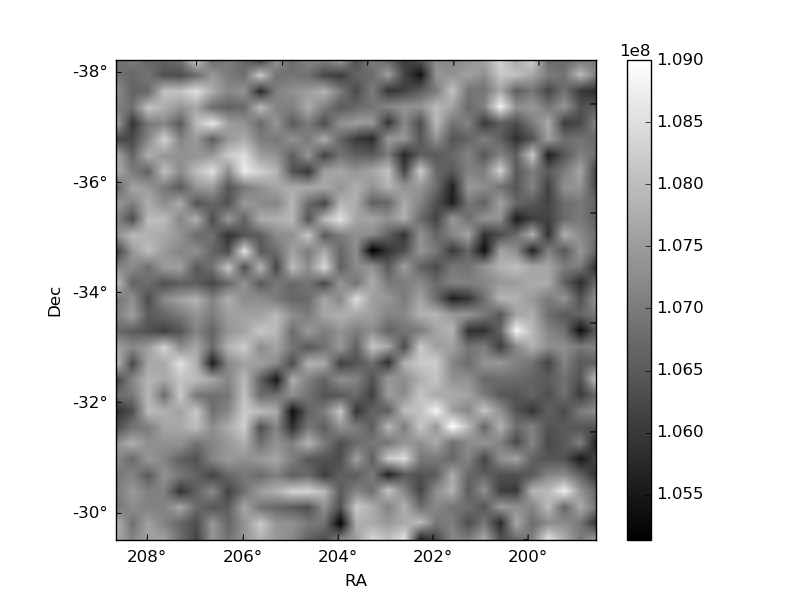
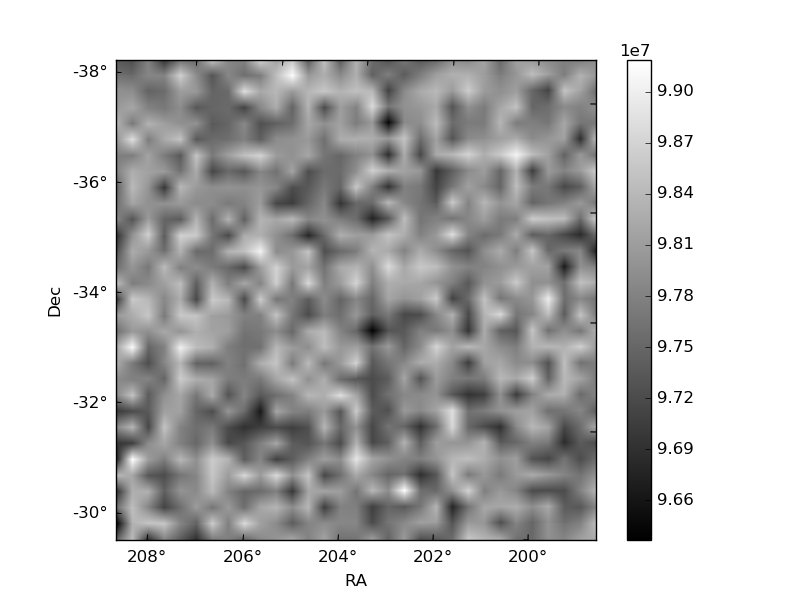
Histogram calculated using DETX and DETY for each event in the final _common_clean file
| Quadrant A | 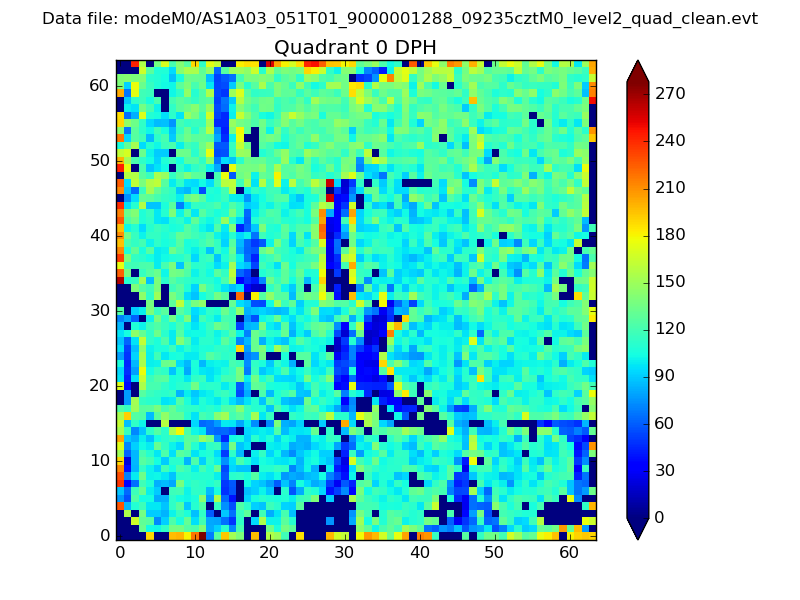 |
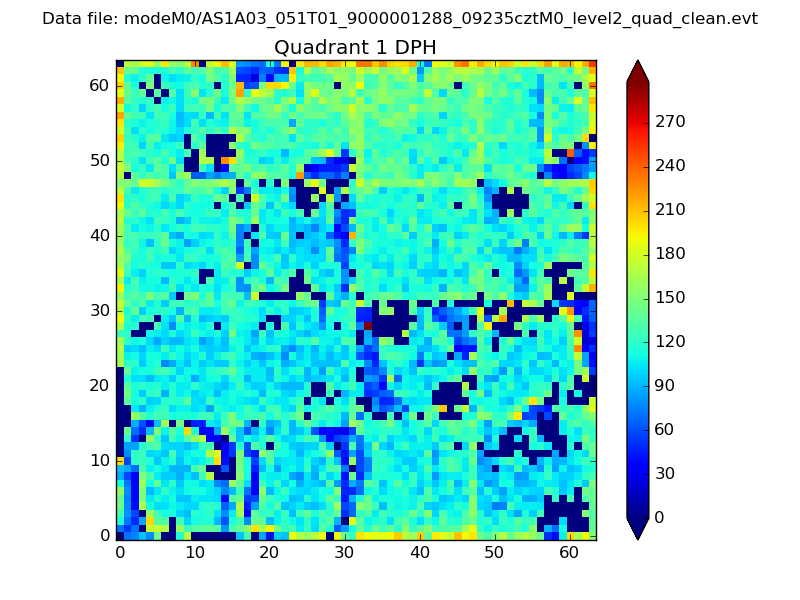 |
Quadrant B |
|---|---|---|---|
| Quadrant D | 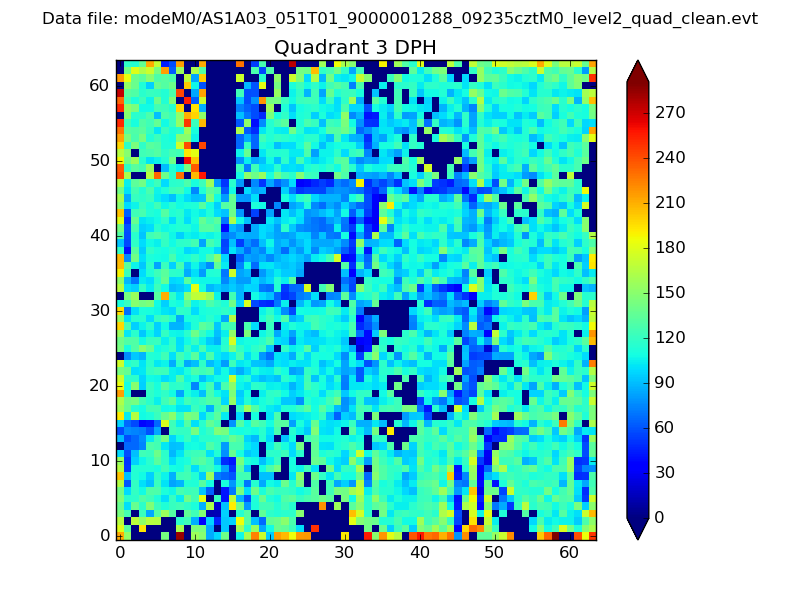 |
 |
Quadrant C |
| Plot type | Count rate plots | Images |
|---|---|---|
| Comparison with Poisson distribution Blue bars denote a histogram of data divided into 1 sec bins. Red curve is a Poisson curve with rate = median count rate of data. |
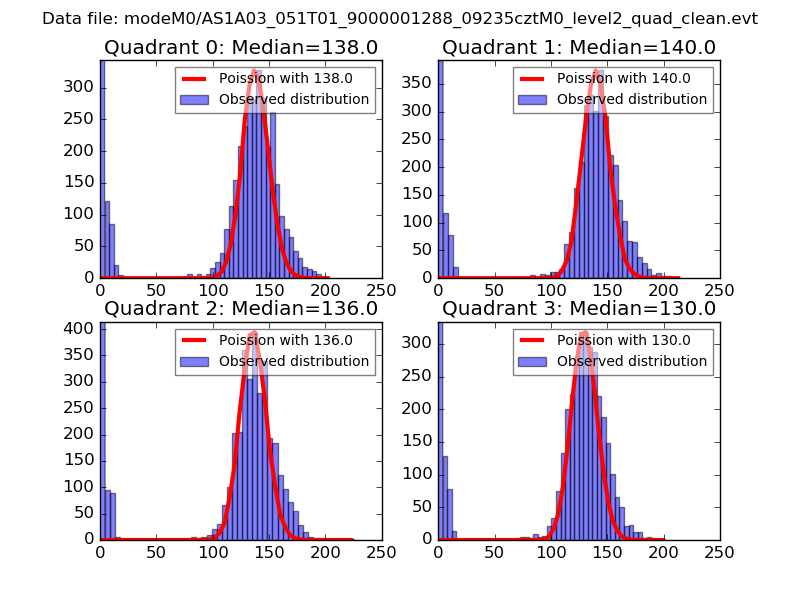 |
 |
| Quadrant-wise count rates Data is divided into 100 sec bins |
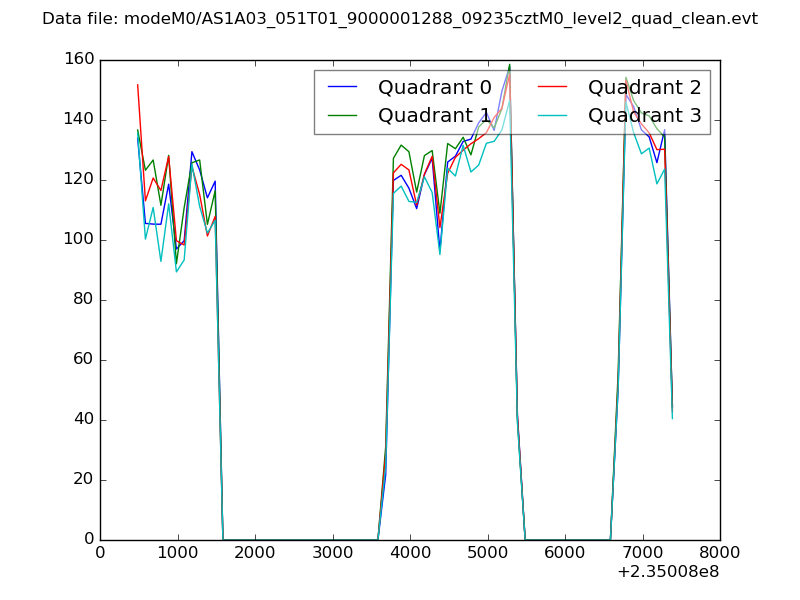 |
|
| Module-wise count rates for Quadrant A Data is divided into 100 sec bins |
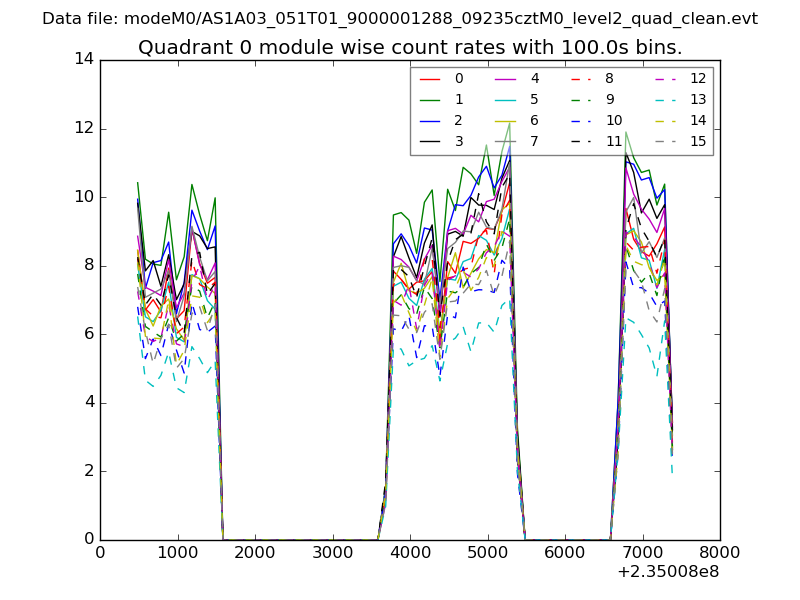 |
 |
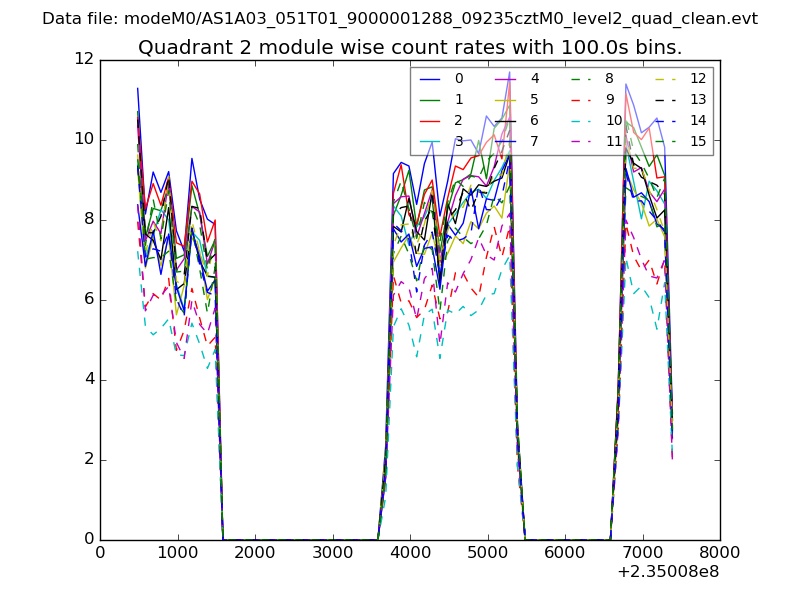
| Module-wise count rates for Quadrant B Data is divided into 100 sec bins |
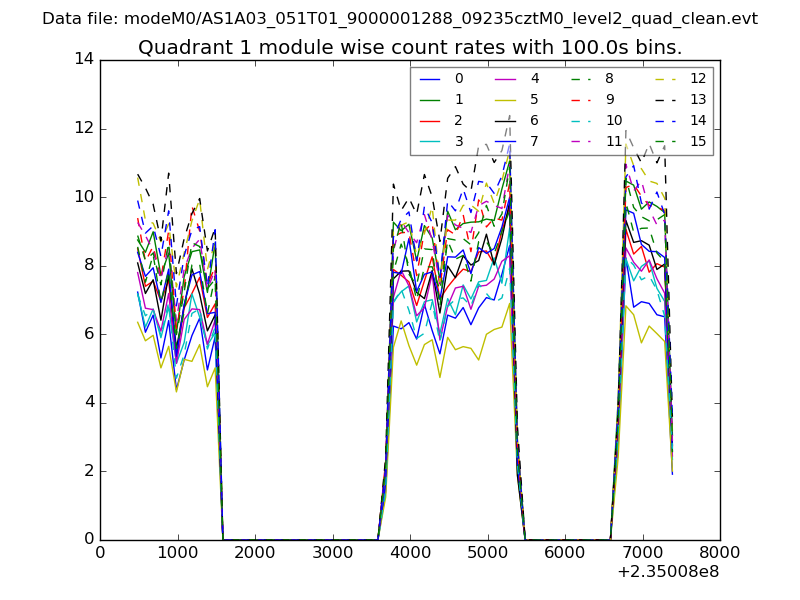 |
 |
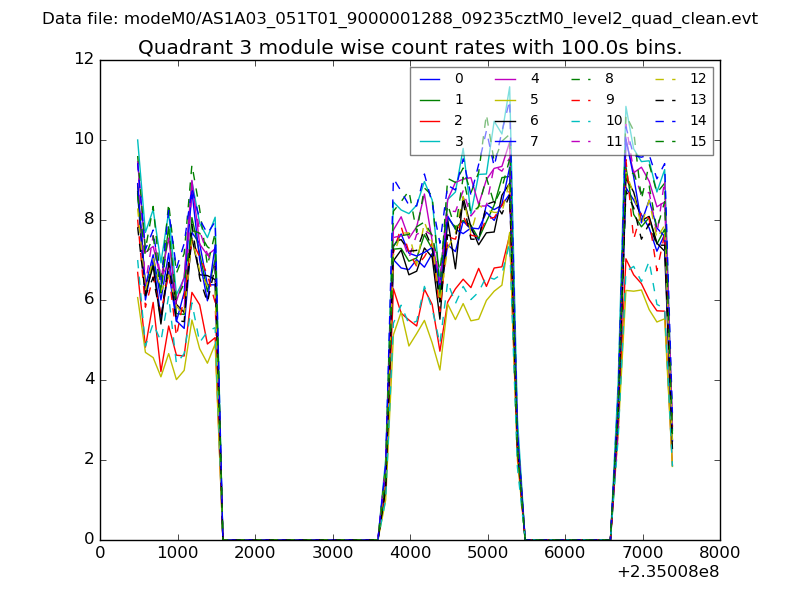
| Module-wise count rates for Quadrant C Data is divided into 100 sec bins |
 |
 |
| Module-wise count rates for Quadrant D Data is divided into 100 sec bins |
 |
 |
| Parameter | Plot |
|---|---|
| CZT HV Monitor | 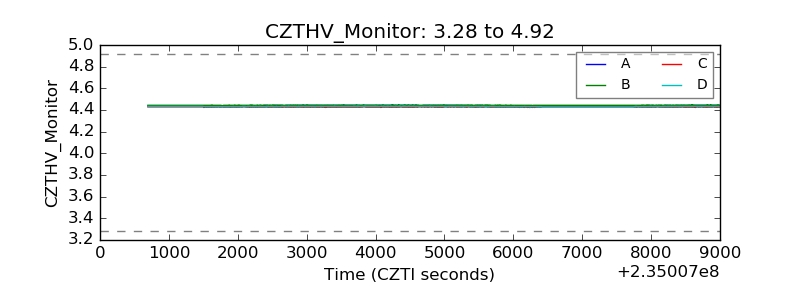 |
| D_VDD | 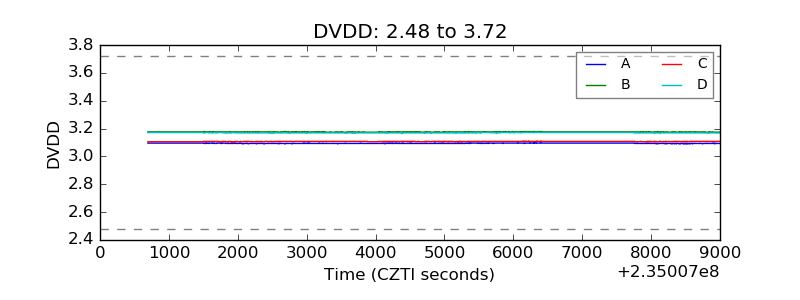 |
| Temperature 1 | 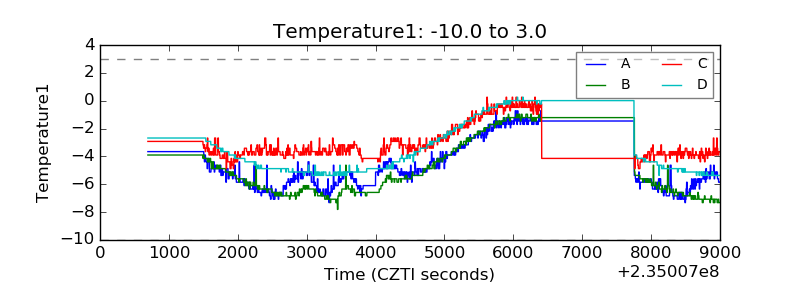 |
| Veto HV Monitor | 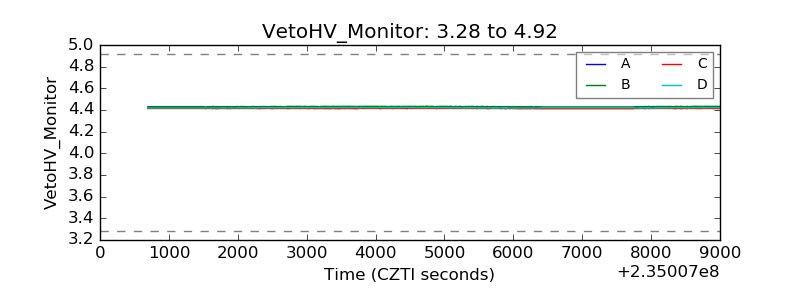 |
| Veto LLD | 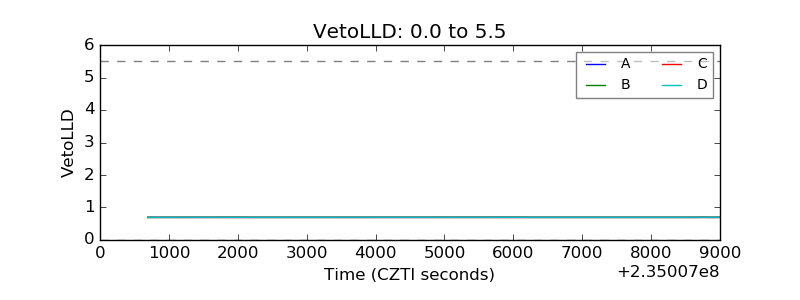 |
| Alpha Counter | 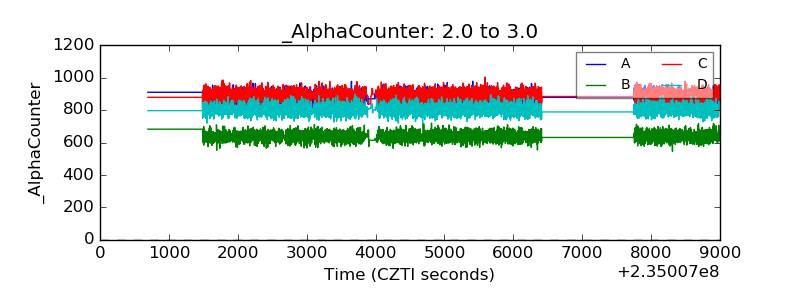 |
| _CPM_Rate | 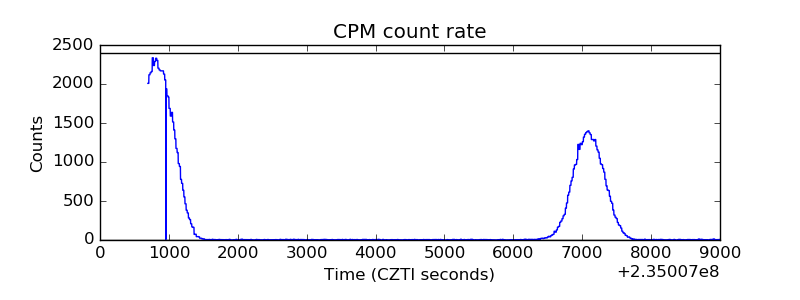 |
| CZT Counter | 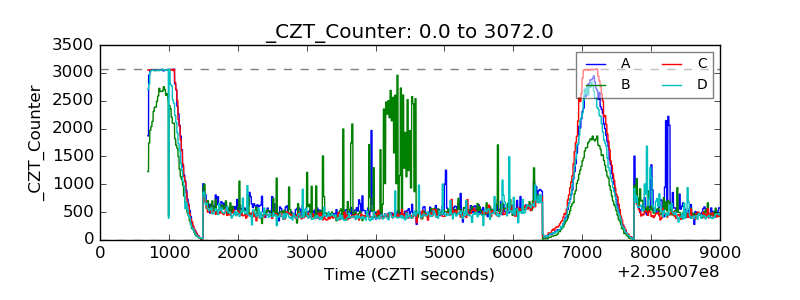 |
| +2.5 Volts monitor |  |
| +5 Volts monitor |  |
| _ROLL_ROT | 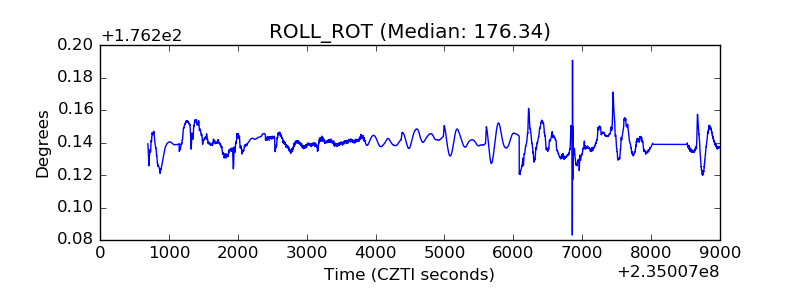 |
| _Roll_DEC | 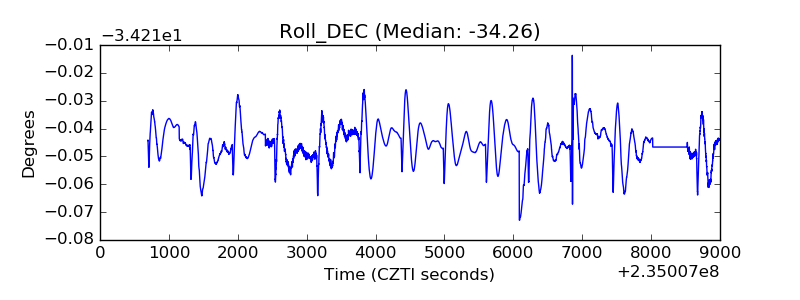 |
| _Roll_RA | 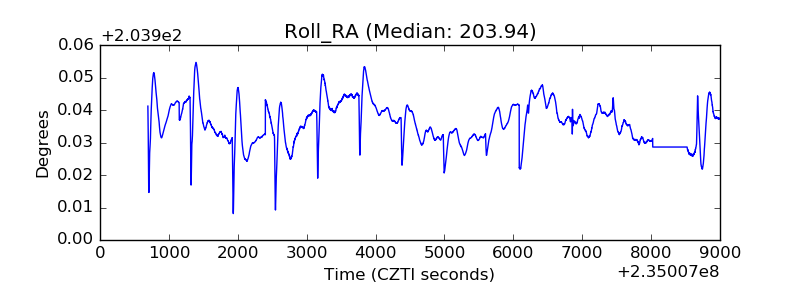 |
| Veto Counter | 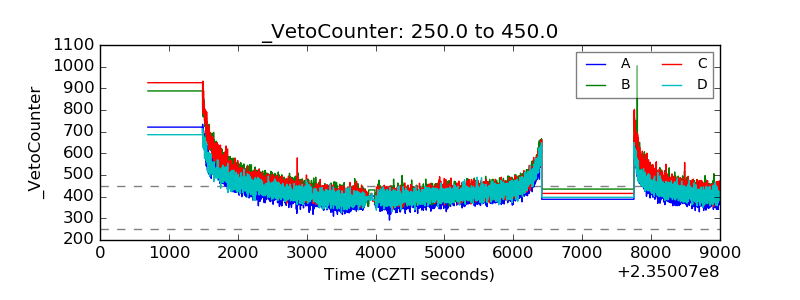 |