| Param | Original file | Final file |
|---|---|---|
| Filename | modeM0/AS1A03_051T01_9000001288_09236cztM0_level2.evt | modeM0/AS1A03_051T01_9000001288_09236cztM0_level2_quad_clean.evt |
| Size (bytes) | 1,153,820,160 | 181,912,320 |
| Size | 1.1 GB | 173.5 MB |
| Events in quadrant A | 9,345,740 | 1,107,822 |
| Events in quadrant B | 9,113,141 | 1,137,319 |
| Events in quadrant C | 7,395,256 | 1,105,771 |
| Events in quadrant D | 8,014,208 | 1,061,011 |
| Mode SS | |||
|---|---|---|---|
| Quadrant | BADHDUFLAG | Total packets | Discarded packets |
| A | 0 | 324 | 0 |
| B | 0 | 324 | 0 |
| C | 0 | 324 | 0 |
| D | 0 | 324 | 0 |
| Mode M0 | |||
|---|---|---|---|
| Quadrant | BADHDUFLAG | Total packets | Discarded packets |
| A | 0 | 37816 | 4 |
| B | 0 | 37151 | 3 |
| C | 0 | 32485 | 3 |
| D | 0 | 34634 | 3 |
| Mode M9 | |||
|---|---|---|---|
| Quadrant | BADHDUFLAG | Total packets | Discarded packets |
| A | 0 | 38 | 0 |
| B | 0 | 38 | 0 |
| C | 0 | 38 | 0 |
| D | 0 | 38 | 0 |
| Quadrant | Total seconds | Saturated seconds | Saturation percentage |
|---|---|---|---|
| A | 15910 | 285 | 1.791326% |
| B | 15910 | 366 | 2.300440% |
| C | 15910 | 32 | 0.201131% |
| D | 15910 | 91 | 0.571967% |
Noise dominated data is calculated using 1-second bins in cleaned event files. If a bin has >2000 counts, and if more than 50% of those come from <1% of pixels, then it is considered to be noise-dominated and hence unusable.
| Quadrant | # 1 sec bins | Bins with >0 counts | Bins with >2000 counts | High rate bins dominated by noise | Noise dominated (total time) | Noise dominated (detector-on time) | Marked lightcurve |
|---|---|---|---|---|---|---|---|
| A | 19760 | 15913 | 158 | 158 | 0.80% | 0.99% | 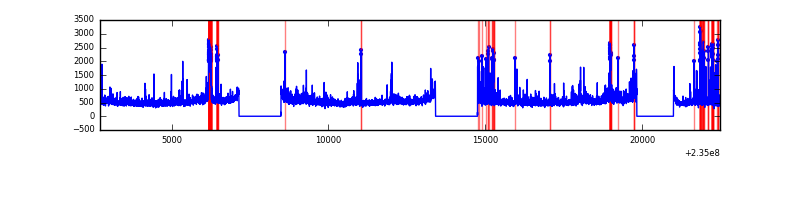 |
| B | 19760 | 15913 | 257 | 257 | 1.30% | 1.62% | 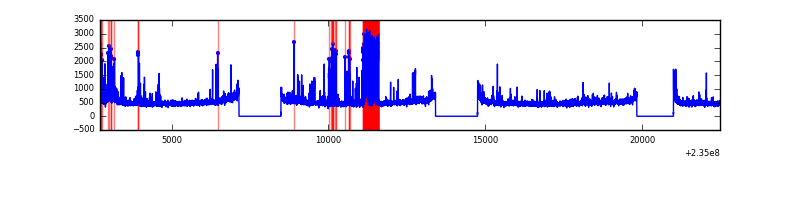 |
| C | 19760 | 15913 | 0 | 0 | 0.00% | 0.00% | 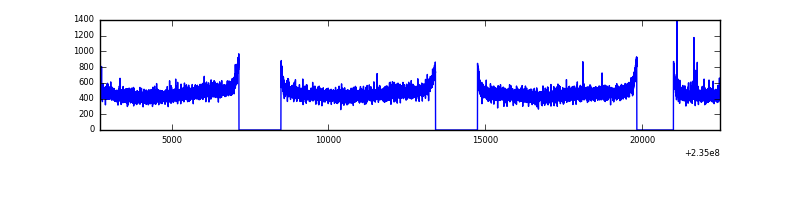 |
| D | 19760 | 15913 | 44 | 44 | 0.22% | 0.28% | 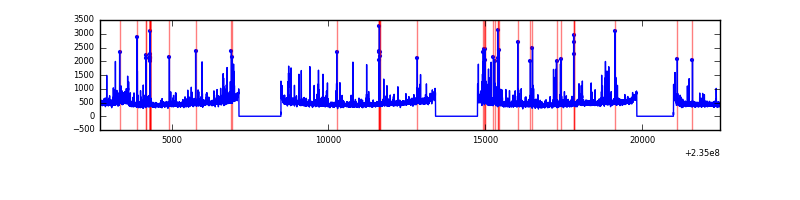 |
Top three noisy pixels from each quadrant. If the there are fewer than three noisy pixels in the level2.evt file, extra rows are filled as -1
| Pixel properties | Quadrant properties | ||||||
|---|---|---|---|---|---|---|---|
| Quadrant | DetID | PixID | Counts | Sigma | Mean | Median | Sigma |
| A | 8 | 5 | 1112129 | 2849.32 | 1939 | 1905 | 389.6 |
| A | 15 | 174 | 339981 | 867.65 | 1939 | 1905 | 389.6 |
| A | 1 | 162 | 176890 | 449.09 | 1939 | 1905 | 389.6 |
| B | 6 | 51 | 813324 | 2219.75 | 1953 | 1910 | 365.5 |
| B | 8 | 234 | 231253 | 627.4 | 1953 | 1910 | 365.5 |
| B | 0 | 245 | 156241 | 422.2 | 1953 | 1910 | 365.5 |
| C | 13 | 61 | 14515 | 29.1 | 1889 | 1901 | 433.5 |
| C | 12 | 4 | 12741 | 25.0 | 1889 | 1901 | 433.5 |
| C | 14 | 67 | 11959 | 23.2 | 1889 | 1901 | 433.5 |
| D | 1 | 52 | 200664 | 410.8 | 1864 | 1818 | 484.0 |
| D | 12 | 233 | 182393 | 373.05 | 1864 | 1818 | 484.0 |
| D | 7 | 71 | 173377 | 354.42 | 1864 | 1818 | 484.0 |
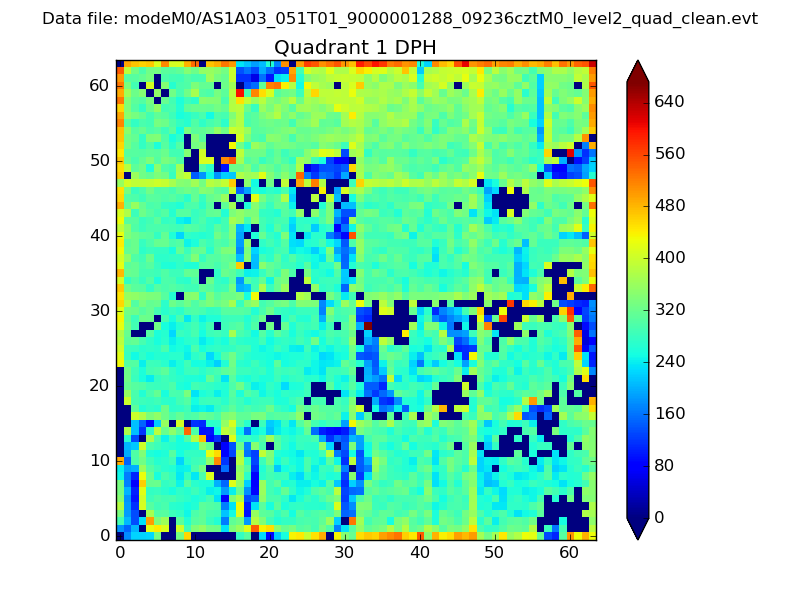
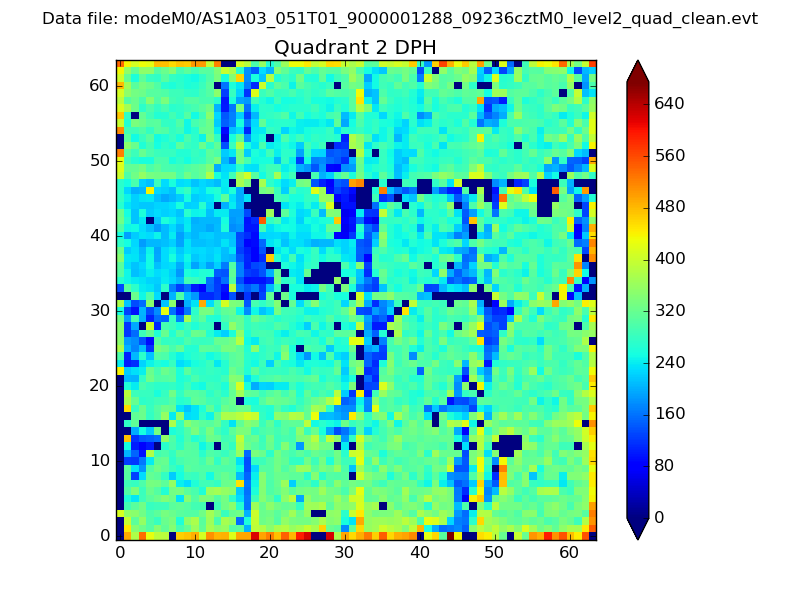
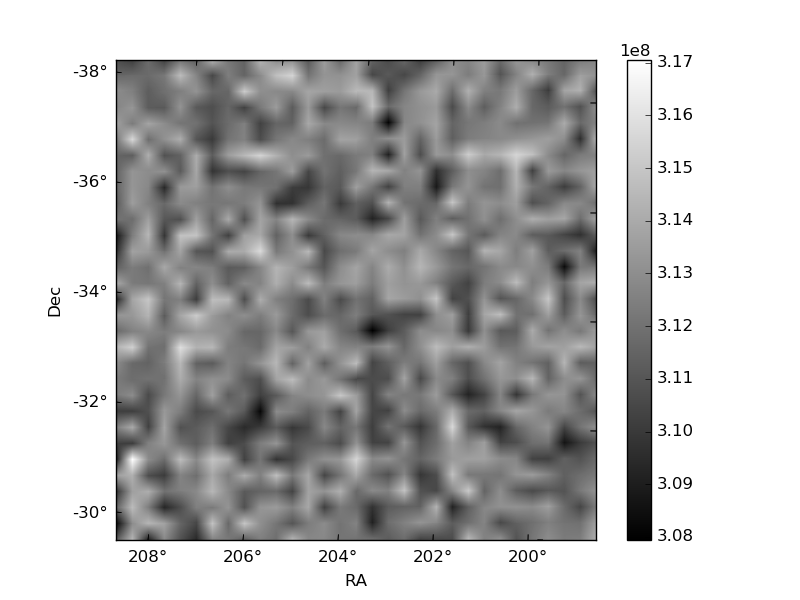
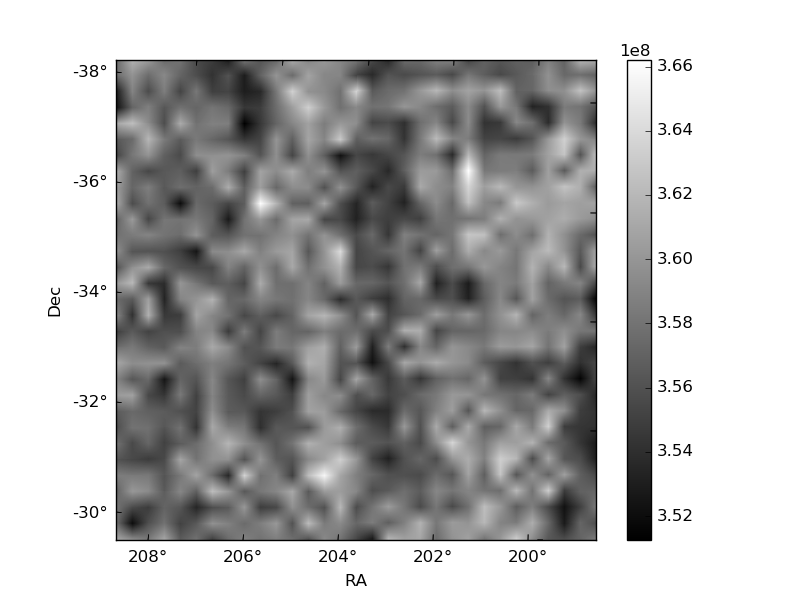
Histogram calculated using DETX and DETY for each event in the final _common_clean file
| Quadrant A |  |
 |
Quadrant B |
|---|---|---|---|
| Quadrant D |  |
 |
Quadrant C |
| Plot type | Count rate plots | Images |
|---|---|---|
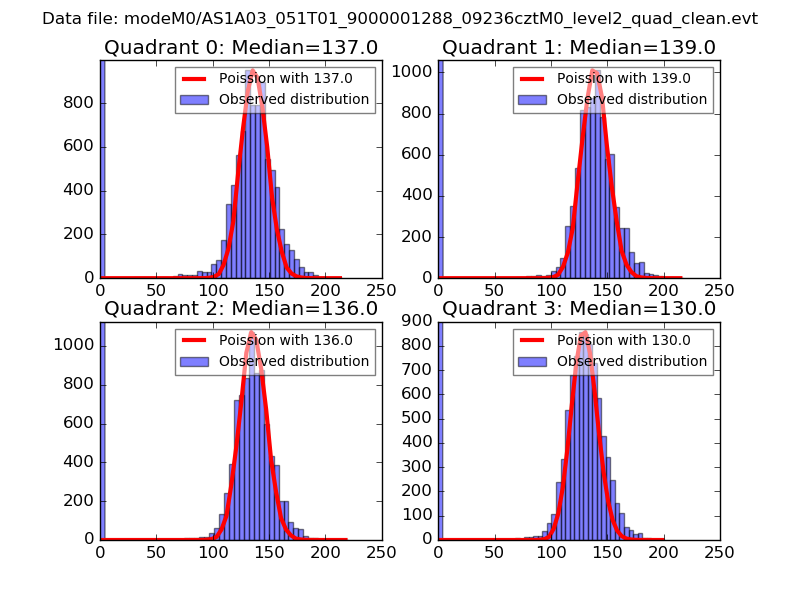
| Comparison with Poisson distribution Blue bars denote a histogram of data divided into 1 sec bins. Red curve is a Poisson curve with rate = median count rate of data. |
 |
 |
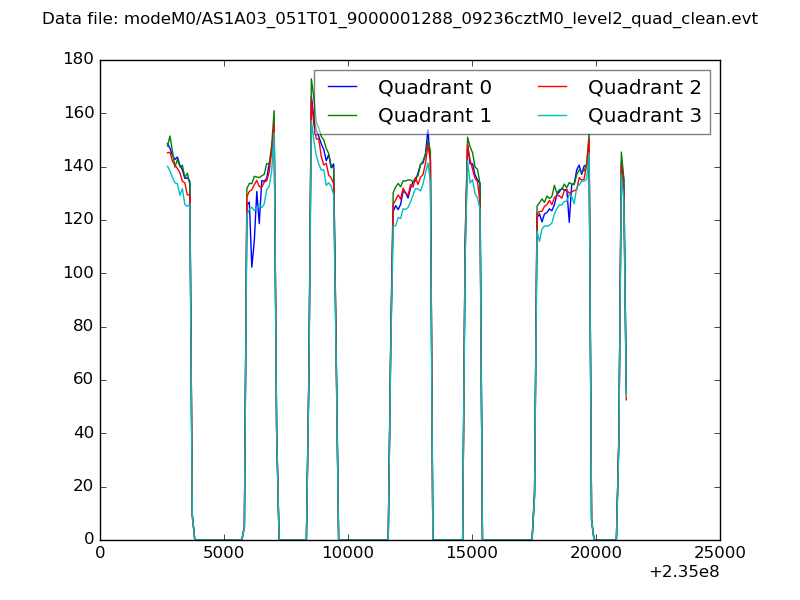
| Quadrant-wise count rates Data is divided into 100 sec bins |
 |
|
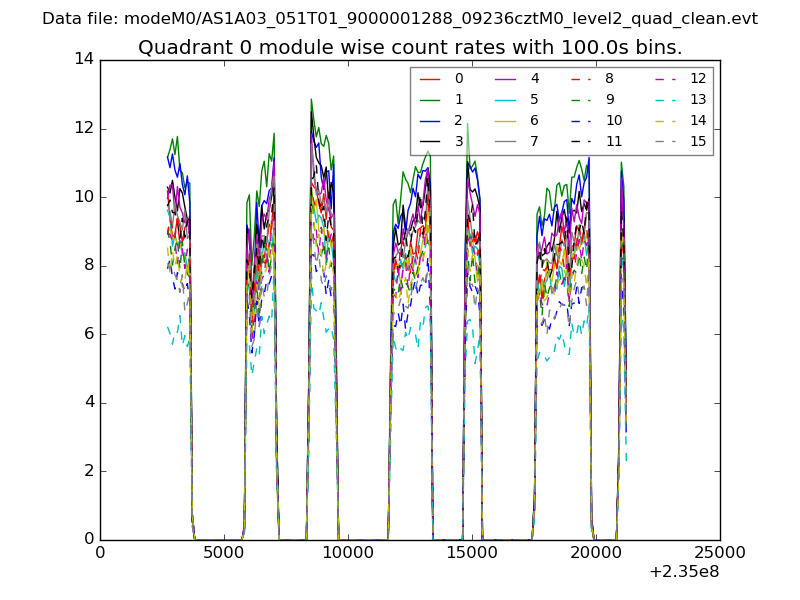
| Module-wise count rates for Quadrant A Data is divided into 100 sec bins |
 |
 |
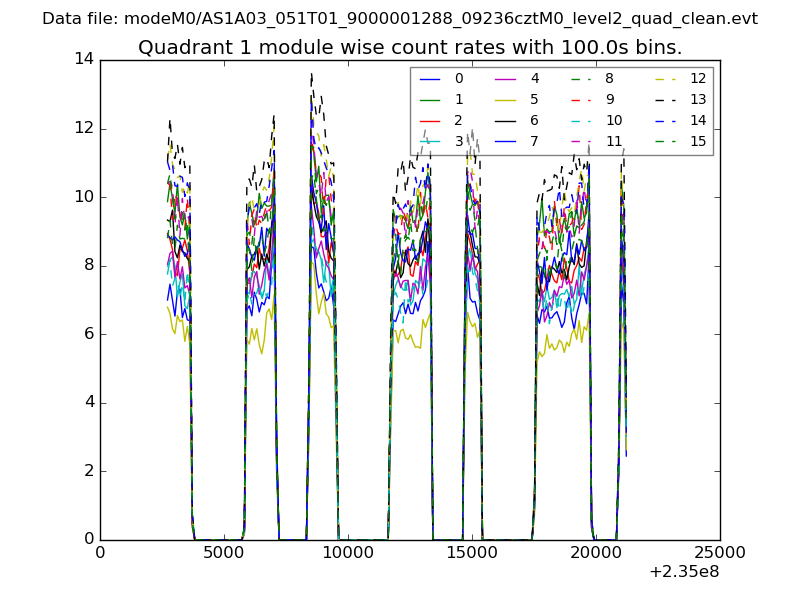
| Module-wise count rates for Quadrant B Data is divided into 100 sec bins |
 |
 |
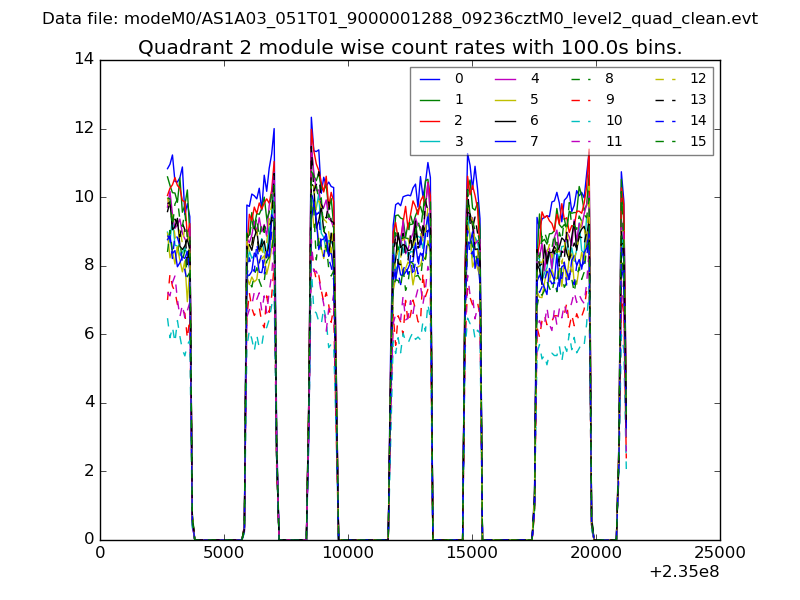
| Module-wise count rates for Quadrant C Data is divided into 100 sec bins |
 |
 |
| Module-wise count rates for Quadrant D Data is divided into 100 sec bins |
 |
 |
| Parameter | Plot |
|---|---|
| CZT HV Monitor |  |
| D_VDD | 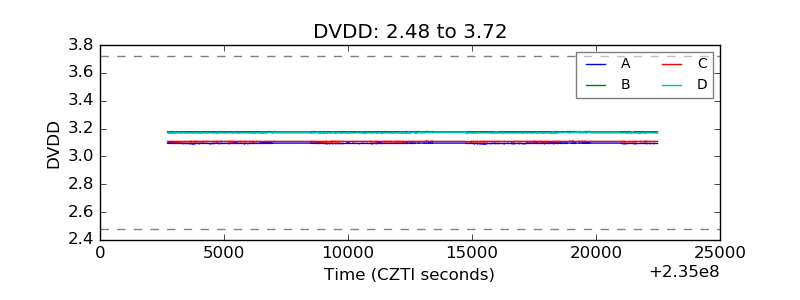 |
| Temperature 1 | 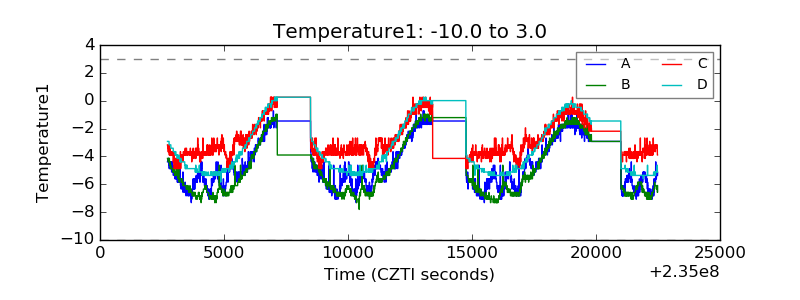 |
| Veto HV Monitor | 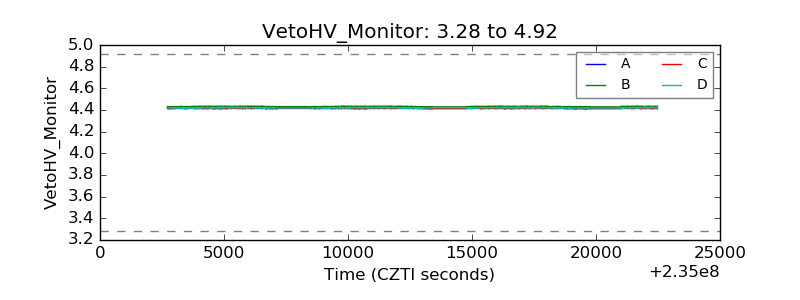 |
| Veto LLD | 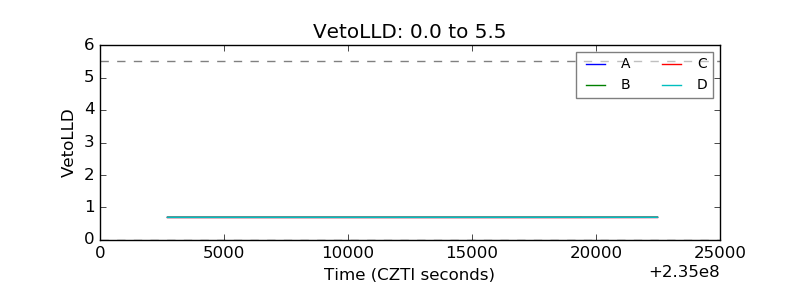 |
| Alpha Counter | 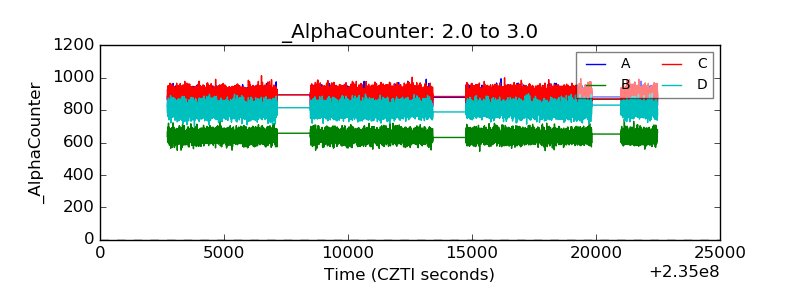 |
| _CPM_Rate | 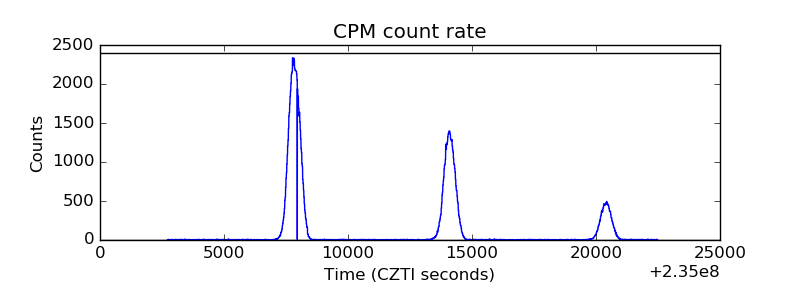 |
| CZT Counter | 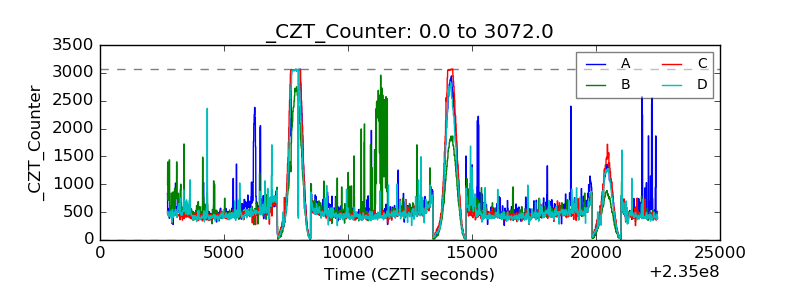 |
| +2.5 Volts monitor | 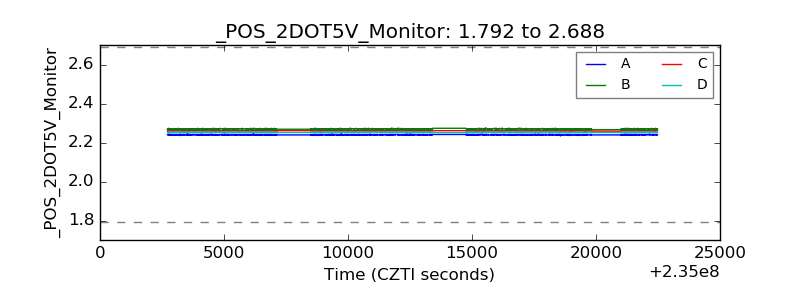 |
| +5 Volts monitor | 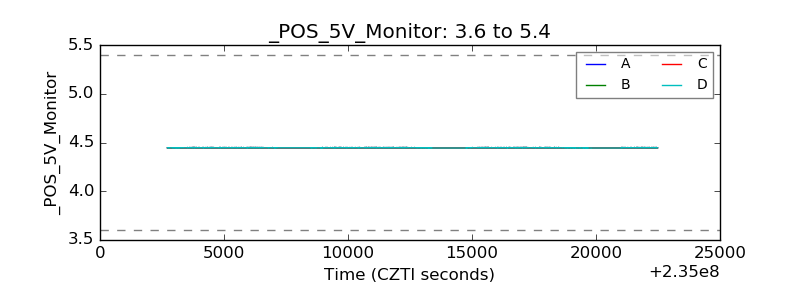 |
| _ROLL_ROT | 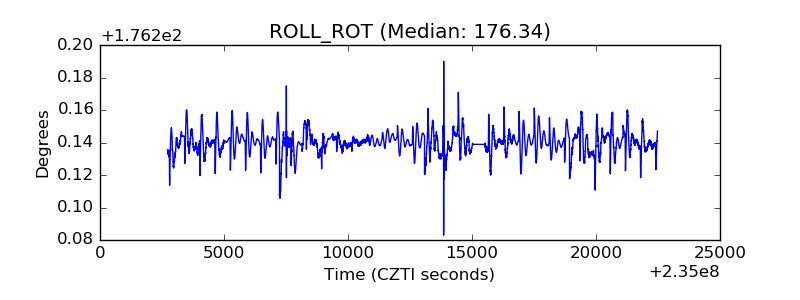 |
| _Roll_DEC | 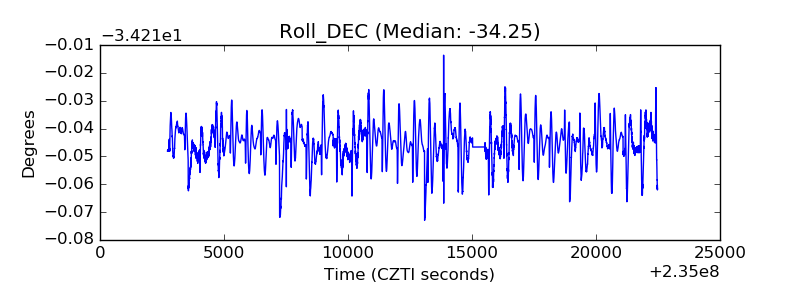 |
| _Roll_RA | 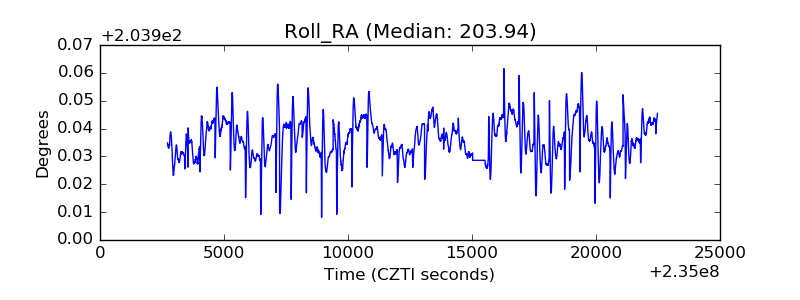 |
| Veto Counter | 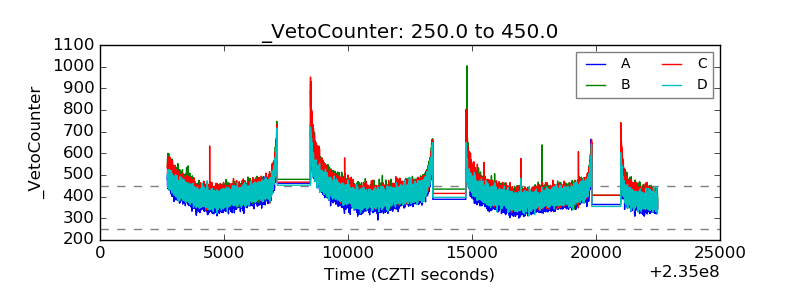 |