| Param | Original file | Final file |
|---|---|---|
| Filename | modeM0/AS1A03_051T01_9000001288_09237cztM0_level2.evt | modeM0/AS1A03_051T01_9000001288_09237cztM0_level2_quad_clean.evt |
| Size (bytes) | 471,430,080 | 67,164,480 |
| Size | 449.6 MB | 64.1 MB |
| Events in quadrant A | 4,223,506 | 389,448 |
| Events in quadrant B | 3,343,033 | 397,915 |
| Events in quadrant C | 3,072,882 | 390,287 |
| Events in quadrant D | 3,176,599 | 382,622 |
| Mode SS | |||
|---|---|---|---|
| Quadrant | BADHDUFLAG | Total packets | Discarded packets |
| A | 0 | 138 | 0 |
| B | 0 | 138 | 0 |
| C | 0 | 138 | 0 |
| D | 0 | 138 | 0 |
| Mode M0 | |||
|---|---|---|---|
| Quadrant | BADHDUFLAG | Total packets | Discarded packets |
| A | 0 | 16890 | 3 |
| B | 0 | 14323 | 2 |
| C | 0 | 13866 | 2 |
| D | 0 | 14270 | 2 |
| Mode M9 | |||
|---|---|---|---|
| Quadrant | BADHDUFLAG | Total packets | Discarded packets |
| A | 0 | 8 | 0 |
| B | 0 | 8 | 0 |
| C | 0 | 8 | 0 |
| D | 0 | 8 | 0 |
| Quadrant | Total seconds | Saturated seconds | Saturation percentage |
|---|---|---|---|
| A | 6788 | 170 | 2.504420% |
| B | 6788 | 47 | 0.692398% |
| C | 6788 | 24 | 0.353565% |
| D | 6788 | 52 | 0.766058% |
Noise dominated data is calculated using 1-second bins in cleaned event files. If a bin has >2000 counts, and if more than 50% of those come from <1% of pixels, then it is considered to be noise-dominated and hence unusable.
| Quadrant | # 1 sec bins | Bins with >0 counts | Bins with >2000 counts | High rate bins dominated by noise | Noise dominated (total time) | Noise dominated (detector-on time) | Marked lightcurve |
|---|---|---|---|---|---|---|---|
| A | 7608 | 6789 | 97 | 97 | 1.27% | 1.43% | 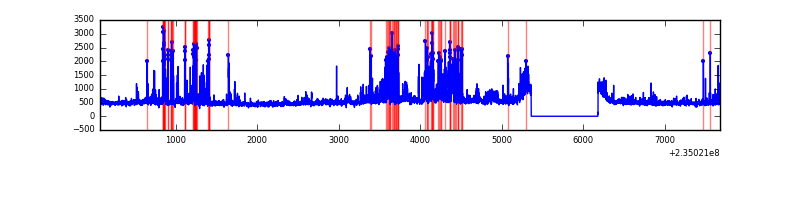 |
| B | 7608 | 6789 | 3 | 3 | 0.04% | 0.04% | 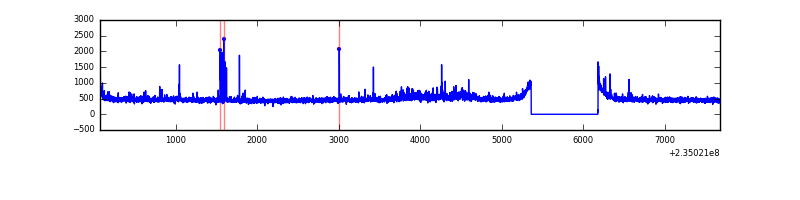 |
| C | 7608 | 6789 | 0 | 0 | 0.00% | 0.00% | 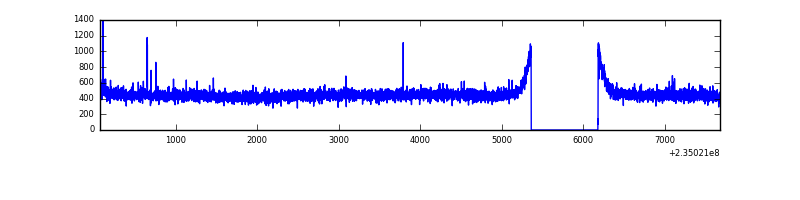 |
| D | 7608 | 6789 | 18 | 18 | 0.24% | 0.27% | 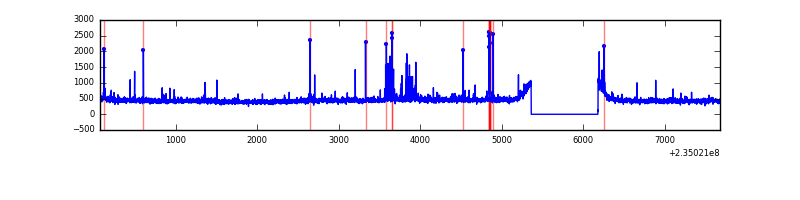 |
Top three noisy pixels from each quadrant. If the there are fewer than three noisy pixels in the level2.evt file, extra rows are filled as -1
| Pixel properties | Quadrant properties | ||||||
|---|---|---|---|---|---|---|---|
| Quadrant | DetID | PixID | Counts | Sigma | Mean | Median | Sigma |
| A | 8 | 5 | 1006321 | 6120.64 | 802 | 786 | 164.3 |
| A | 13 | 251 | 48641 | 291.29 | 802 | 786 | 164.3 |
| A | 1 | 162 | 44524 | 266.23 | 802 | 786 | 164.3 |
| B | 0 | 214 | 58476 | 369.52 | 813 | 793 | 156.1 |
| B | 4 | 48 | 31612 | 197.43 | 813 | 793 | 156.1 |
| B | 4 | 80 | 24459 | 151.61 | 813 | 793 | 156.1 |
| C | 12 | 4 | 10006 | 50.3 | 783 | 786 | 183.3 |
| C | 13 | 61 | 6072 | 28.84 | 783 | 786 | 183.3 |
| C | 8 | 222 | 4370 | 19.55 | 783 | 786 | 183.3 |
| D | 7 | 71 | 74445 | 360.15 | 776 | 756 | 204.6 |
| D | 1 | 52 | 54278 | 261.59 | 776 | 756 | 204.6 |
| D | 12 | 233 | 30659 | 146.15 | 776 | 756 | 204.6 |
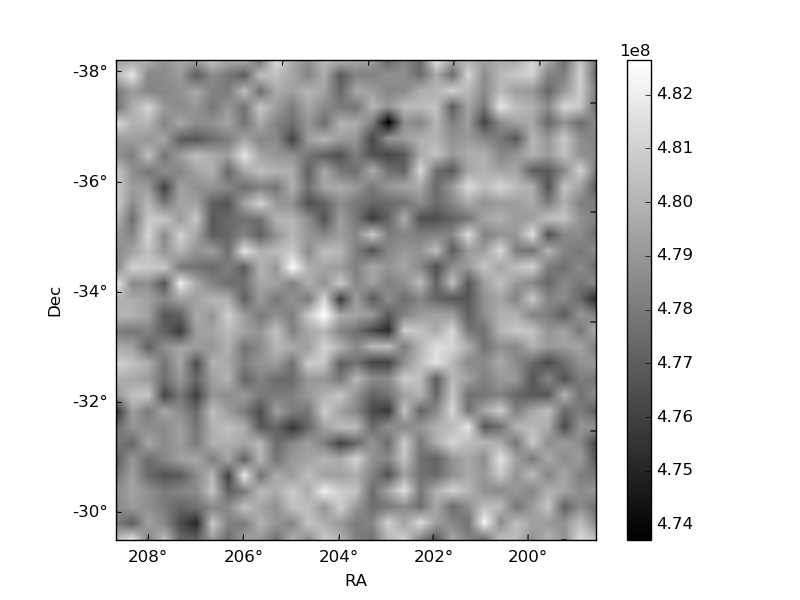
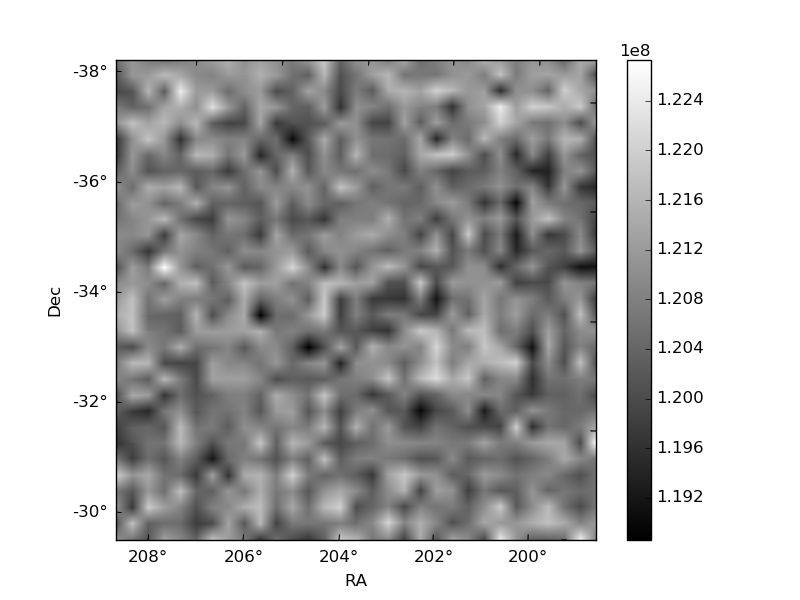
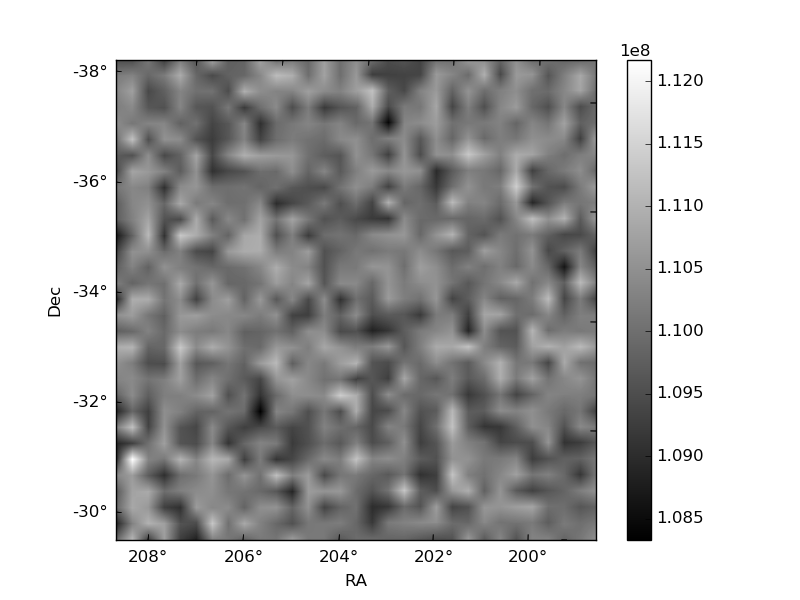
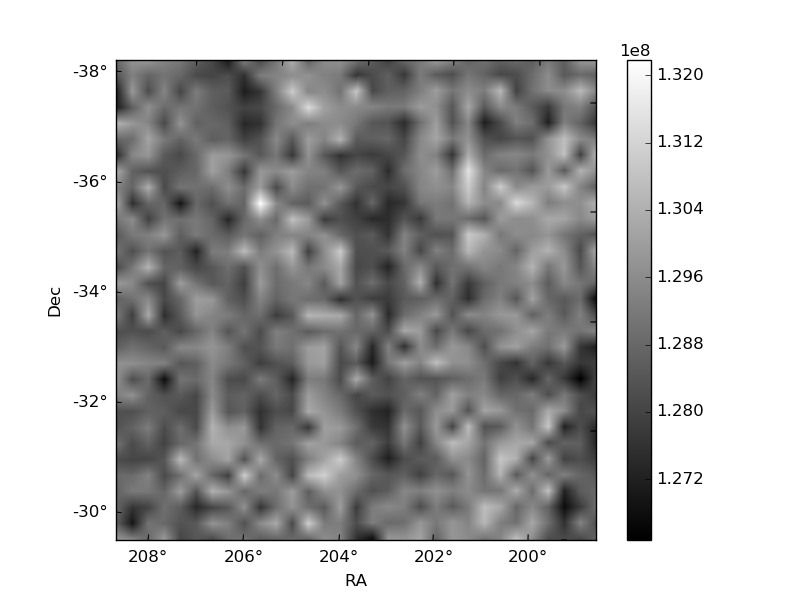
Histogram calculated using DETX and DETY for each event in the final _common_clean file
| Quadrant A | 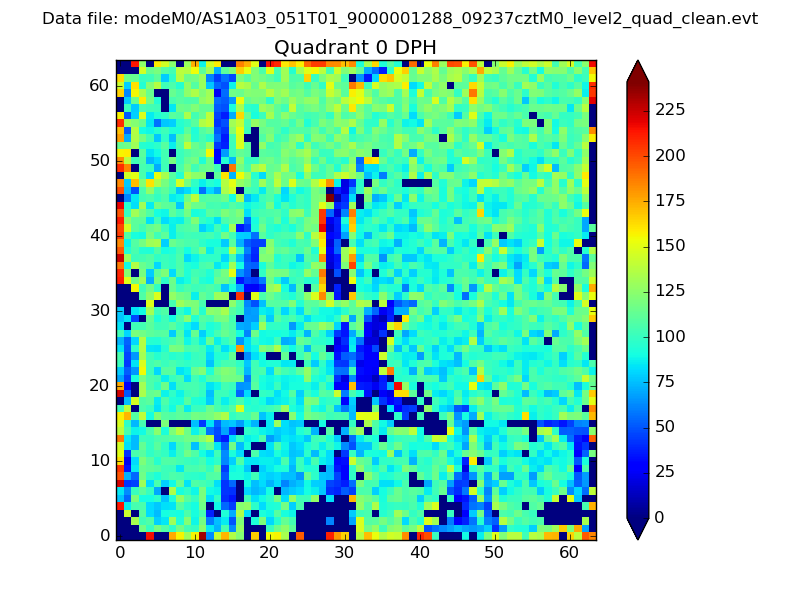 |
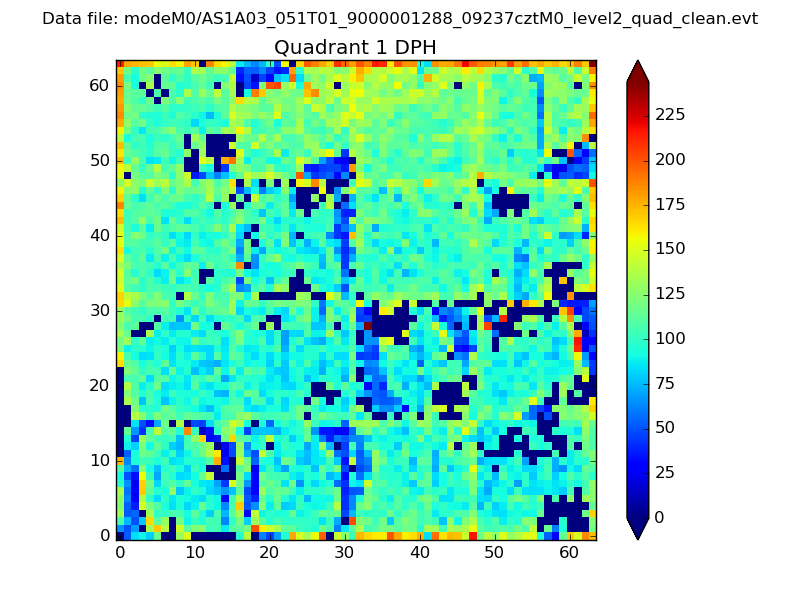 |
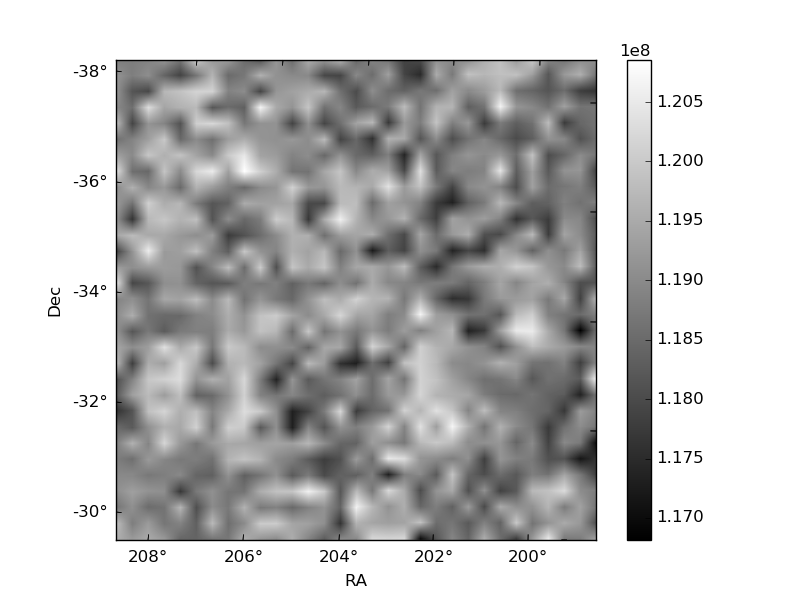
Quadrant B |
|---|---|---|---|
| Quadrant D | 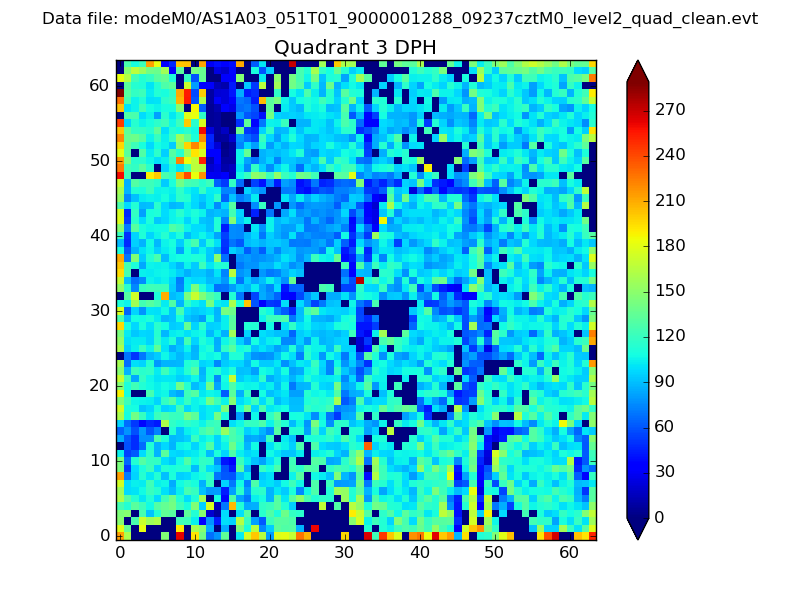 |
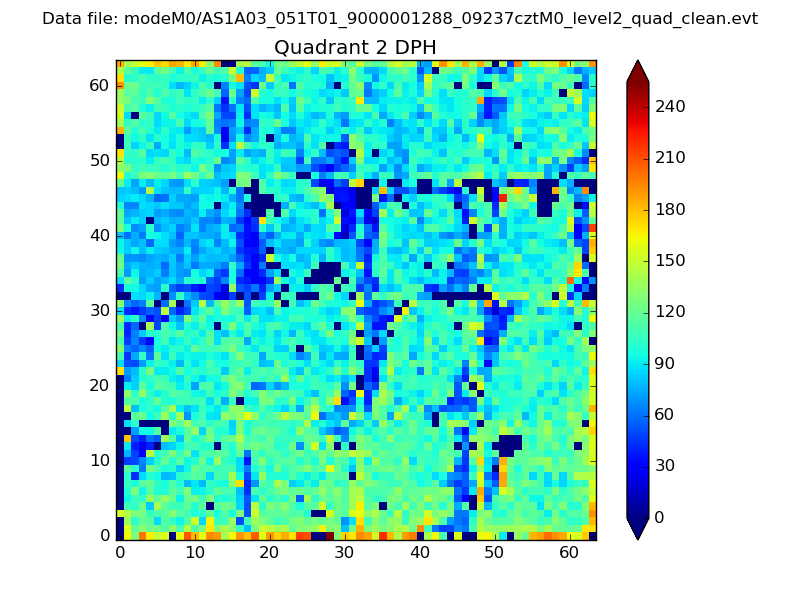 |
Quadrant C |
| Plot type | Count rate plots | Images |
|---|---|---|
| Comparison with Poisson distribution Blue bars denote a histogram of data divided into 1 sec bins. Red curve is a Poisson curve with rate = median count rate of data. |
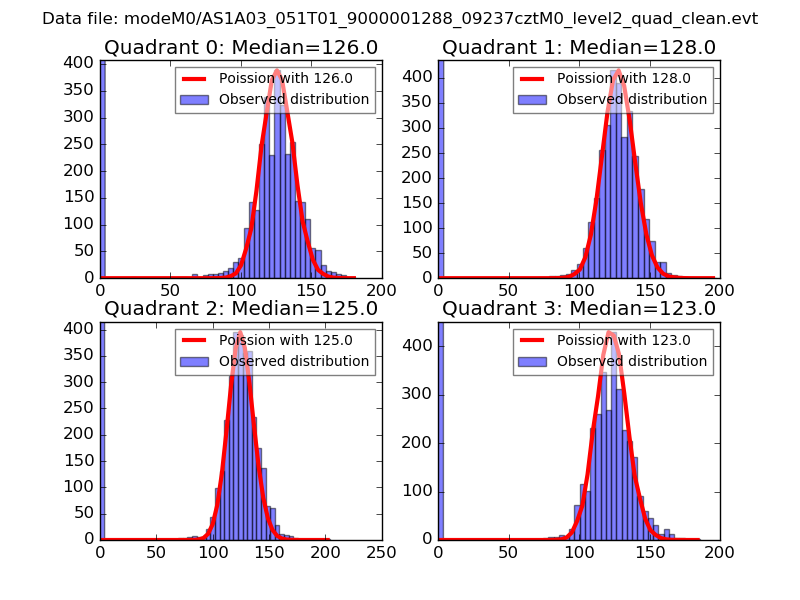 |
 |
| Quadrant-wise count rates Data is divided into 100 sec bins |
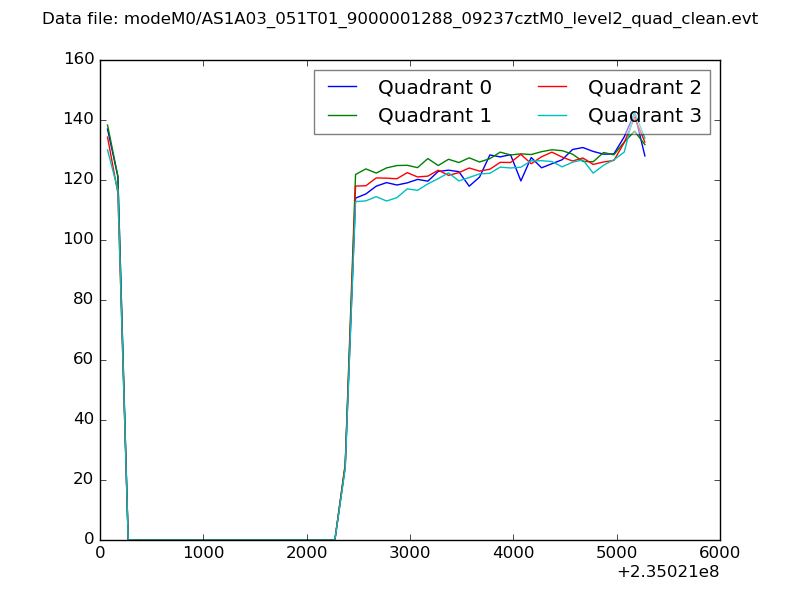 |
|
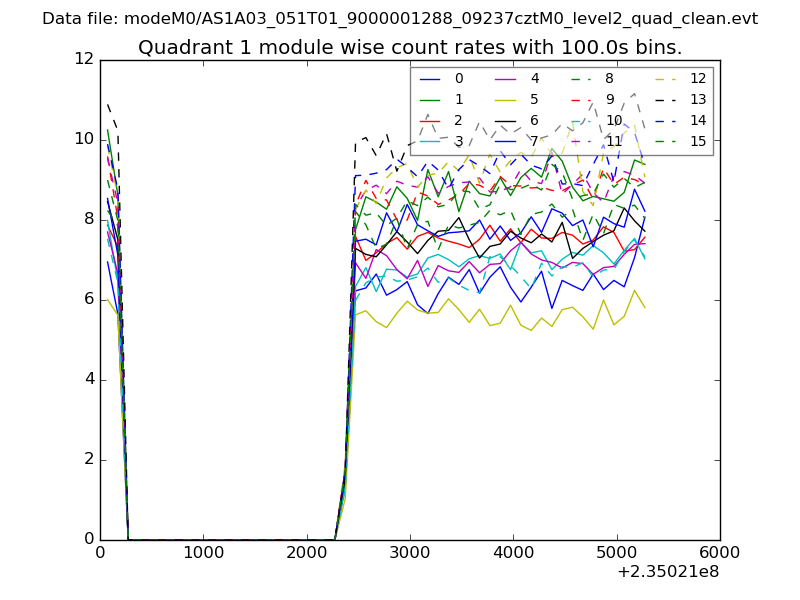
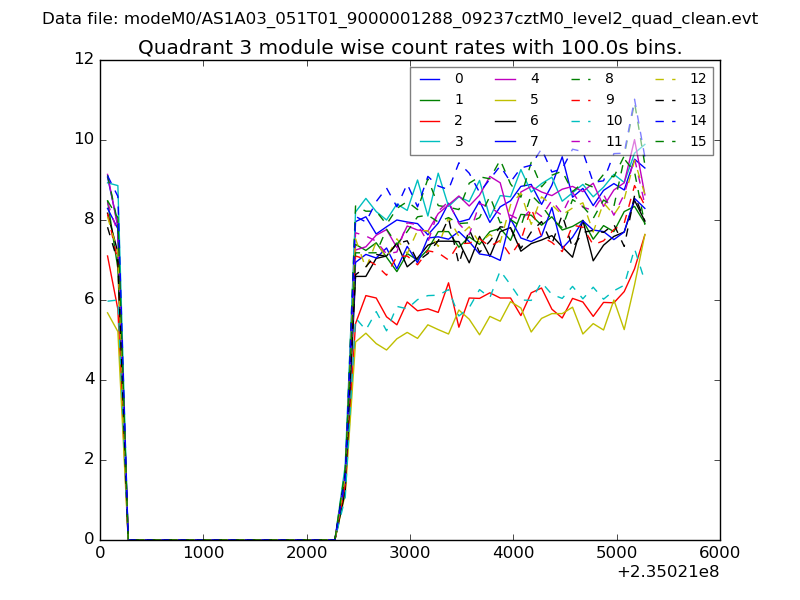
| Module-wise count rates for Quadrant A Data is divided into 100 sec bins |
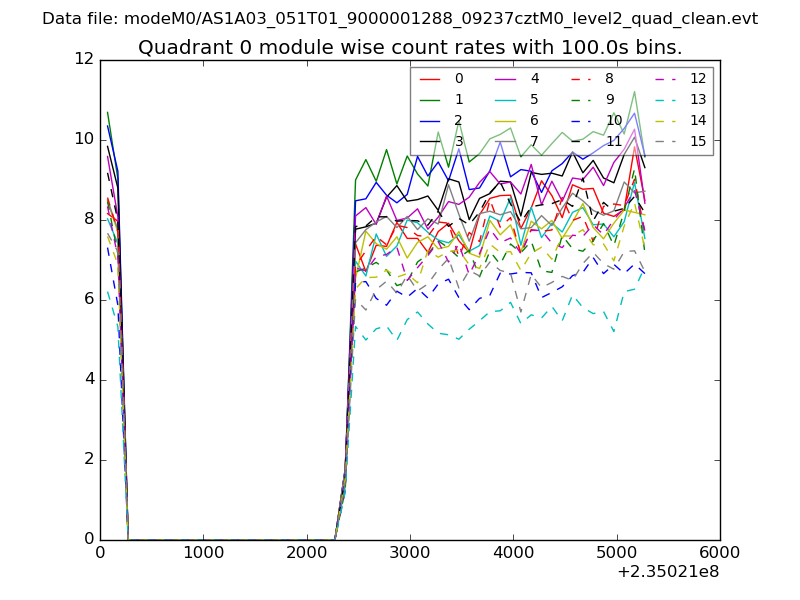 |
 |
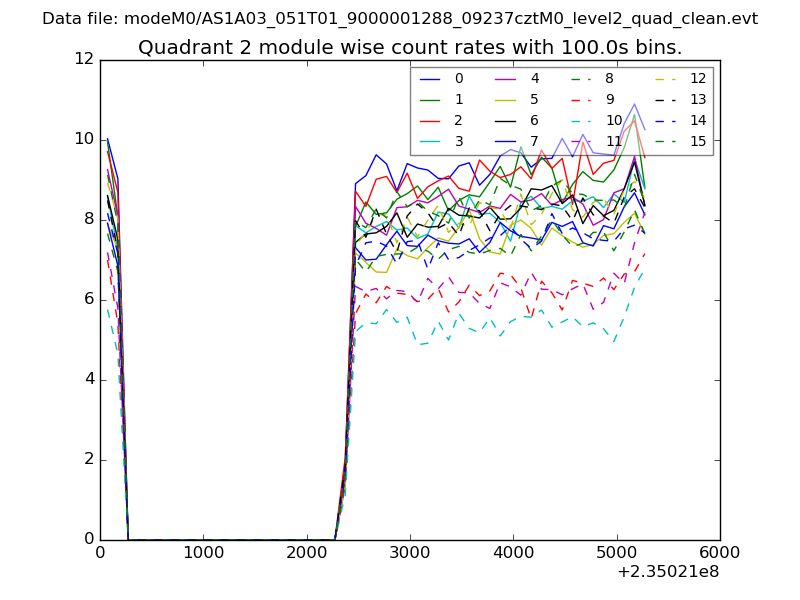
| Module-wise count rates for Quadrant B Data is divided into 100 sec bins |
 |
 |
| Module-wise count rates for Quadrant C Data is divided into 100 sec bins |
 |
 |
| Module-wise count rates for Quadrant D Data is divided into 100 sec bins |
 |
 |
| Parameter | Plot |
|---|---|
| CZT HV Monitor | 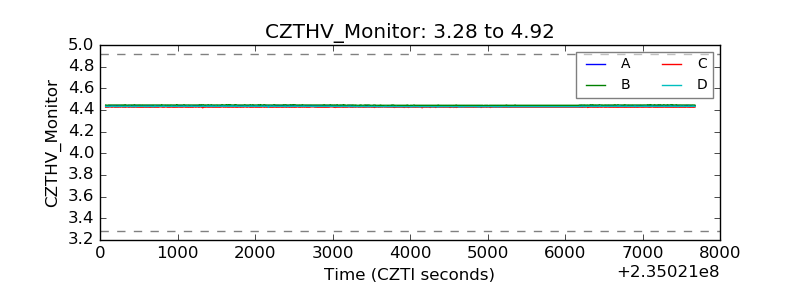 |
| D_VDD | 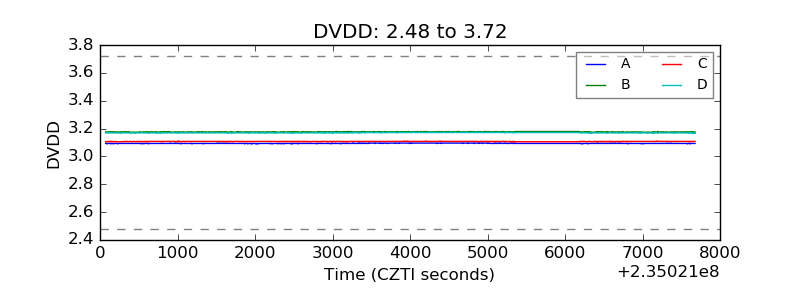 |
| Temperature 1 | 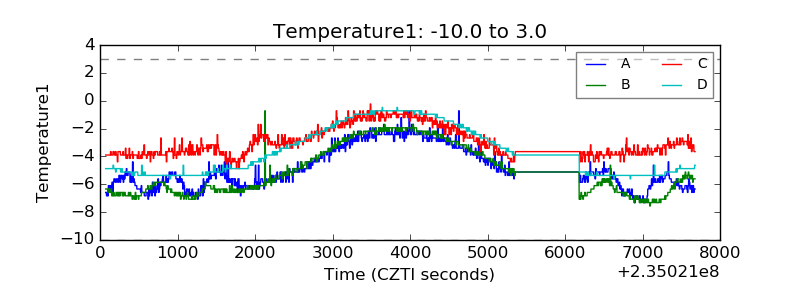 |
| Veto HV Monitor | 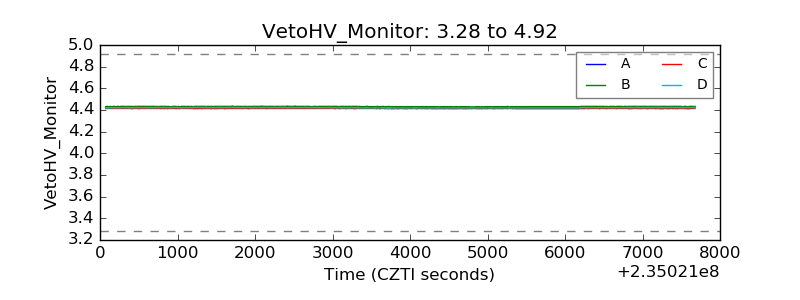 |
| Veto LLD | 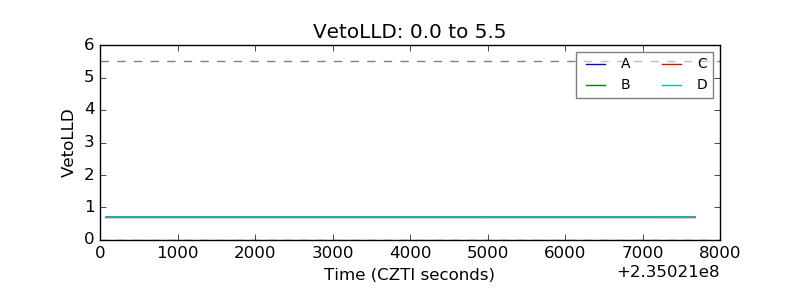 |
| Alpha Counter | 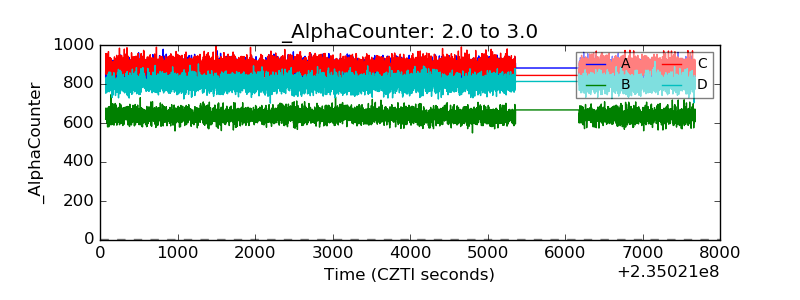 |
| _CPM_Rate | 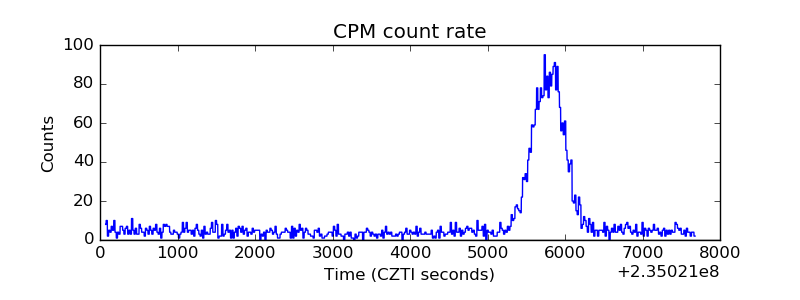 |
| CZT Counter | 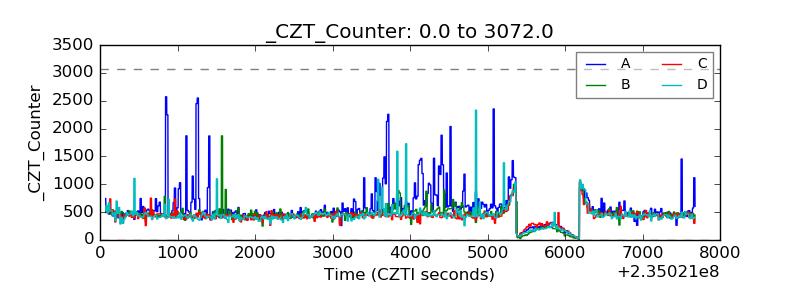 |
| +2.5 Volts monitor |  |
| +5 Volts monitor |  |
| _ROLL_ROT | 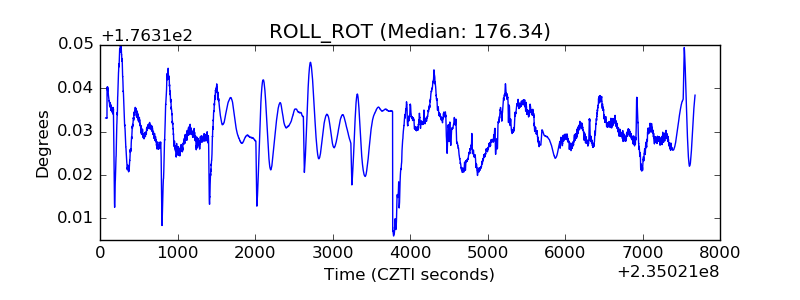 |
| _Roll_DEC | 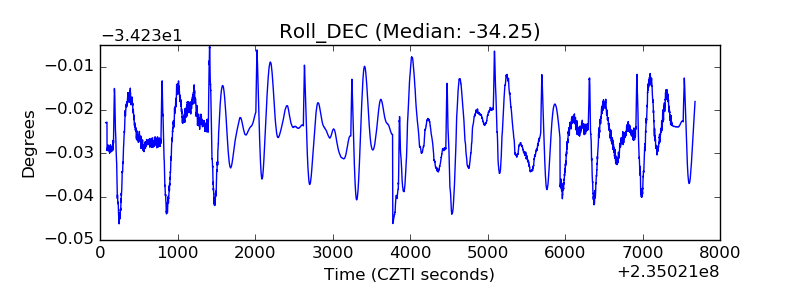 |
| _Roll_RA | 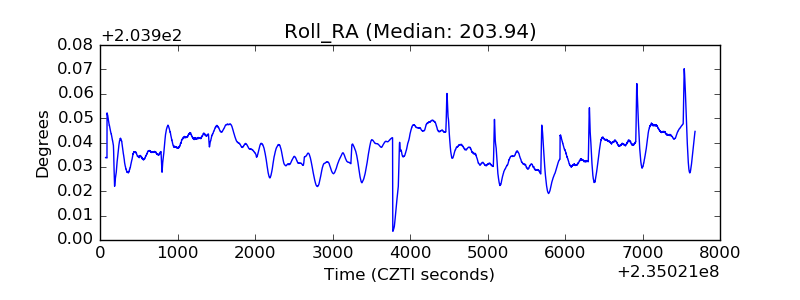 |
| Veto Counter | 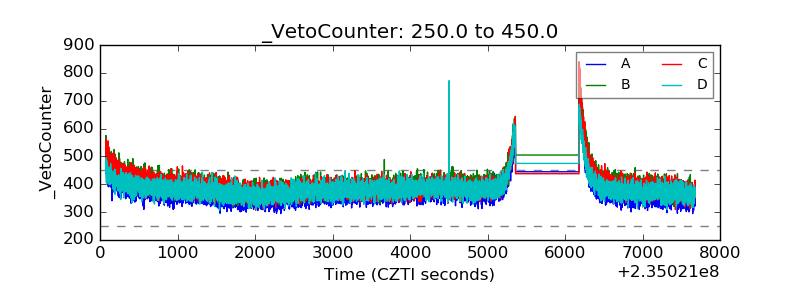 |