| Param | Original file | Final file |
|---|---|---|
| Filename | modeM0/AS1A03_051T01_9000001288_09242cztM0_level2.evt | modeM0/AS1A03_051T01_9000001288_09242cztM0_level2_quad_clean.evt |
| Size (bytes) | 248,440,320 | 43,994,880 |
| Size | 236.9 MB | 42.0 MB |
| Events in quadrant A | 2,163,126 | 266,700 |
| Events in quadrant B | 1,626,504 | 285,634 |
| Events in quadrant C | 1,517,416 | 279,847 |
| Events in quadrant D | 1,988,809 | 263,891 |
| Mode SS | |||
|---|---|---|---|
| Quadrant | BADHDUFLAG | Total packets | Discarded packets |
| A | 0 | 88 | 16 |
| B | 0 | 88 | 16 |
| C | 0 | 87 | 11 |
| D | 0 | 88 | 18 |
| Mode M0 | |||
|---|---|---|---|
| Quadrant | BADHDUFLAG | Total packets | Discarded packets |
| A | 0 | 11466 | 2890 |
| B | 0 | 8921 | 1921 |
| C | 0 | 8762 | 1808 |
| D | 0 | 10568 | 2587 |
| Mode M9 | |||
|---|---|---|---|
| Quadrant | BADHDUFLAG | Total packets | Discarded packets |
| A | 0 | 3 | 0 |
| B | 0 | 3 | 1 |
| C | 0 | 3 | 0 |
| D | 0 | 3 | 0 |
| Quadrant | Total seconds | Saturated seconds | Saturation percentage |
|---|---|---|---|
| A | 3216 | 178 | 5.534826% |
| B | 3335 | 118 | 3.538231% |
| C | 3367 | 88 | 2.613603% |
| D | 3280 | 122 | 3.719512% |
Noise dominated data is calculated using 1-second bins in cleaned event files. If a bin has >2000 counts, and if more than 50% of those come from <1% of pixels, then it is considered to be noise-dominated and hence unusable.
| Quadrant | # 1 sec bins | Bins with >0 counts | Bins with >2000 counts | High rate bins dominated by noise | Noise dominated (total time) | Noise dominated (detector-on time) | Marked lightcurve |
|---|---|---|---|---|---|---|---|
| A | 4562 | 3695 | 40 | 40 | 0.88% | 1.08% | 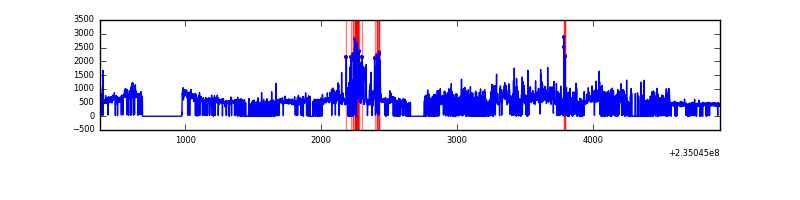 |
| B | 4562 | 3792 | 0 | 0 | 0.00% | 0.00% | 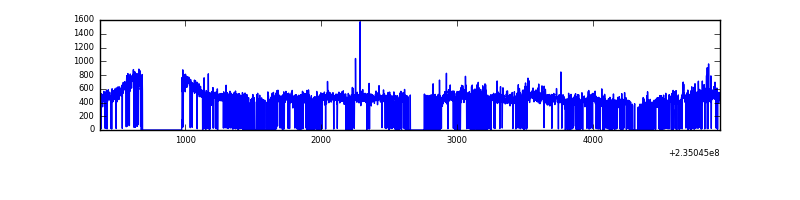 |
| C | 4562 | 3815 | 0 | 0 | 0.00% | 0.00% | 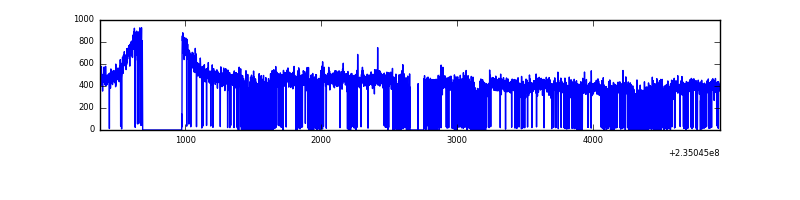 |
| D | 4562 | 3741 | 21 | 21 | 0.46% | 0.56% | 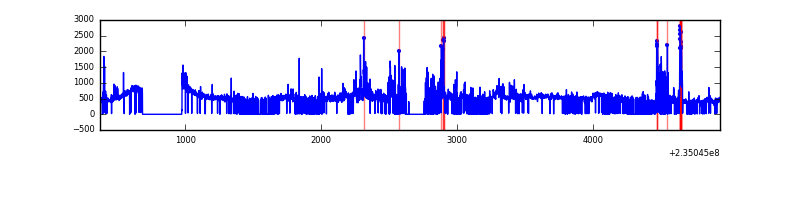 |
Top three noisy pixels from each quadrant. If the there are fewer than three noisy pixels in the level2.evt file, extra rows are filled as -1
| Pixel properties | Quadrant properties | ||||||
|---|---|---|---|---|---|---|---|
| Quadrant | DetID | PixID | Counts | Sigma | Mean | Median | Sigma |
| A | 8 | 5 | 656916 | 8236.61 | 380 | 370 | 79.7 |
| A | 5 | 16 | 27300 | 337.85 | 380 | 370 | 79.7 |
| A | 13 | 251 | 8668 | 104.1 | 380 | 370 | 79.7 |
| B | 0 | 214 | 28870 | 362.9 | 395 | 384 | 78.5 |
| B | 0 | 168 | 26825 | 336.85 | 395 | 384 | 78.5 |
| B | 0 | 245 | 14209 | 176.13 | 395 | 384 | 78.5 |
| C | 9 | 68 | 4050 | 39.86 | 387 | 388 | 91.9 |
| C | 13 | 61 | 2960 | 28.0 | 387 | 388 | 91.9 |
| C | 14 | 67 | 1469 | 11.77 | 387 | 388 | 91.9 |
| D | 1 | 52 | 484784 | 4734.43 | 376 | 365 | 102.3 |
| D | 12 | 233 | 23432 | 225.44 | 376 | 365 | 102.3 |
| D | 7 | 71 | 15091 | 143.92 | 376 | 365 | 102.3 |
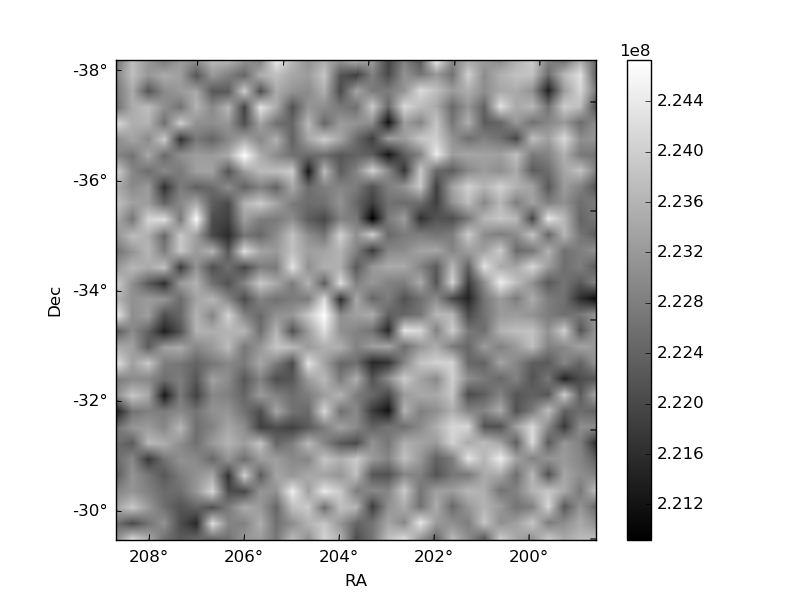
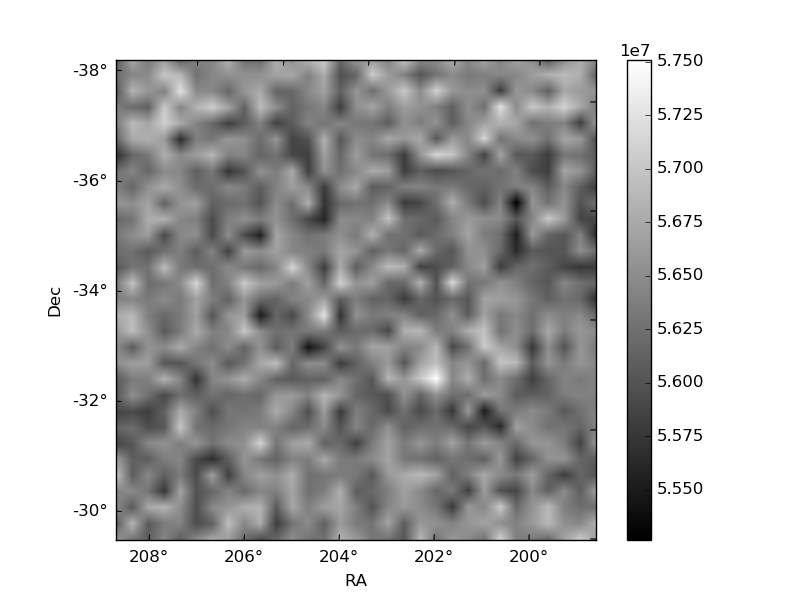
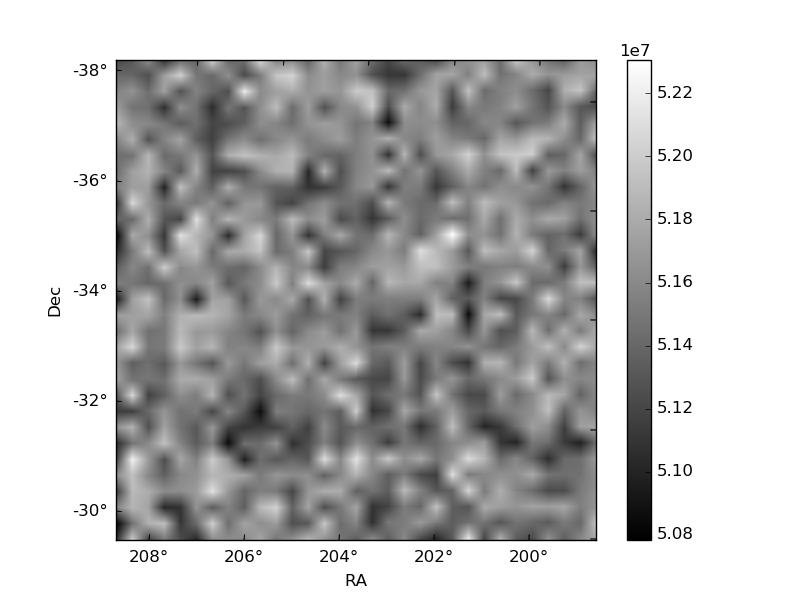
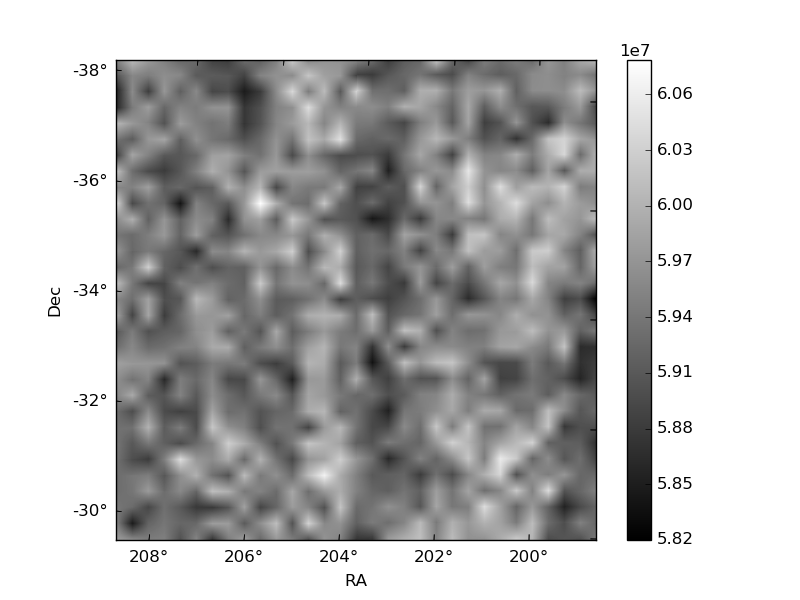
Histogram calculated using DETX and DETY for each event in the final _common_clean file
| Quadrant A | 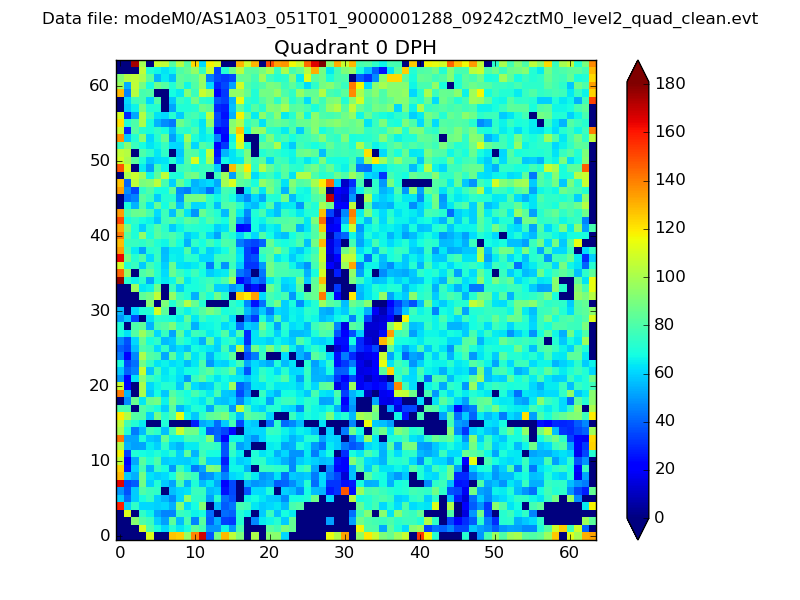 |
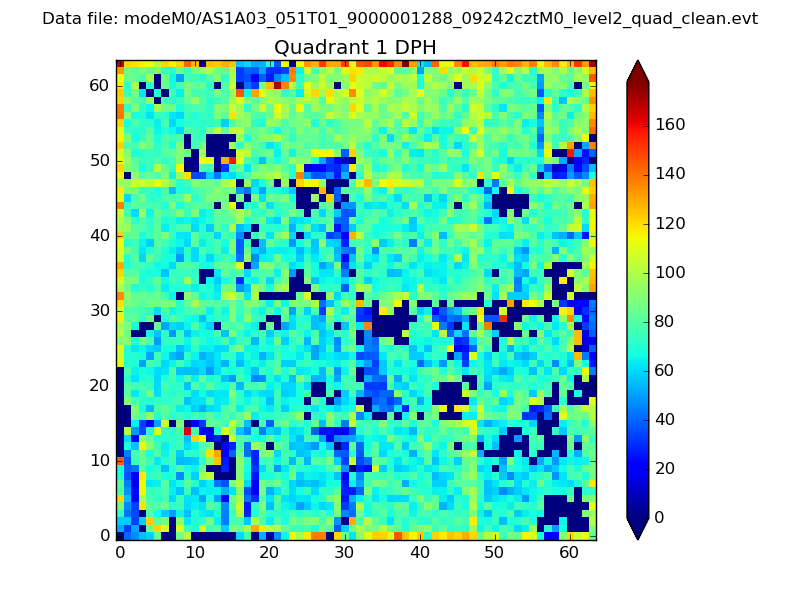 |
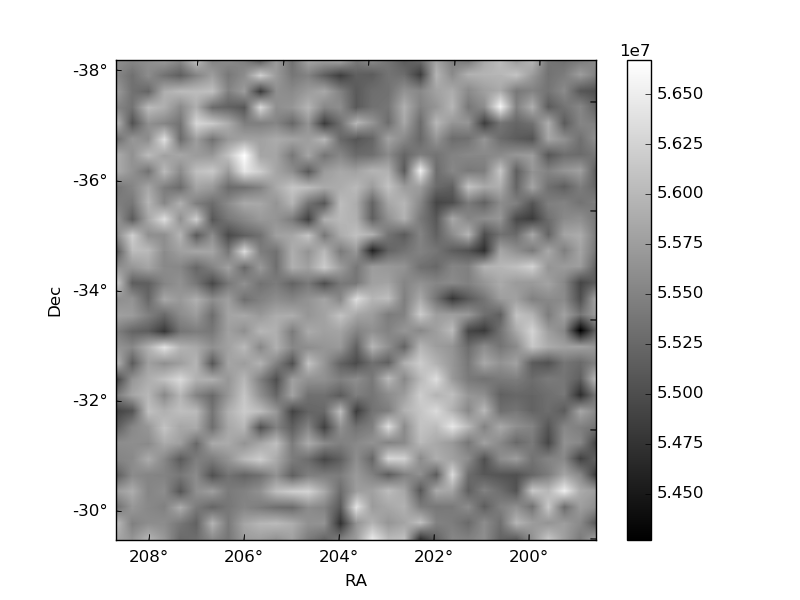
Quadrant B |
|---|---|---|---|
| Quadrant D | 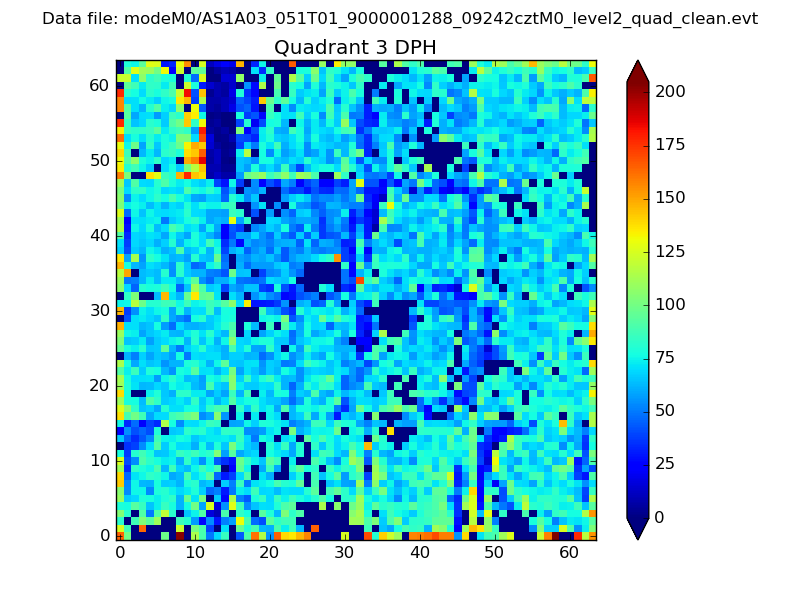 |
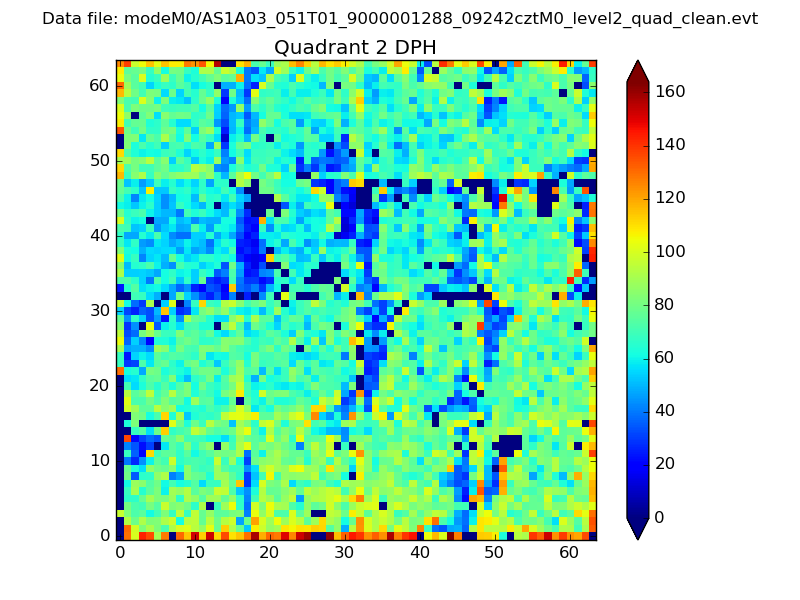 |
Quadrant C |
| Plot type | Count rate plots | Images |
|---|---|---|
| Comparison with Poisson distribution Blue bars denote a histogram of data divided into 1 sec bins. Red curve is a Poisson curve with rate = median count rate of data. |
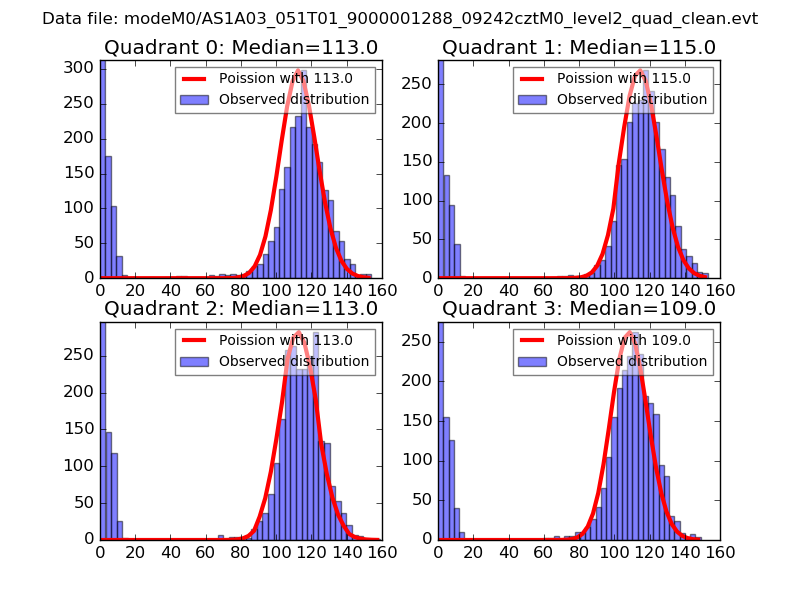 |
 |
| Quadrant-wise count rates Data is divided into 100 sec bins |
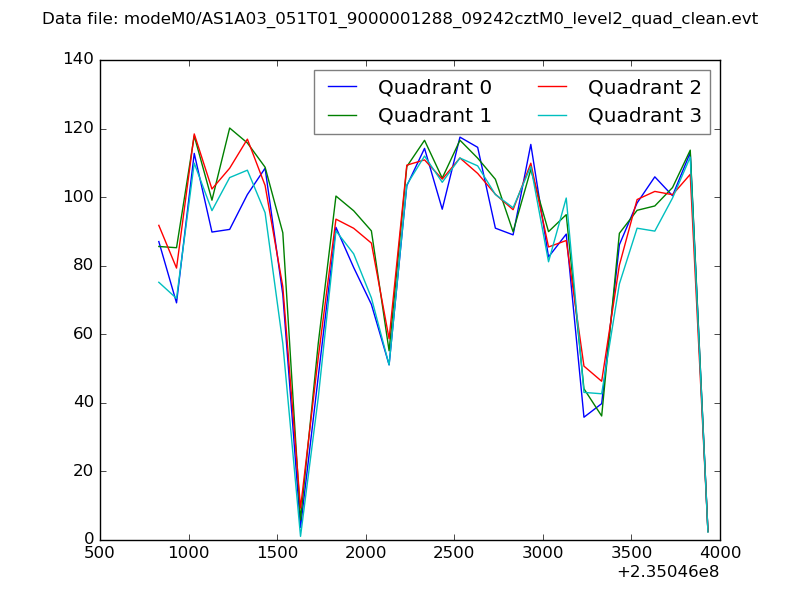 |
|
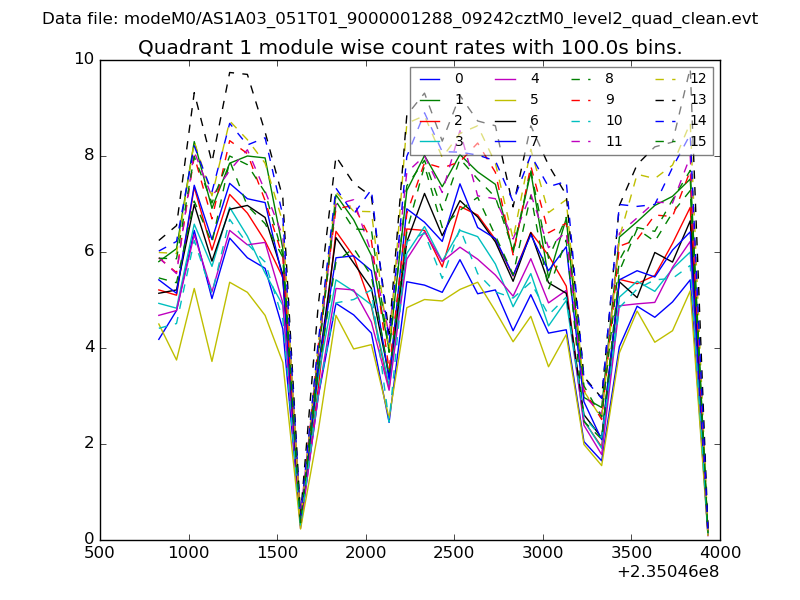
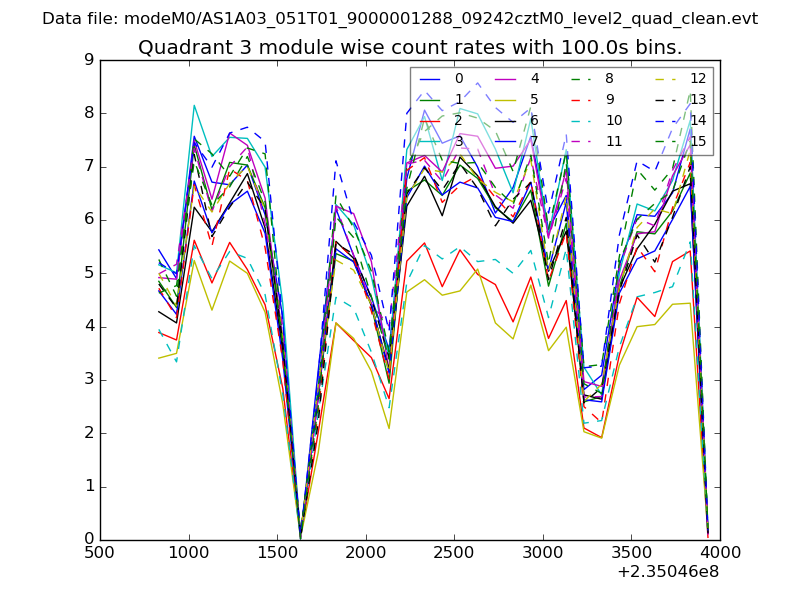
| Module-wise count rates for Quadrant A Data is divided into 100 sec bins |
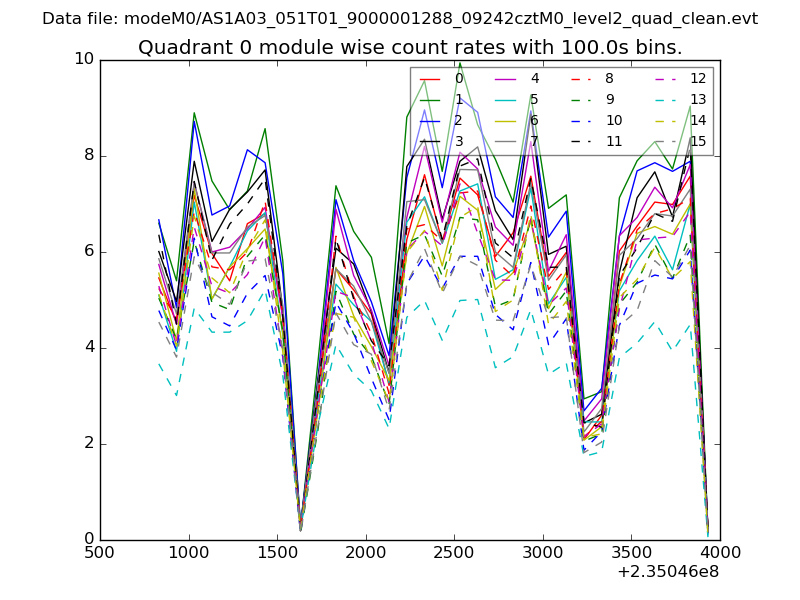 |
 |
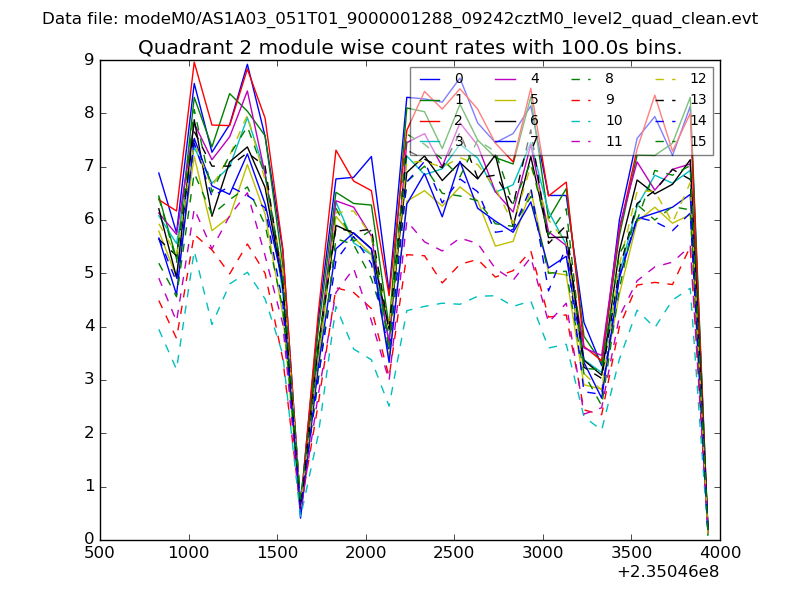
| Module-wise count rates for Quadrant B Data is divided into 100 sec bins |
 |
 |
| Module-wise count rates for Quadrant C Data is divided into 100 sec bins |
 |
 |
| Module-wise count rates for Quadrant D Data is divided into 100 sec bins |
 |
 |
| Parameter | Plot |
|---|---|
| CZT HV Monitor | 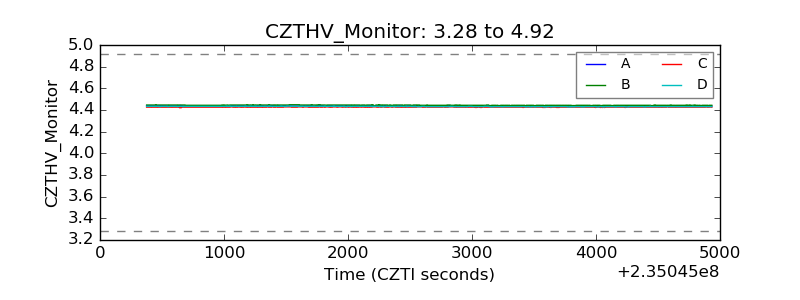 |
| D_VDD | 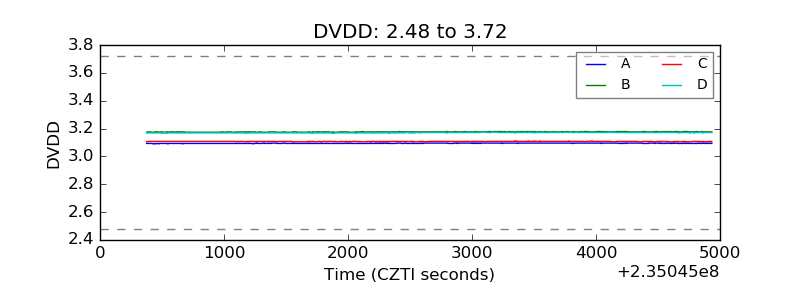 |
| Temperature 1 |  |
| Veto HV Monitor | 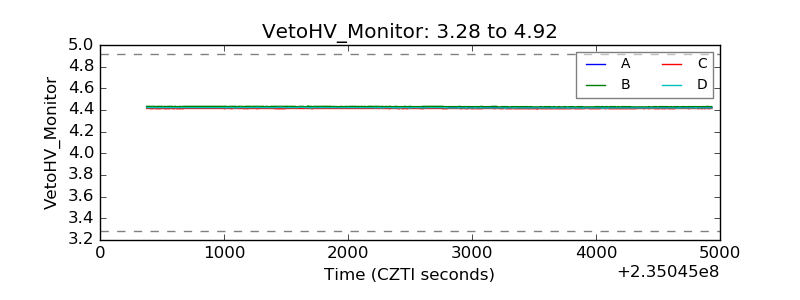 |
| Veto LLD | 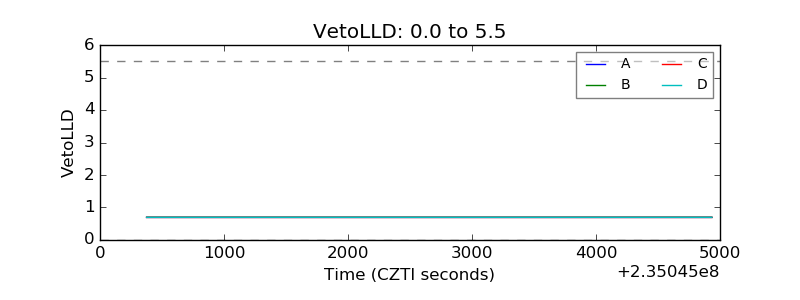 |
| Alpha Counter | 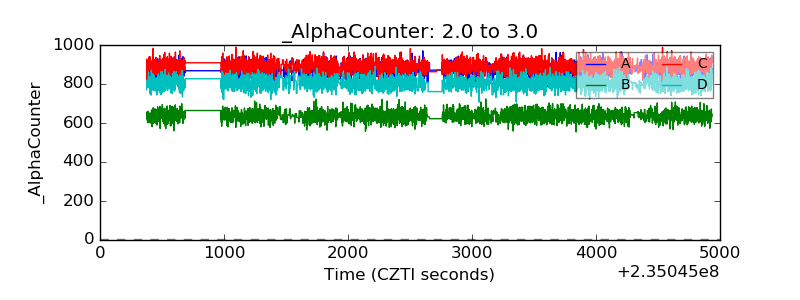 |
| _CPM_Rate | 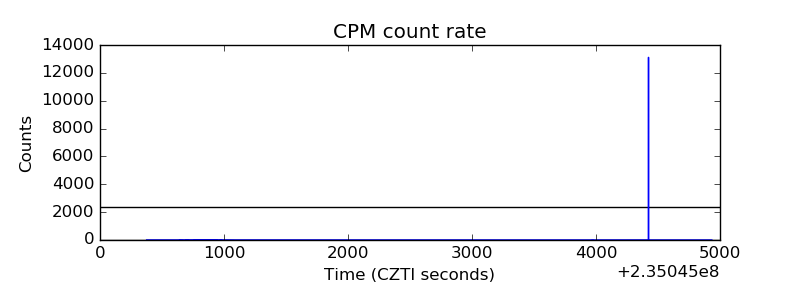 |
| CZT Counter | 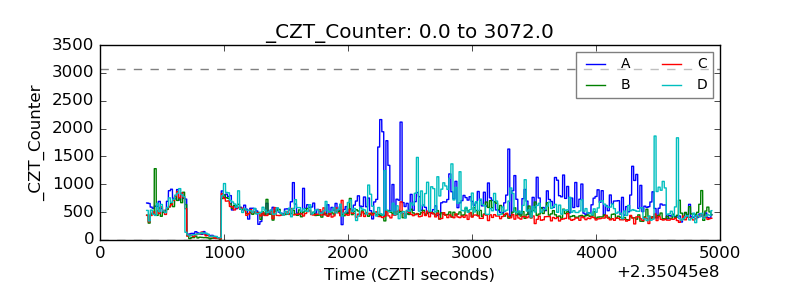 |
| +2.5 Volts monitor | 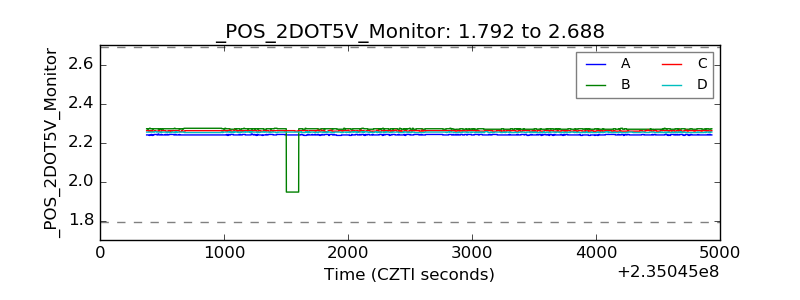 |
| +5 Volts monitor | 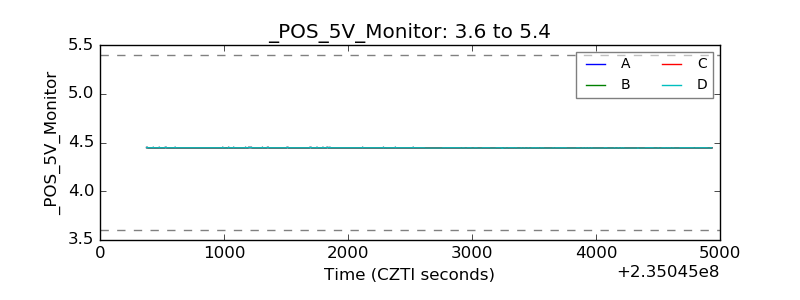 |
| _ROLL_ROT | 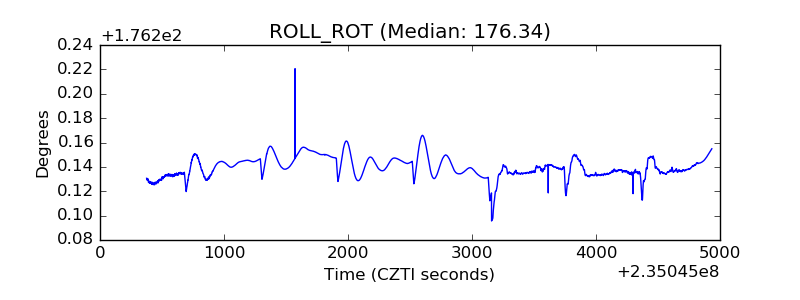 |
| _Roll_DEC | 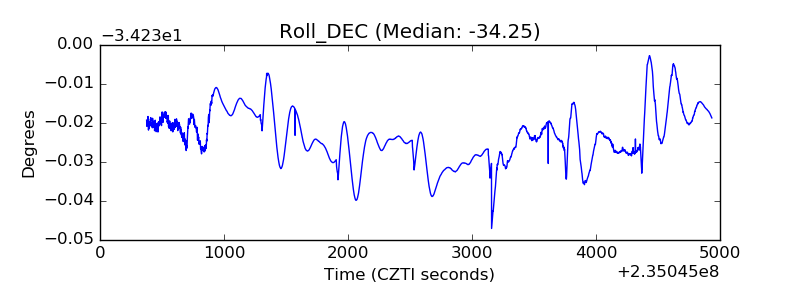 |
| _Roll_RA | 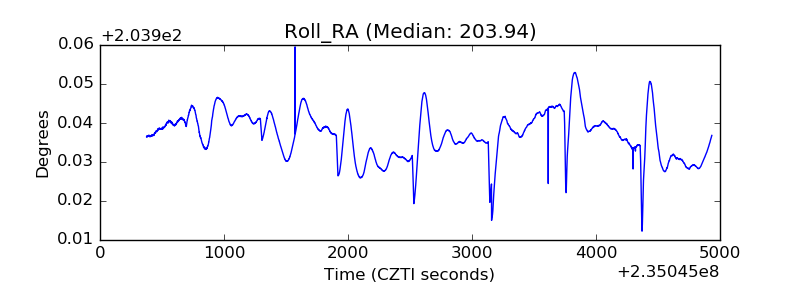 |
| Veto Counter | 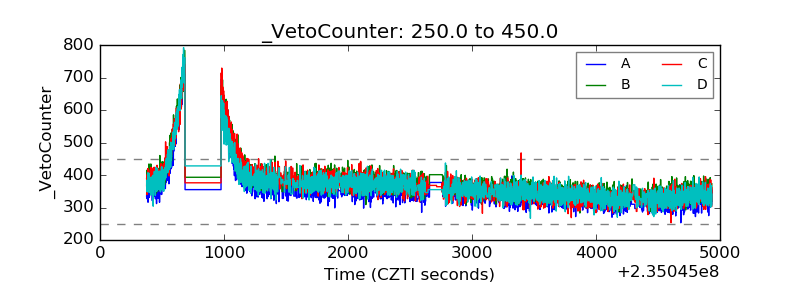 |