| Param | Original file | Final file |
|---|---|---|
| Filename | modeM0/AS1A03_051T01_9000001288_09243cztM0_level2.evt | modeM0/AS1A03_051T01_9000001288_09243cztM0_level2_quad_clean.evt |
| Size (bytes) | 1,045,969,920 | 177,750,720 |
| Size | 997.5 MB | 169.5 MB |
| Events in quadrant A | 8,836,820 | 1,105,144 |
| Events in quadrant B | 8,146,612 | 1,104,650 |
| Events in quadrant C | 6,414,095 | 1,108,471 |
| Events in quadrant D | 7,313,832 | 1,080,130 |
| Mode SS | |||
|---|---|---|---|
| Quadrant | BADHDUFLAG | Total packets | Discarded packets |
| A | 0 | 310 | 26 |
| B | 0 | 310 | 18 |
| C | 0 | 310 | 28 |
| D | 0 | 310 | 22 |
| Mode M0 | |||
|---|---|---|---|
| Quadrant | BADHDUFLAG | Total packets | Discarded packets |
| A | 0 | 39023 | 3519 |
| B | 0 | 36105 | 2470 |
| C | 0 | 31574 | 2253 |
| D | 0 | 34462 | 2900 |
| Mode M9 | |||
|---|---|---|---|
| Quadrant | BADHDUFLAG | Total packets | Discarded packets |
| A | 0 | 3 | 0 |
| B | 0 | 3 | 0 |
| C | 0 | 3 | 0 |
| D | 0 | 3 | 0 |
| Quadrant | Total seconds | Saturated seconds | Saturation percentage |
|---|---|---|---|
| A | 14143 | 531 | 3.754508% |
| B | 14328 | 918 | 6.407035% |
| C | 14296 | 345 | 2.413262% |
| D | 14217 | 426 | 2.996413% |
Noise dominated data is calculated using 1-second bins in cleaned event files. If a bin has >2000 counts, and if more than 50% of those come from <1% of pixels, then it is considered to be noise-dominated and hence unusable.
| Quadrant | # 1 sec bins | Bins with >0 counts | Bins with >2000 counts | High rate bins dominated by noise | Noise dominated (total time) | Noise dominated (detector-on time) | Marked lightcurve |
|---|---|---|---|---|---|---|---|
| A | 15722 | 14959 | 62 | 62 | 0.39% | 0.41% | 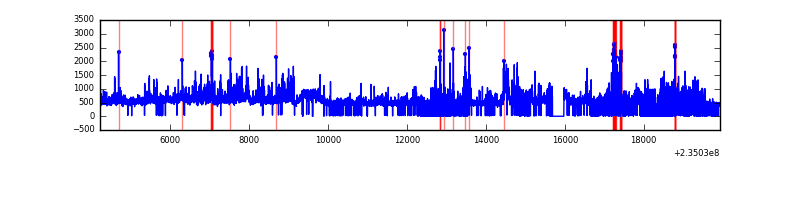 |
| B | 15722 | 15070 | 445 | 445 | 2.83% | 2.95% | 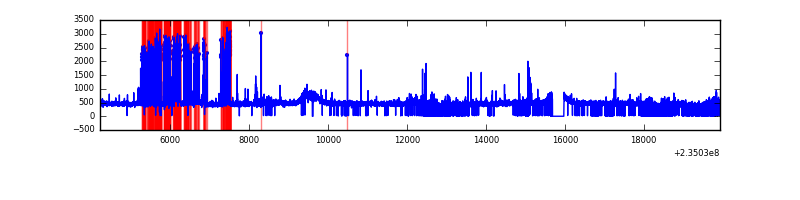 |
| C | 15722 | 15056 | 0 | 0 | 0.00% | 0.00% | 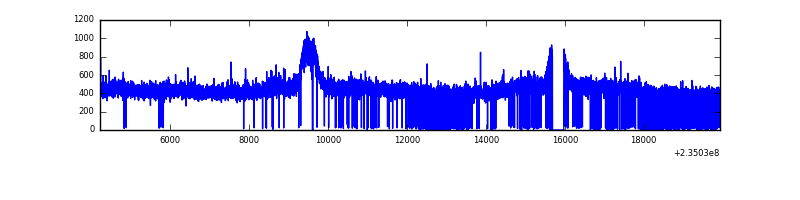 |
| D | 15722 | 15024 | 62 | 62 | 0.39% | 0.41% | 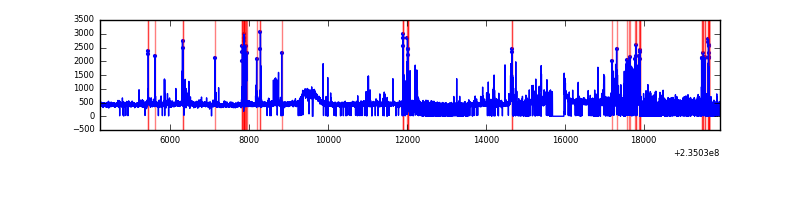 |
Top three noisy pixels from each quadrant. If the there are fewer than three noisy pixels in the level2.evt file, extra rows are filled as -1
| Pixel properties | Quadrant properties | ||||||
|---|---|---|---|---|---|---|---|
| Quadrant | DetID | PixID | Counts | Sigma | Mean | Median | Sigma |
| A | 8 | 5 | 2167007 | 6363.74 | 1668 | 1628 | 340.3 |
| A | 5 | 16 | 114861 | 332.78 | 1668 | 1628 | 340.3 |
| A | 1 | 162 | 51583 | 146.81 | 1668 | 1628 | 340.3 |
| B | 6 | 51 | 1319320 | 4096.24 | 1673 | 1630 | 321.7 |
| B | 0 | 214 | 103554 | 316.85 | 1673 | 1630 | 321.7 |
| B | 4 | 48 | 46651 | 139.95 | 1673 | 1630 | 321.7 |
| C | 13 | 61 | 12531 | 28.74 | 1638 | 1641 | 378.9 |
| C | 8 | 222 | 12291 | 28.11 | 1638 | 1641 | 378.9 |
| C | 9 | 68 | 6451 | 12.69 | 1638 | 1641 | 378.9 |
| D | 1 | 52 | 695770 | 1617.55 | 1622 | 1582 | 429.2 |
| D | 7 | 71 | 234114 | 541.83 | 1622 | 1582 | 429.2 |
| D | 12 | 233 | 79137 | 180.71 | 1622 | 1582 | 429.2 |
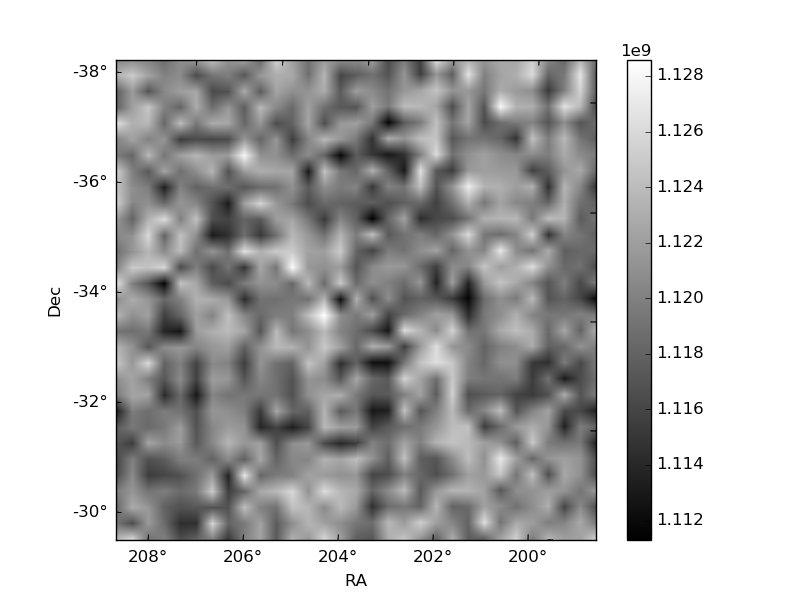
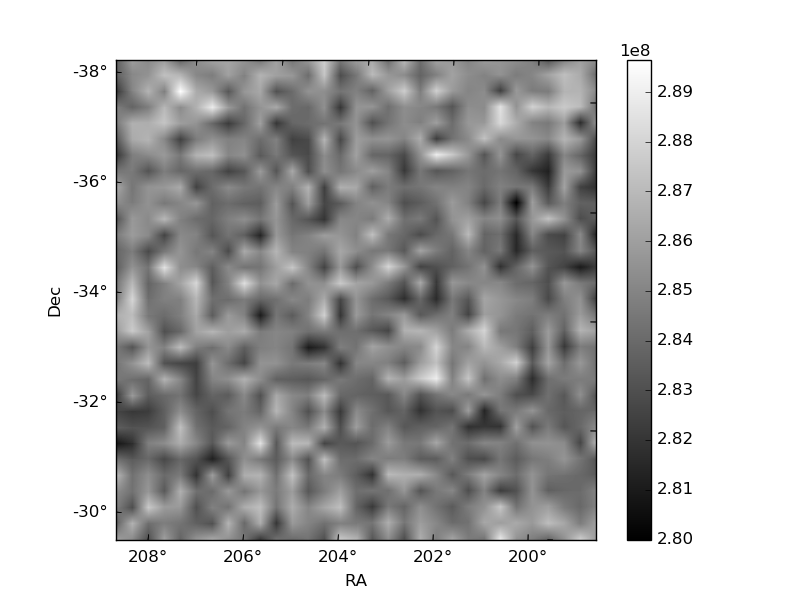
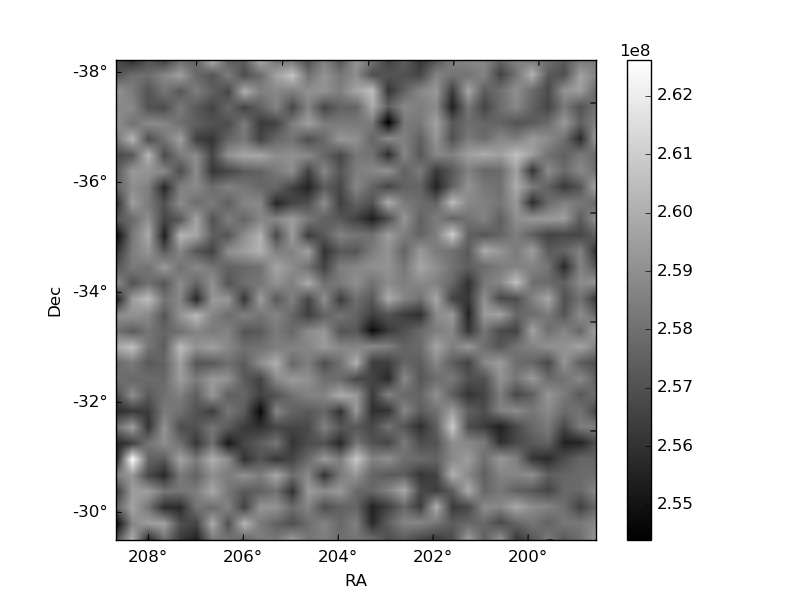
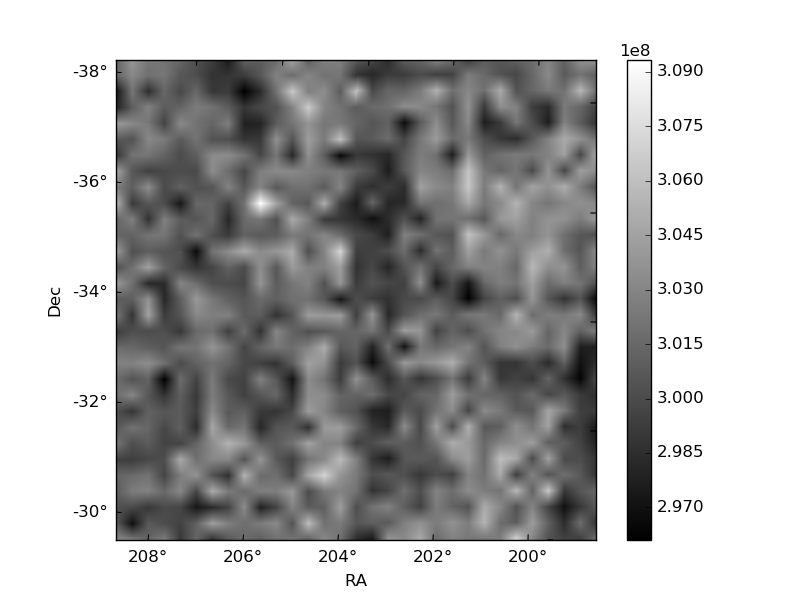
Histogram calculated using DETX and DETY for each event in the final _common_clean file
| Quadrant A | 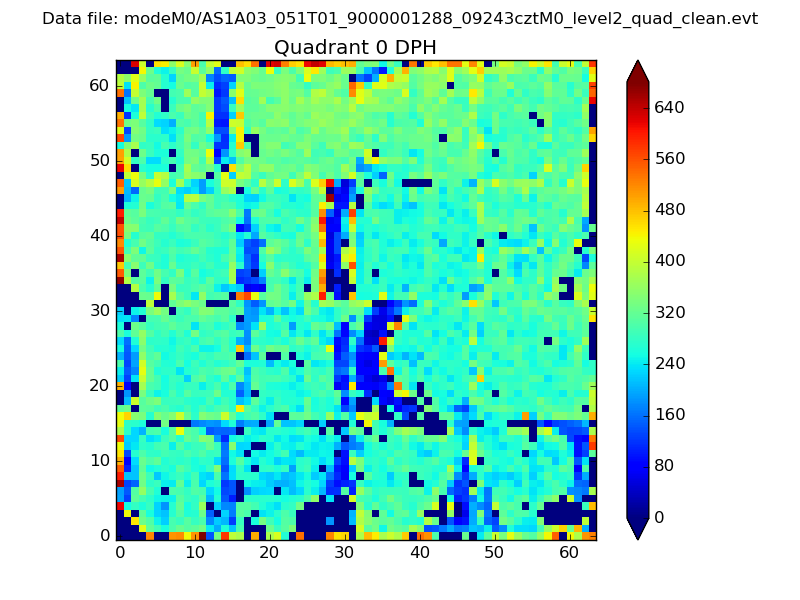 |
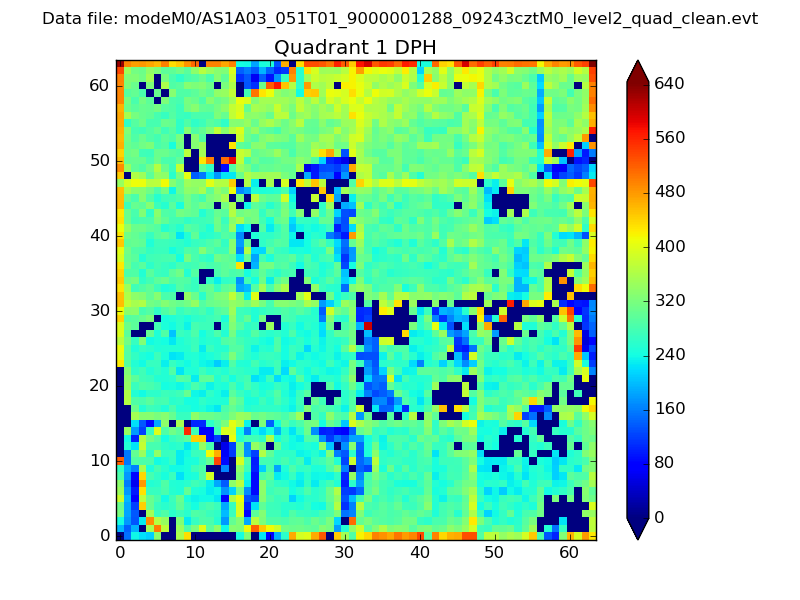 |
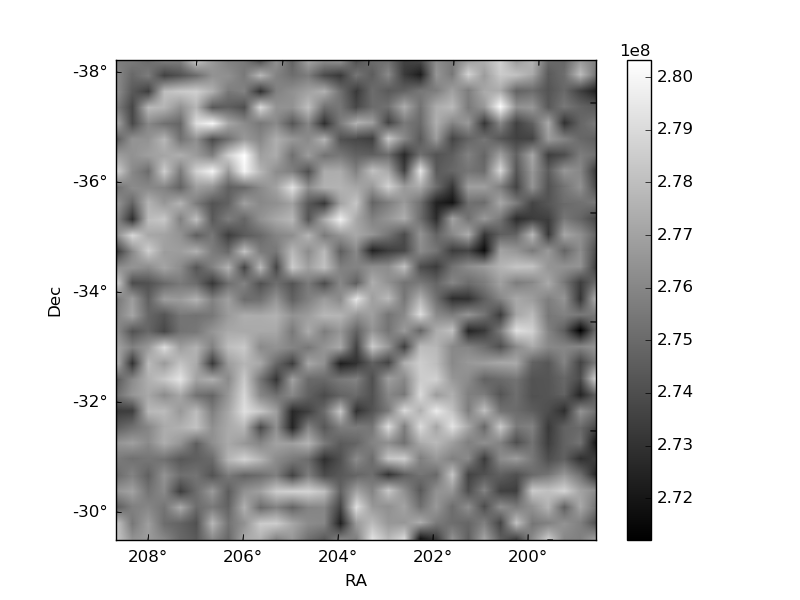
Quadrant B |
|---|---|---|---|
| Quadrant D | 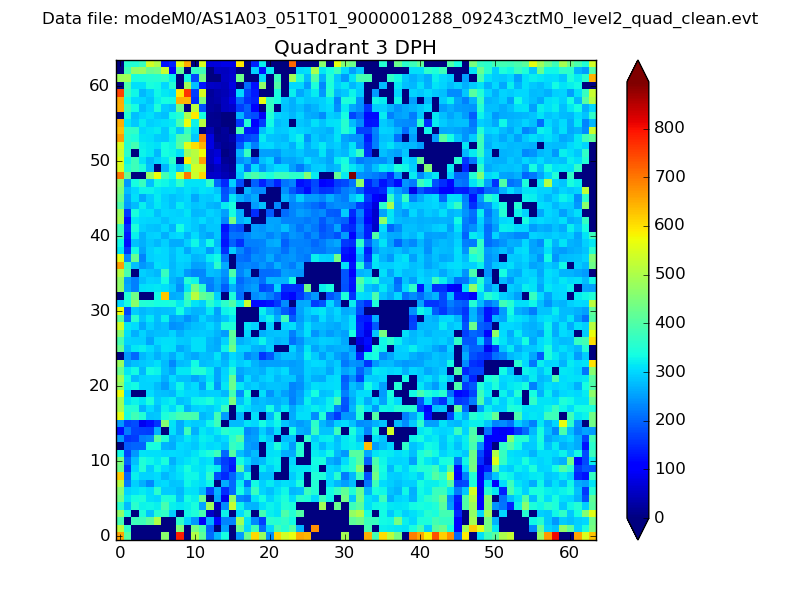 |
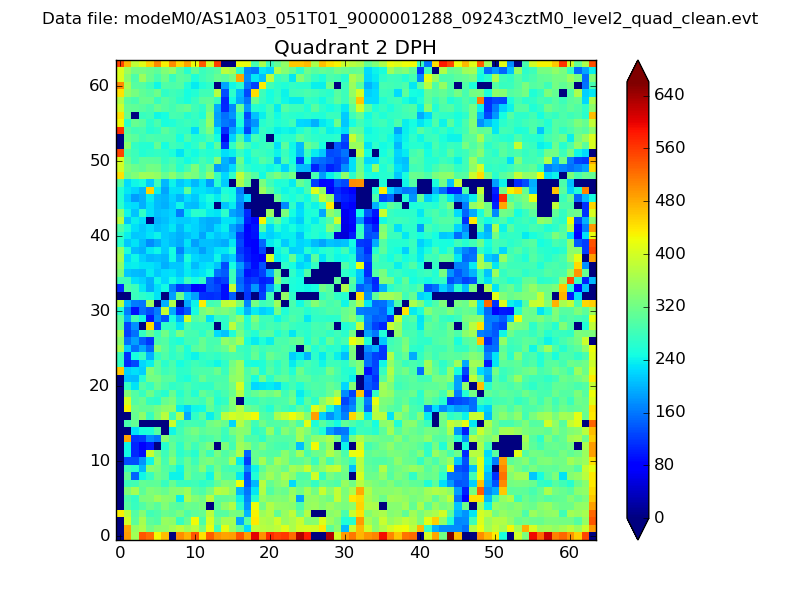 |
Quadrant C |
| Plot type | Count rate plots | Images |
|---|---|---|
| Comparison with Poisson distribution Blue bars denote a histogram of data divided into 1 sec bins. Red curve is a Poisson curve with rate = median count rate of data. |
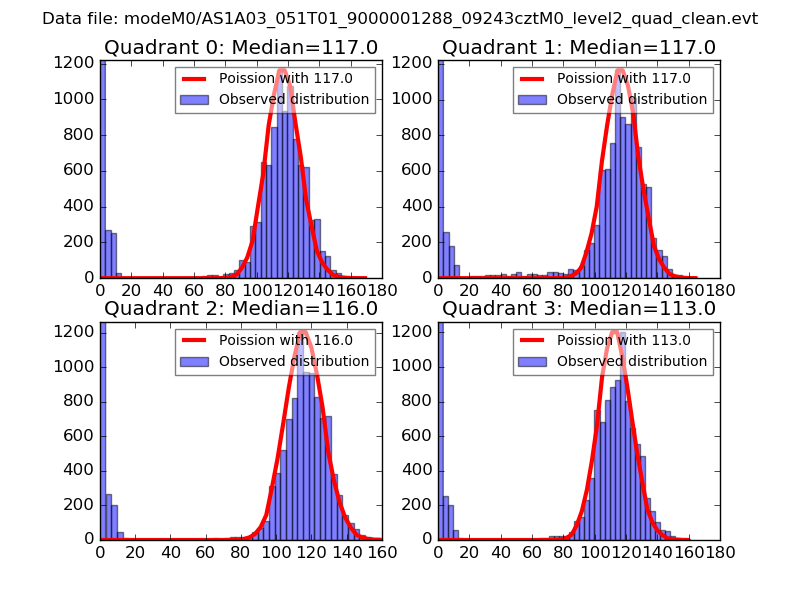 |
 |
| Quadrant-wise count rates Data is divided into 100 sec bins |
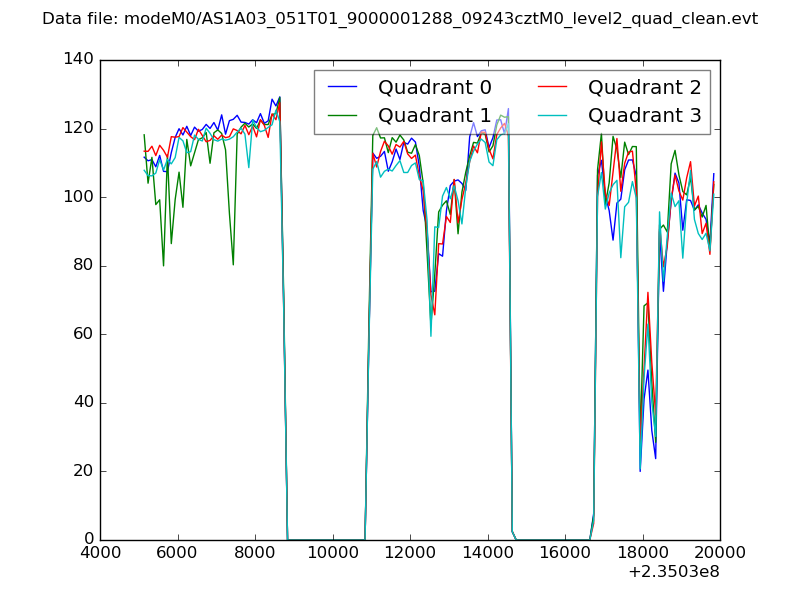 |
|
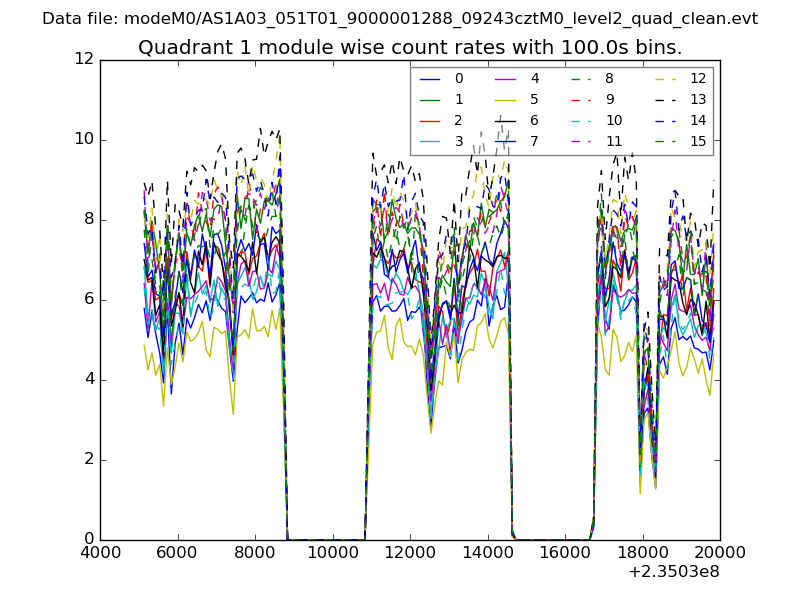
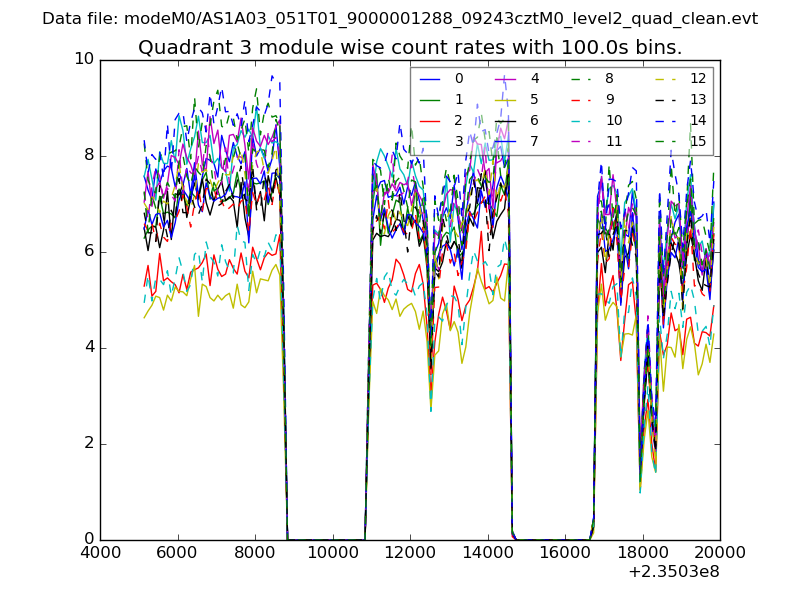
| Module-wise count rates for Quadrant A Data is divided into 100 sec bins |
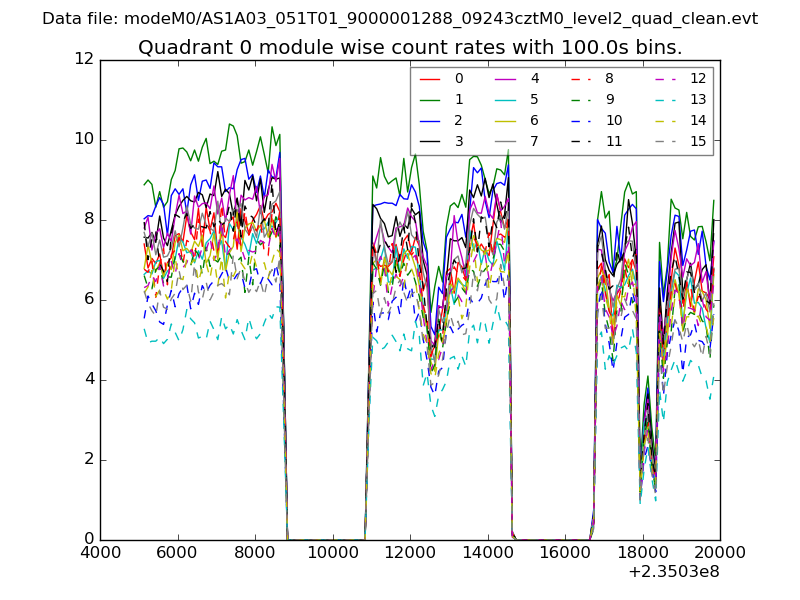 |
 |
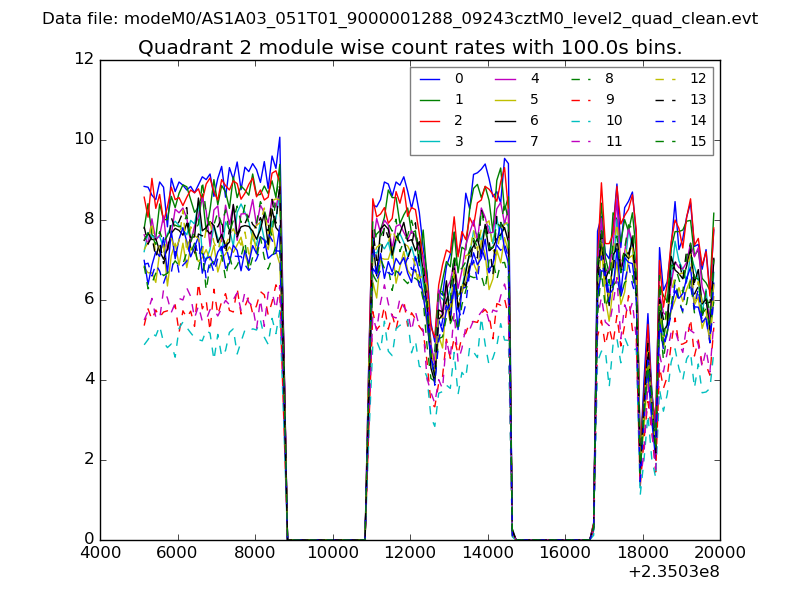
| Module-wise count rates for Quadrant B Data is divided into 100 sec bins |
 |
 |
| Module-wise count rates for Quadrant C Data is divided into 100 sec bins |
 |
 |
| Module-wise count rates for Quadrant D Data is divided into 100 sec bins |
 |
 |
| Parameter | Plot |
|---|---|
| CZT HV Monitor | 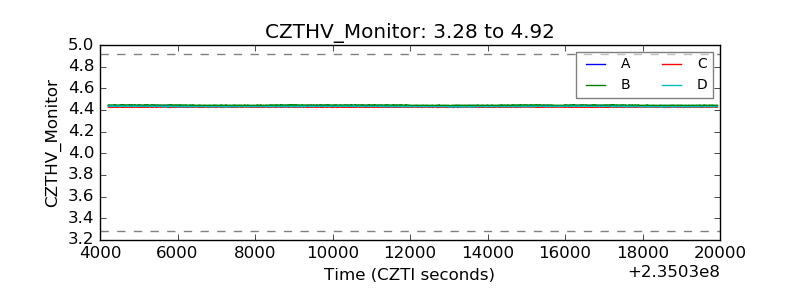 |
| D_VDD |  |
| Temperature 1 | 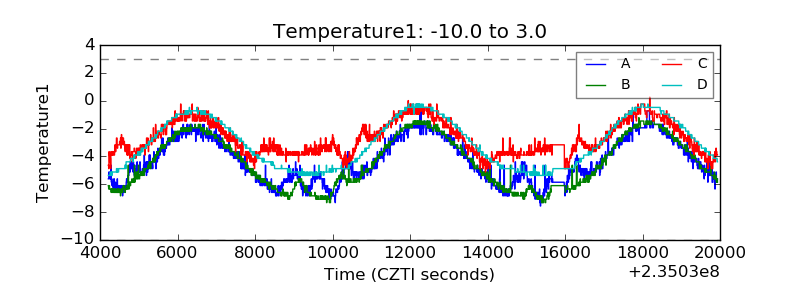 |
| Veto HV Monitor |  |
| Veto LLD | 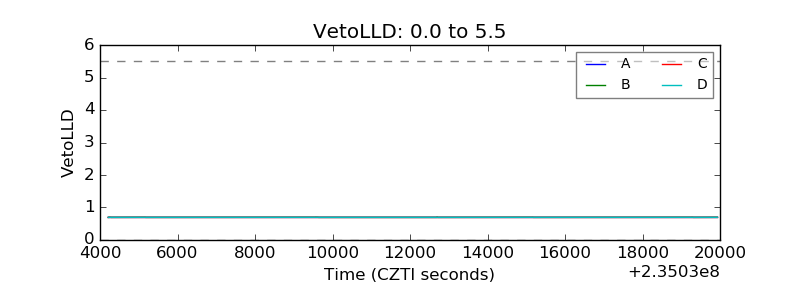 |
| Alpha Counter | 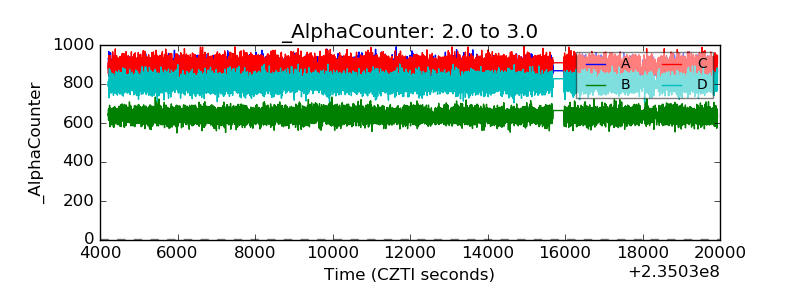 |
| _CPM_Rate | 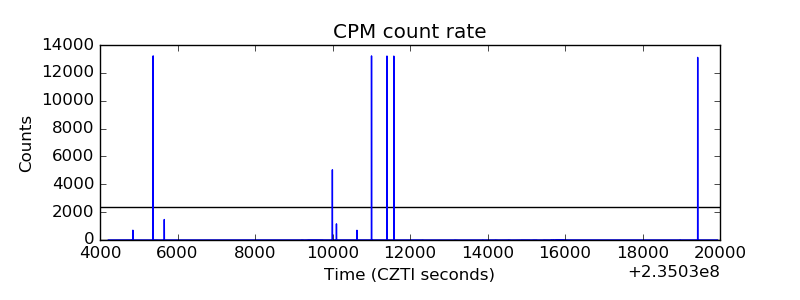 |
| CZT Counter | 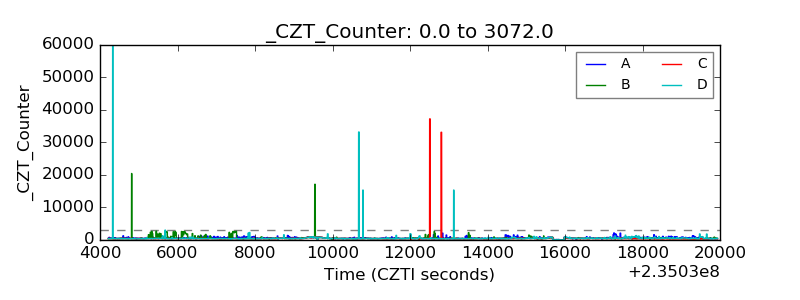 |
| +2.5 Volts monitor |  |
| +5 Volts monitor |  |
| _ROLL_ROT | 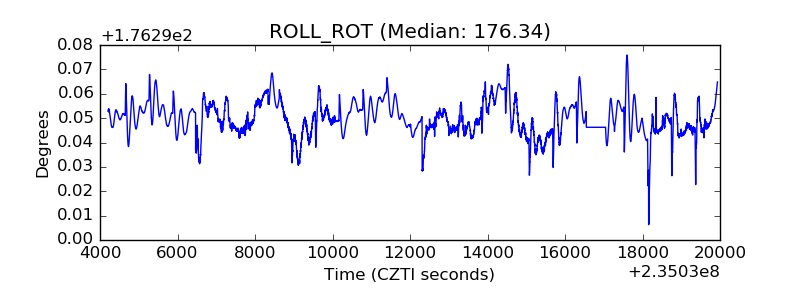 |
| _Roll_DEC | 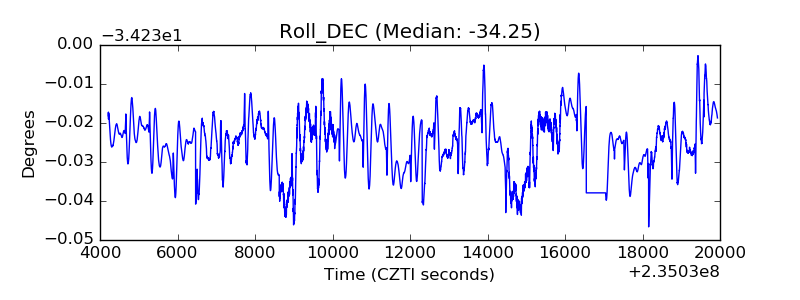 |
| _Roll_RA |  |
| Veto Counter | 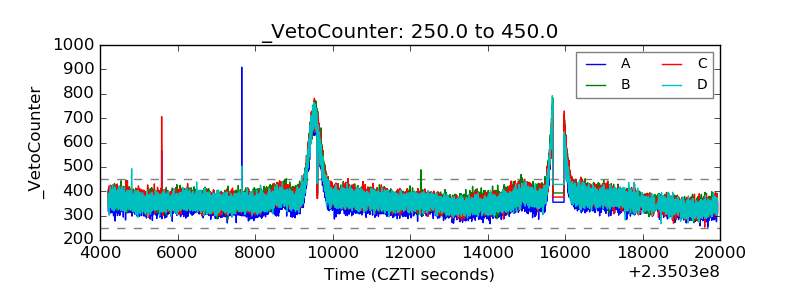 |