| Param | Original file | Final file |
|---|---|---|
| Filename | modeM0/AS1A03_091T02_9000001292cztM0_level2.fits | modeM0/AS1A03_091T02_9000001292cztM0_level2_quad_clean.evt |
| Size (bytes) | 31,688,640 | 37,609,920 |
| Size | 30.2 MB | 35.9 MB |
| Events in quadrant A | 186,050 | 232,454 |
| Events in quadrant B | 181,066 | 233,969 |
| Events in quadrant C | 182,588 | 218,551 |
| Events in quadrant D | 161,554 | 204,617 |
| Mode M0 | |||
|---|---|---|---|
| Quadrant | BADHDUFLAG | Total packets | Discarded packets |
| A | 0 | 7344 | 0 |
| B | 0 | 7195 | 0 |
| C | 0 | 7055 | 0 |
| D | 0 | 7223 | 0 |
| Mode M9 | |||
|---|---|---|---|
| Quadrant | BADHDUFLAG | Total packets | Discarded packets |
| A | 0 | 47 | 0 |
| B | 0 | 46 | 0 |
| C | 0 | 47 | 0 |
| D | 0 | 47 | 0 |
| Mode SS | |||
|---|---|---|---|
| Quadrant | BADHDUFLAG | Total packets | Discarded packets |
| A | 0 | 70 | 0 |
| B | 0 | 70 | 0 |
| C | 0 | 70 | 0 |
| D | 0 | 70 | 0 |
| Quadrant | Total seconds | Saturated seconds | Saturation percentage |
|---|---|---|---|
| A | 3509 | 8 | 0.227985% |
| B | 3509 | 4 | 0.113993% |
| C | 3509 | 2 | 0.056996% |
| D | 3509 | 10 | 0.284981% |
Noise dominated data is calculated using 1-second bins in cleaned event files. If a bin has >2000 counts, and if more than 50% of those come from <1% of pixels, then it is considered to be noise-dominated and hence unusable.
| Quadrant | # 1 sec bins | Bins with >0 counts | Bins with >2000 counts | High rate bins dominated by noise | Noise dominated (total time) | Noise dominated (detector-on time) | Marked lightcurve |
|---|---|---|---|---|---|---|---|
| A | 3508 | 3508 | 0 | 0 | 0.00% | 0.00% |  |
| B | 3509 | 3509 | 0 | 0 | 0.00% | 0.00% |  |
| C | 3509 | 3509 | 0 | 0 | 0.00% | 0.00% |  |
| D | 3508 | 3508 | 0 | 0 | 0.00% | 0.00% |  |
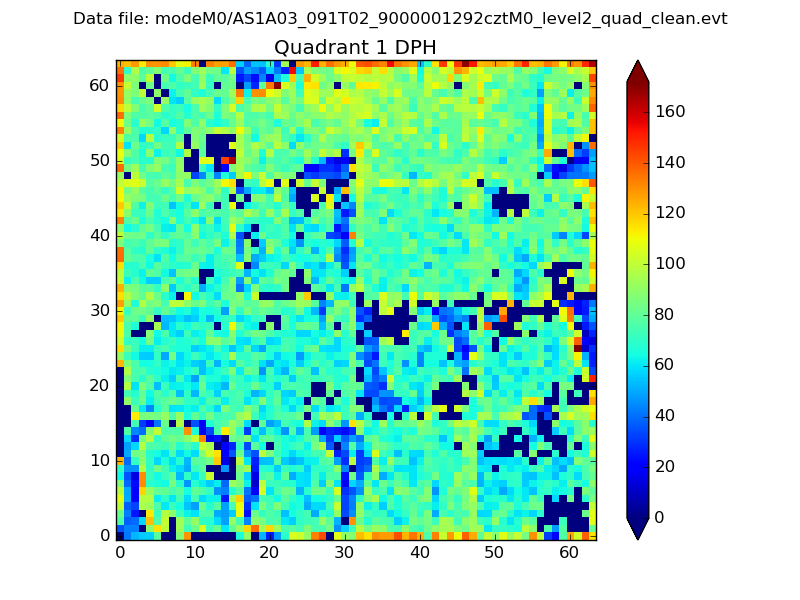
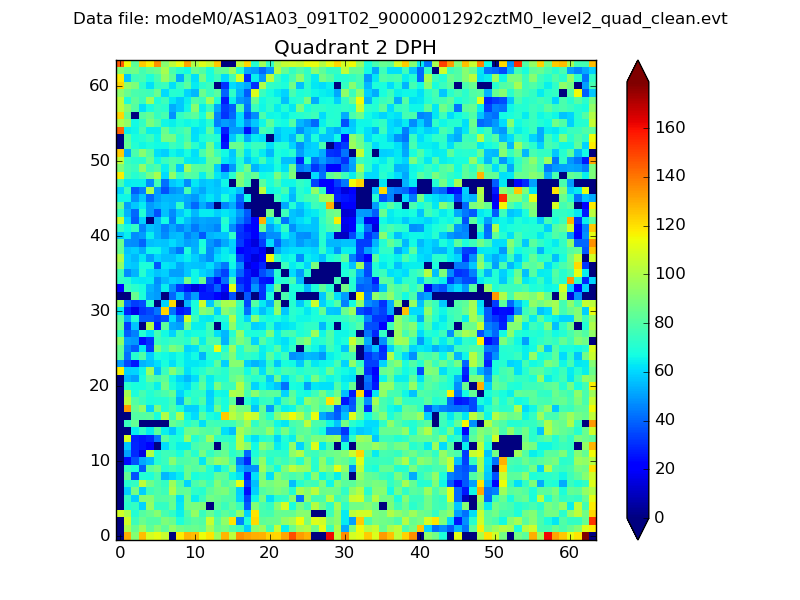
Top three noisy pixels from each quadrant. If the there are fewer than three noisy pixels in the level2.evt file, extra rows are filled as -1
| Pixel properties | Quadrant properties | ||||||
|---|---|---|---|---|---|---|---|
| Quadrant | DetID | PixID | Counts | Sigma | Mean | Median | Sigma |
| A | 0 | 29 | 174 | 8.96 | 48 | 45 | 14.4 |
| A | 7 | 110 | 150 | 7.29 | 48 | 45 | 14.4 |
| A | 9 | 19 | 145 | 6.94 | 48 | 45 | 14.4 |
| B | 2 | 9 | 164 | 9.93 | 47 | 45 | 12.0 |
| B | 5 | 252 | 133 | 7.34 | 47 | 45 | 12.0 |
| B | 3 | 17 | 129 | 7.01 | 47 | 45 | 12.0 |
| C | 12 | 241 | 141 | 6.66 | 48 | 45 | 14.4 |
| C | 9 | 242 | 137 | 6.38 | 48 | 45 | 14.4 |
| C | 1 | 65 | 135 | 6.24 | 48 | 45 | 14.4 |
| D | 15 | 47 | 131 | 6.29 | 45 | 41 | 14.3 |
| D | 3 | 31 | 124 | 5.8 | 45 | 41 | 14.3 |
| D | 4 | 12 | 123 | 5.73 | 45 | 41 | 14.3 |
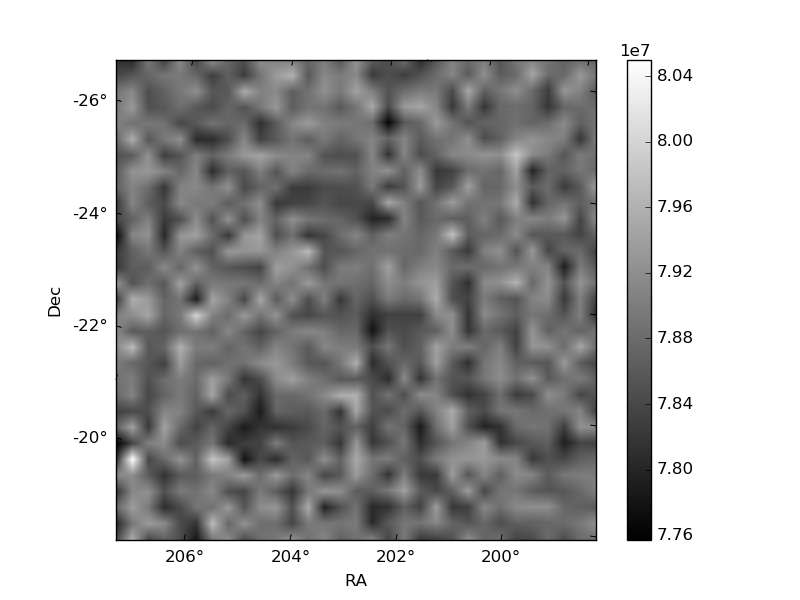
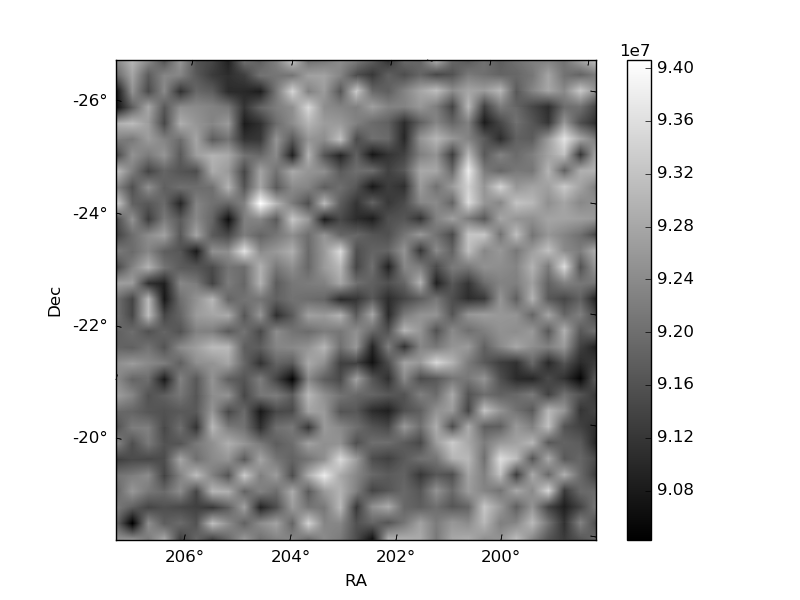
Histogram calculated using DETX and DETY for each event in the final _common_clean file
| Quadrant A | 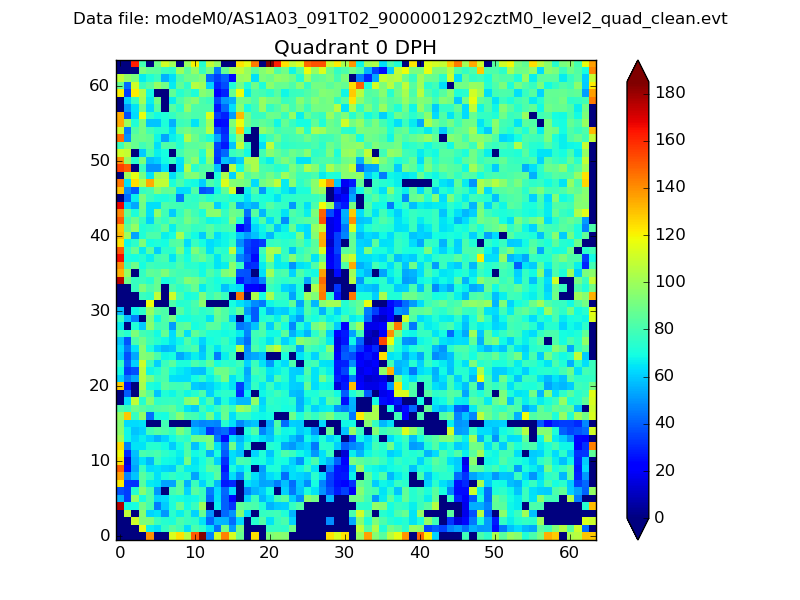 |
 |
Quadrant B |
|---|---|---|---|
| Quadrant D | 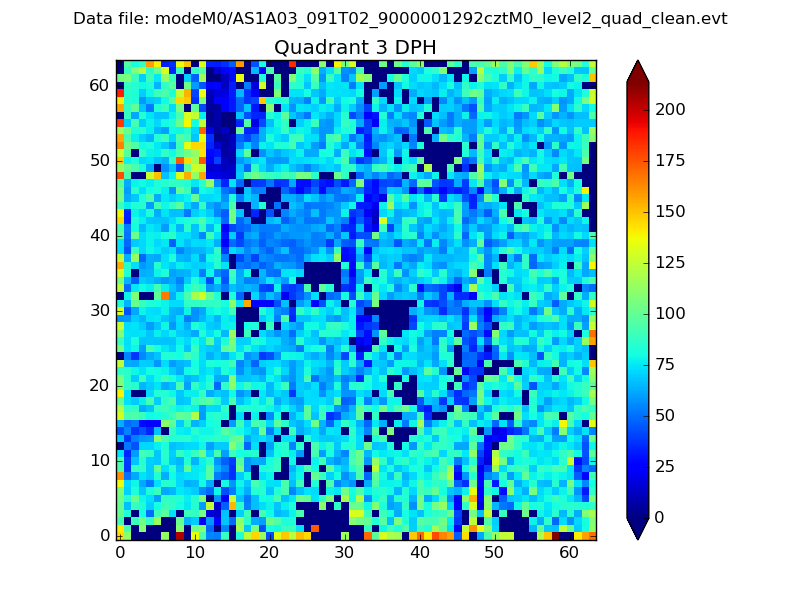 |
 |
Quadrant C |
| Plot type | Count rate plots | Images |
|---|---|---|
| Comparison with Poisson distribution Blue bars denote a histogram of data divided into 1 sec bins. Red curve is a Poisson curve with rate = median count rate of data. |
 |
 |
| Quadrant-wise count rates Data is divided into 100 sec bins |
 |
|
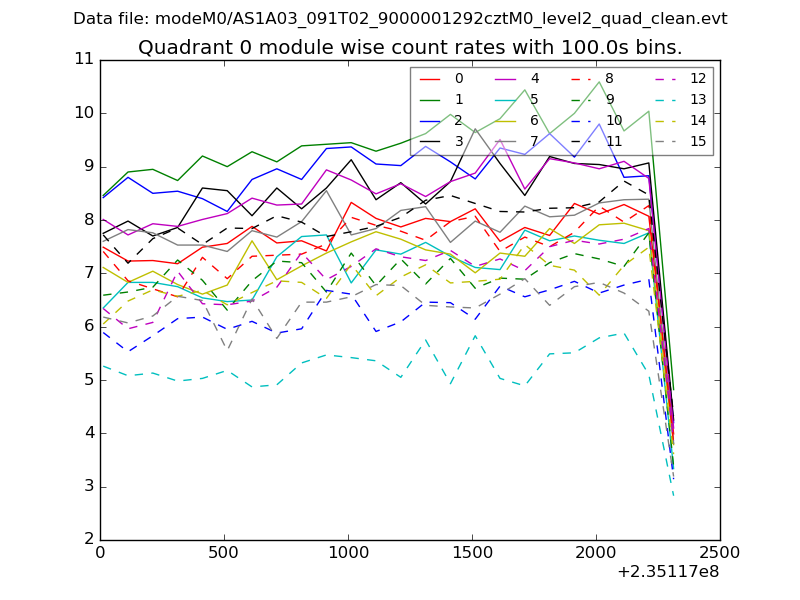
| Module-wise count rates for Quadrant A Data is divided into 100 sec bins |
 |
 |
| Module-wise count rates for Quadrant B Data is divided into 100 sec bins |
 |
 |
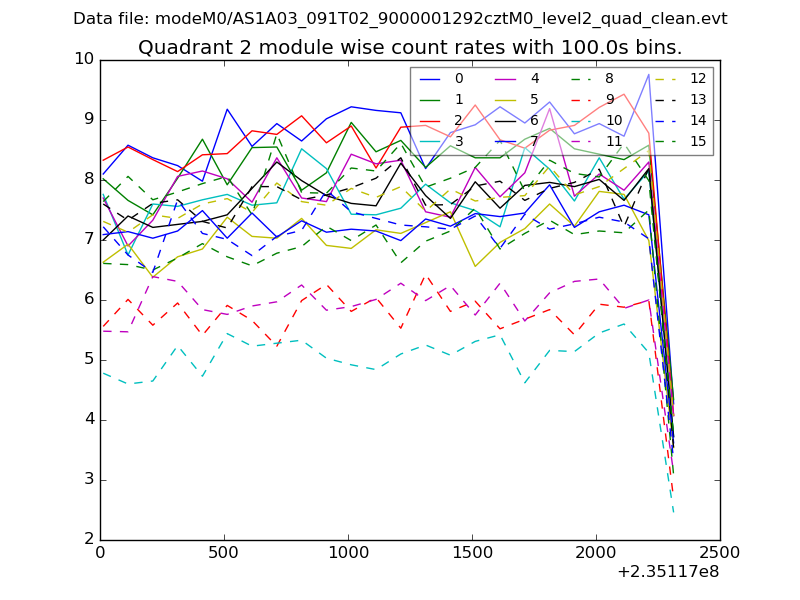
| Module-wise count rates for Quadrant C Data is divided into 100 sec bins |
 |
 |
| Module-wise count rates for Quadrant D Data is divided into 100 sec bins |
 |
 |
| Parameter | Plot |
|---|---|
| CZT HV Monitor | 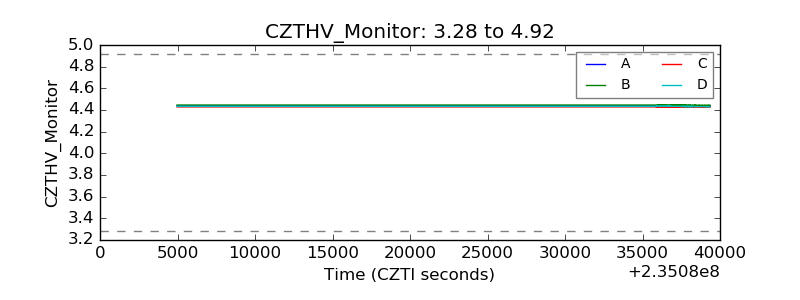 |
| D_VDD | 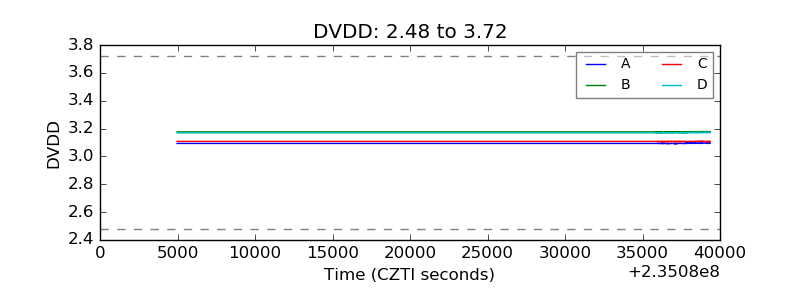 |
| Temperature 1 |  |
| Veto HV Monitor |  |
| Veto LLD | 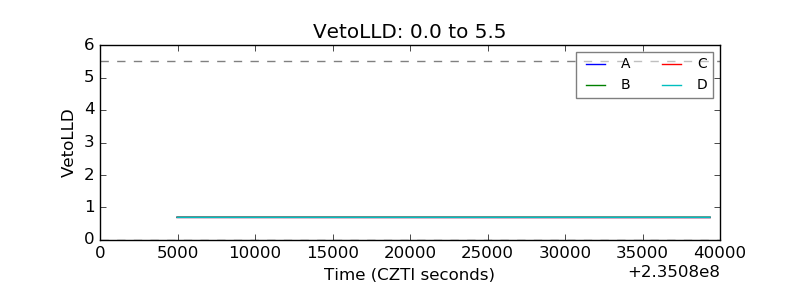 |
| Alpha Counter |  |
| _CPM_Rate |  |
| CZT Counter |  |
| +2.5 Volts monitor | 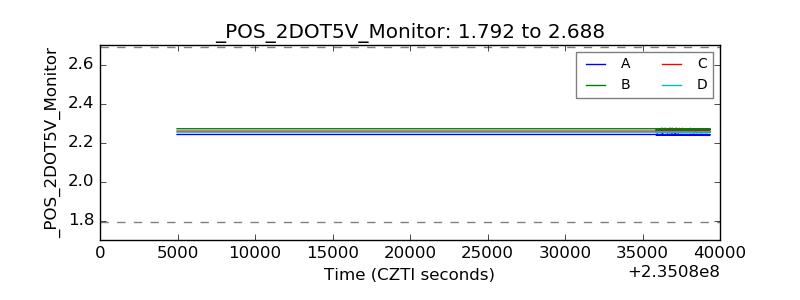 |
| +5 Volts monitor | 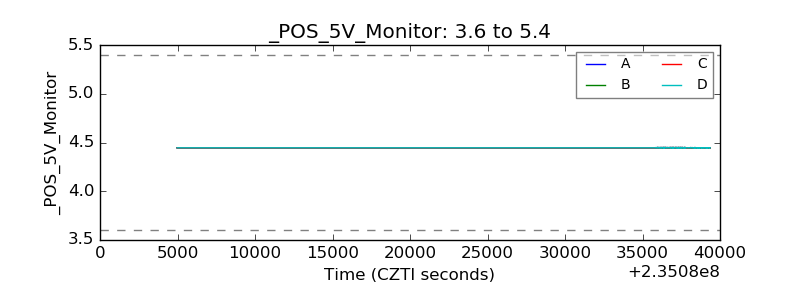 |
| _ROLL_ROT |  |
| _Roll_DEC | 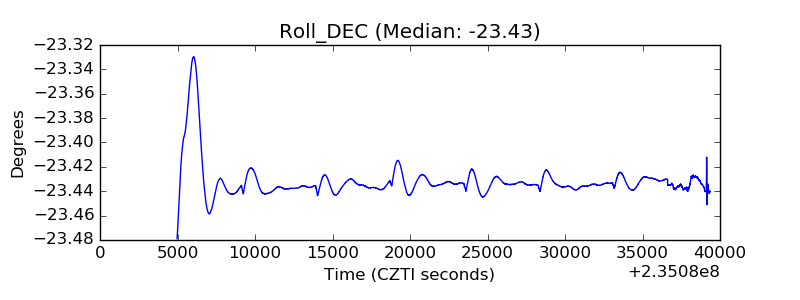 |
| _Roll_RA | 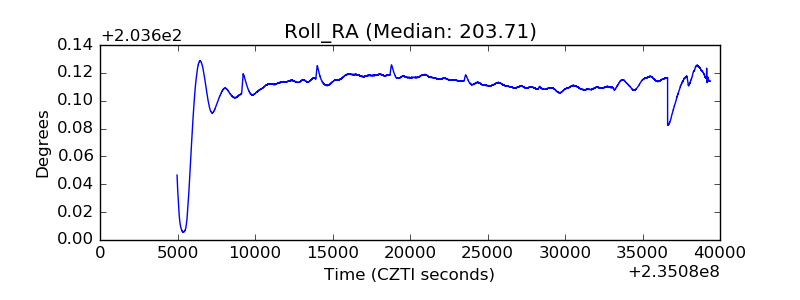 |
| Veto Counter | 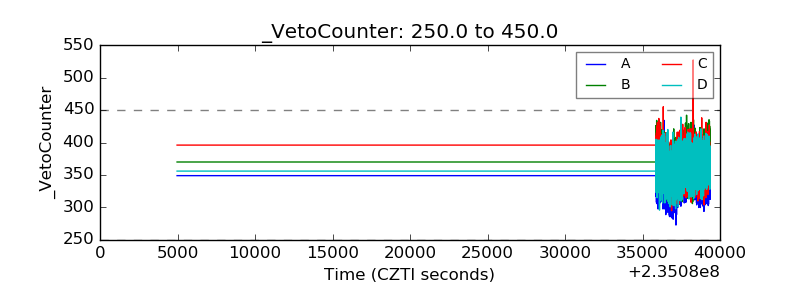 |