| Param | Original file | Final file |
|---|---|---|
| Filename | modeM0/AS1A03_091T02_9000001292_09247cztM0_level2.evt | modeM0/AS1A03_091T02_9000001292_09247cztM0_level2_quad_clean.evt |
| Size (bytes) | 5,486,400 | 1,607,040 |
| Size | 5.2 MB | 1.5 MB |
| Events in quadrant A | 46,282 | 8,850 |
| Events in quadrant B | 36,275 | 8,938 |
| Events in quadrant C | 35,385 | 8,295 |
| Events in quadrant D | 39,602 | 8,399 |
| Mode M0 | |||
|---|---|---|---|
| Quadrant | BADHDUFLAG | Total packets | Discarded packets |
| A | 0 | 194 | 1 |
| B | 0 | 147 | 0 |
| C | 0 | 157 | 5 |
| D | 0 | 167 | 0 |
| Mode SS | |||
|---|---|---|---|
| Quadrant | BADHDUFLAG | Total packets | Discarded packets |
| A | 0 | 2 | 0 |
| B | 0 | 2 | 0 |
| C | 0 | 2 | 0 |
| D | 0 | 2 | 0 |
| Quadrant | Total seconds | Saturated seconds | Saturation percentage |
|---|---|---|---|
| A | 68 | 0 | 0.000000% |
| B | 68 | 0 | 0.000000% |
| C | 67 | 0 | 0.000000% |
| D | 68 | 0 | 0.000000% |
Noise dominated data is calculated using 1-second bins in cleaned event files. If a bin has >2000 counts, and if more than 50% of those come from <1% of pixels, then it is considered to be noise-dominated and hence unusable.
| Quadrant | # 1 sec bins | Bins with >0 counts | Bins with >2000 counts | High rate bins dominated by noise | Noise dominated (total time) | Noise dominated (detector-on time) | Marked lightcurve |
|---|---|---|---|---|---|---|---|
| A | 68 | 68 | 0 | 0 | 0.00% | 0.00% | 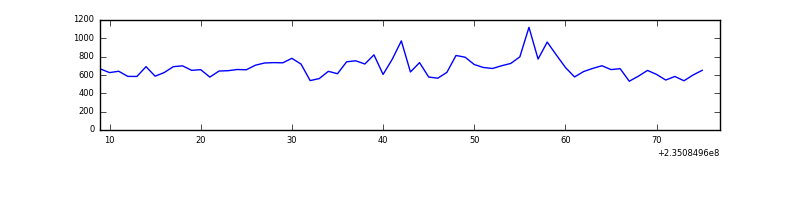 |
| B | 68 | 68 | 0 | 0 | 0.00% | 0.00% |  |
| C | 68 | 68 | 0 | 0 | 0.00% | 0.00% |  |
| D | 68 | 68 | 0 | 0 | 0.00% | 0.00% |  |
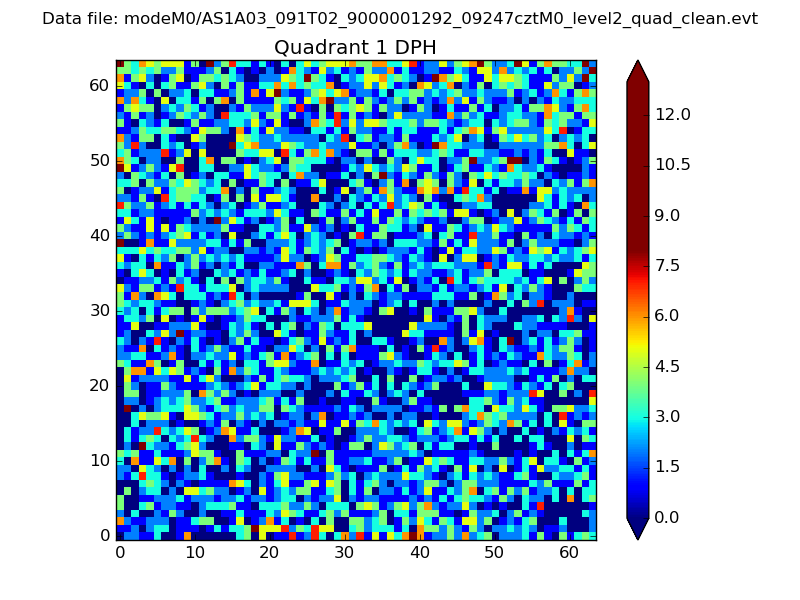
Top three noisy pixels from each quadrant. If the there are fewer than three noisy pixels in the level2.evt file, extra rows are filled as -1
| Pixel properties | Quadrant properties | ||||||
|---|---|---|---|---|---|---|---|
| Quadrant | DetID | PixID | Counts | Sigma | Mean | Median | Sigma |
| A | 8 | 5 | 14979 | 4562.4 | 7 | 7 | 3.3 |
| A | 13 | 251 | 187 | 54.85 | 7 | 7 | 3.3 |
| A | 12 | 194 | 72 | 19.81 | 7 | 7 | 3.3 |
| B | 0 | 214 | 2579 | 788.13 | 7 | 7 | 3.3 |
| B | 0 | 219 | 1681 | 512.96 | 7 | 7 | 3.3 |
| B | 0 | 245 | 463 | 139.73 | 7 | 7 | 3.3 |
| C | 14 | 234 | 6197 | 1909.15 | 7 | 7 | 3.2 |
| C | 13 | 61 | 71 | 19.74 | 7 | 7 | 3.2 |
| C | 14 | 67 | 61 | 16.65 | 7 | 7 | 3.2 |
| D | 1 | 52 | 10643 | 3115.44 | 7 | 7 | 3.4 |
| D | 2 | 234 | 311 | 89.05 | 7 | 7 | 3.4 |
| D | 7 | 207 | 251 | 71.47 | 7 | 7 | 3.4 |
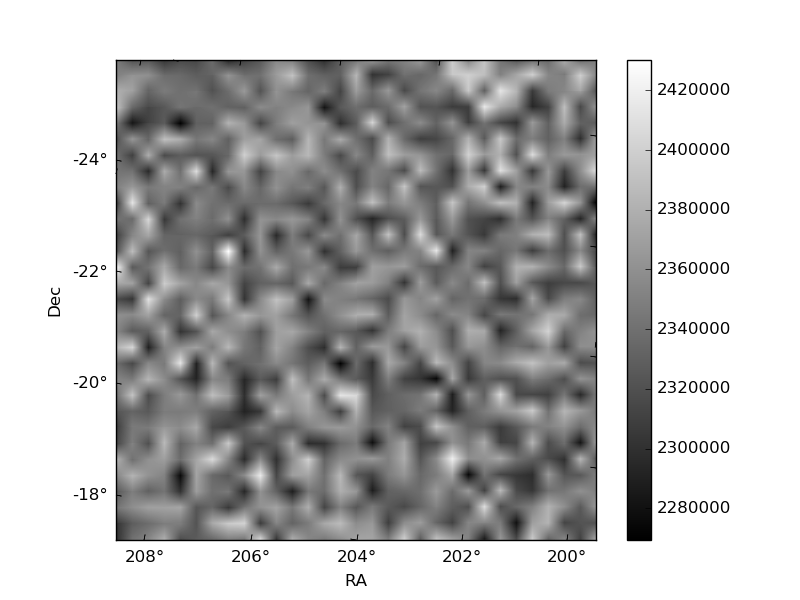
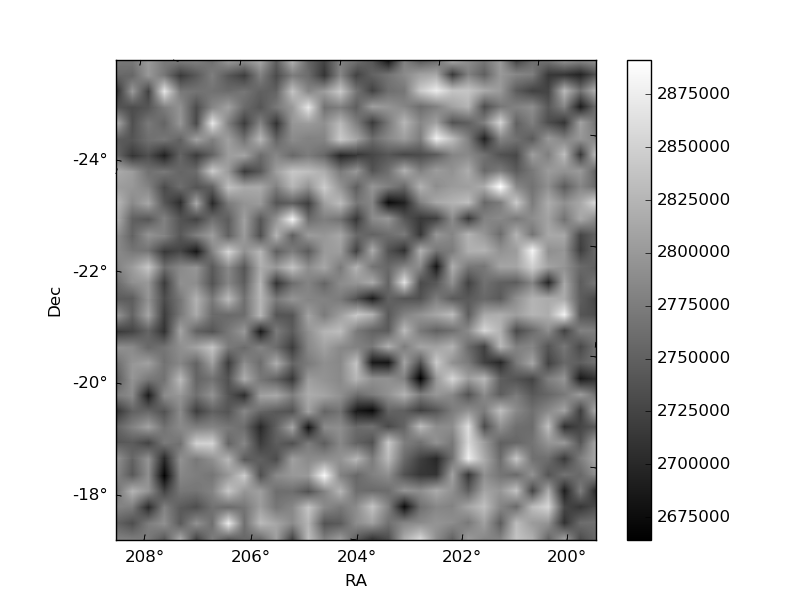
Histogram calculated using DETX and DETY for each event in the final _common_clean file
| Quadrant A | 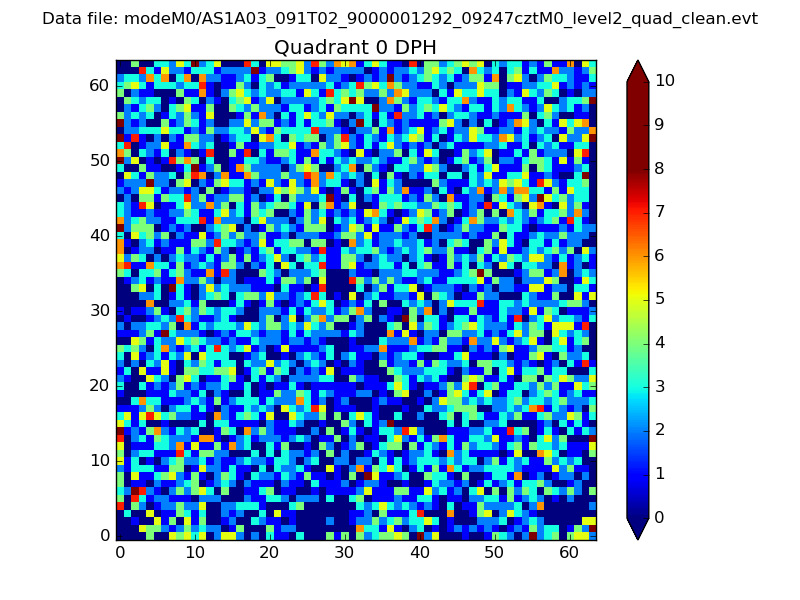 |
 |
Quadrant B |
|---|---|---|---|
| Quadrant D | 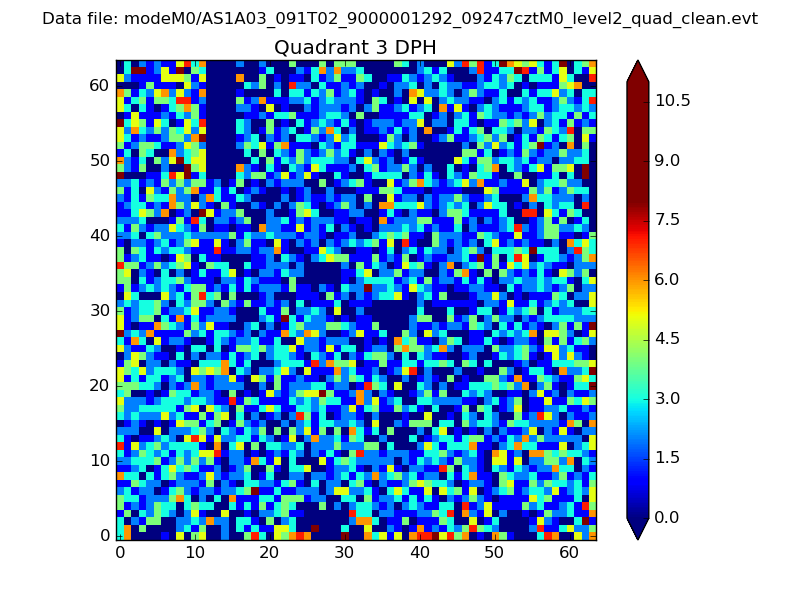 |
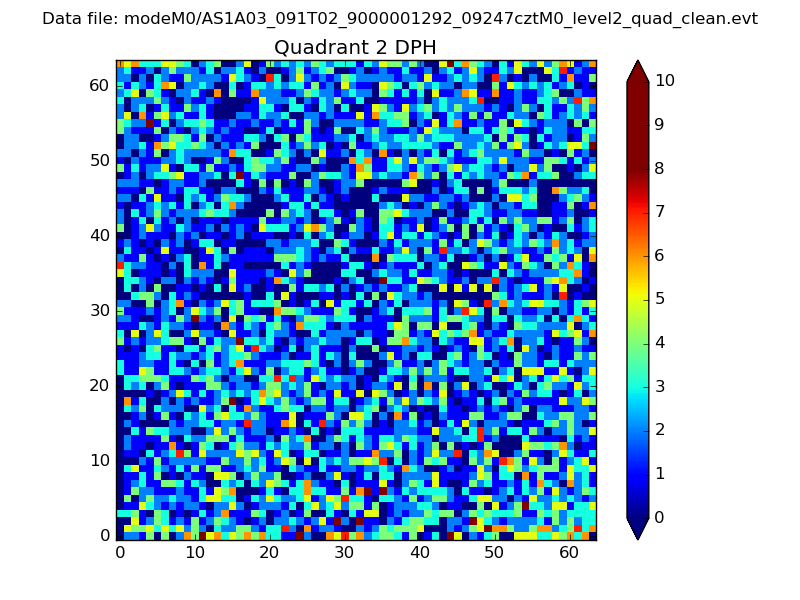 |
Quadrant C |
| Plot type | Count rate plots | Images |
|---|---|---|
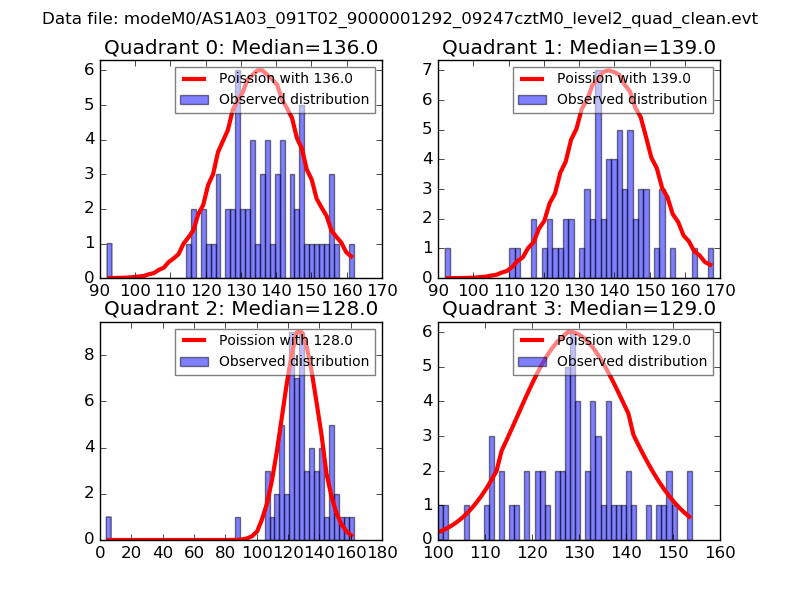
| Comparison with Poisson distribution Blue bars denote a histogram of data divided into 1 sec bins. Red curve is a Poisson curve with rate = median count rate of data. |
 |
 |
| Quadrant-wise count rates Data is divided into 100 sec bins |
 |
|
| Module-wise count rates for Quadrant A Data is divided into 100 sec bins |
 |
 |
| Module-wise count rates for Quadrant B Data is divided into 100 sec bins |
 |
 |
| Module-wise count rates for Quadrant C Data is divided into 100 sec bins |
 |
 |
| Module-wise count rates for Quadrant D Data is divided into 100 sec bins |
 |
 |
| Parameter | Plot |
|---|---|
| CZT HV Monitor | 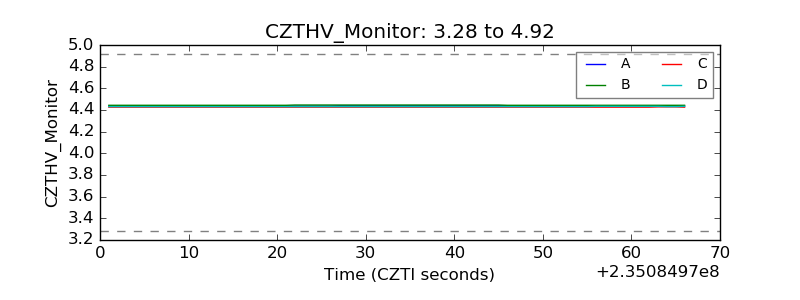 |
| D_VDD | 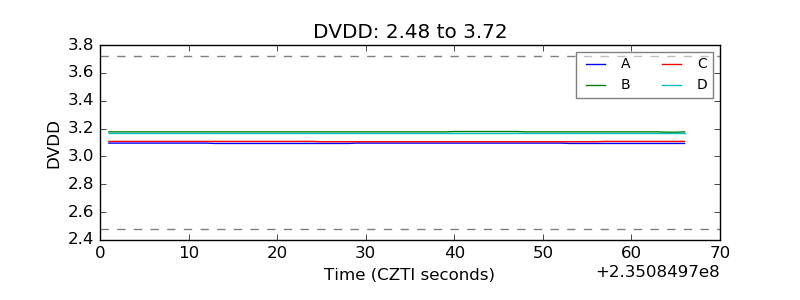 |
| Temperature 1 | 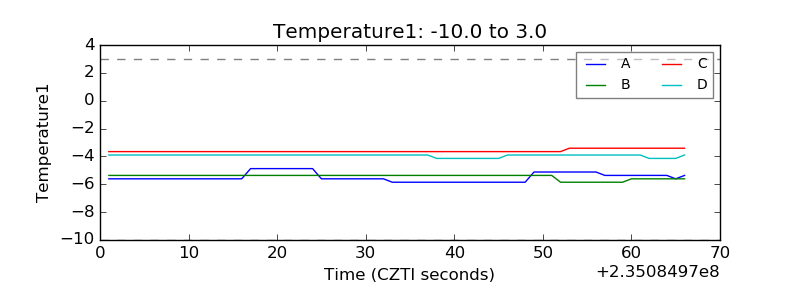 |
| Veto HV Monitor | 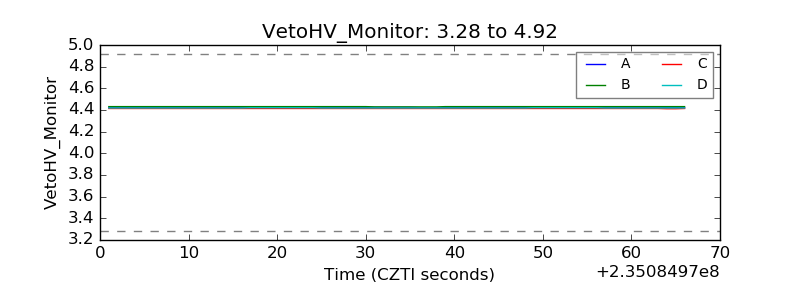 |
| Veto LLD | 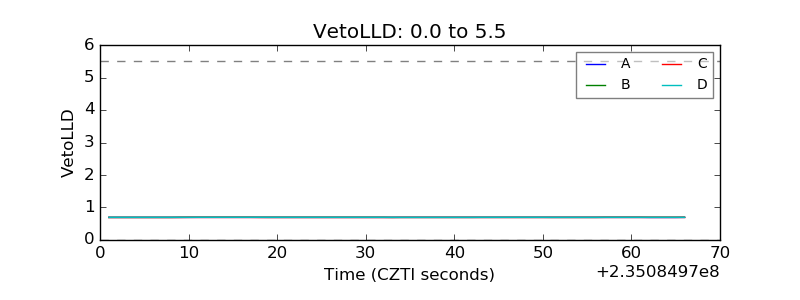 |
| Alpha Counter | 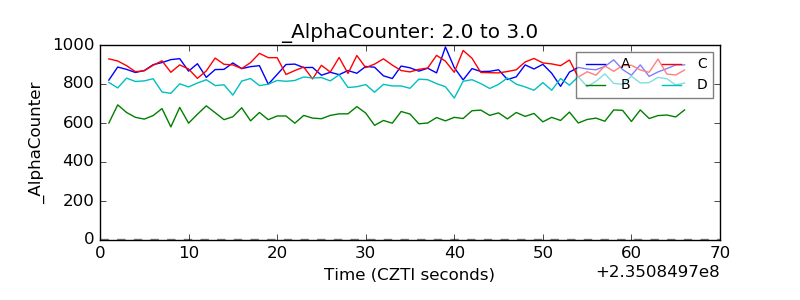 |
| _CPM_Rate | 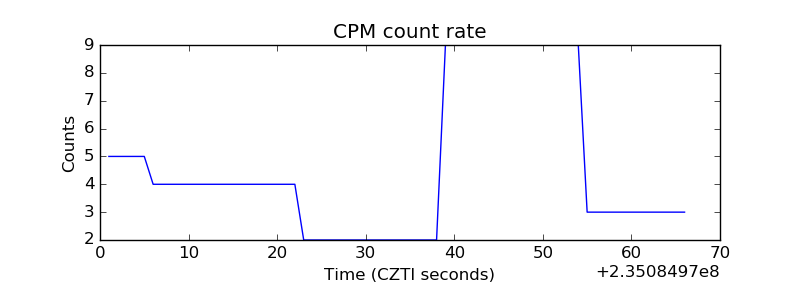 |
| CZT Counter | 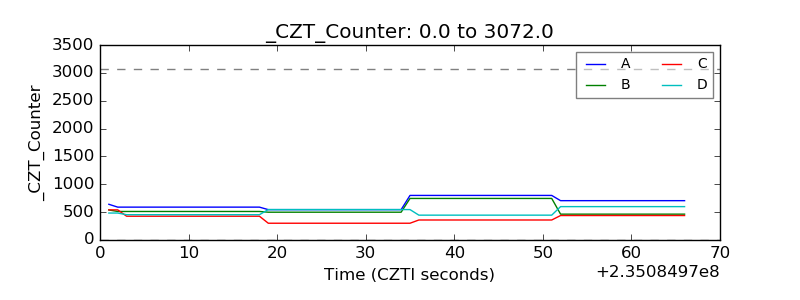 |
| +2.5 Volts monitor |  |
| +5 Volts monitor |  |
| _ROLL_ROT | 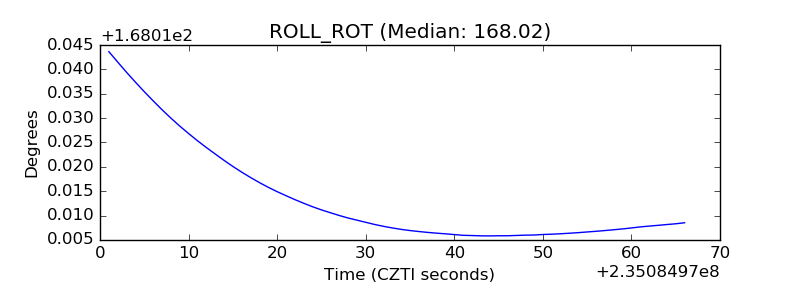 |
| _Roll_DEC | 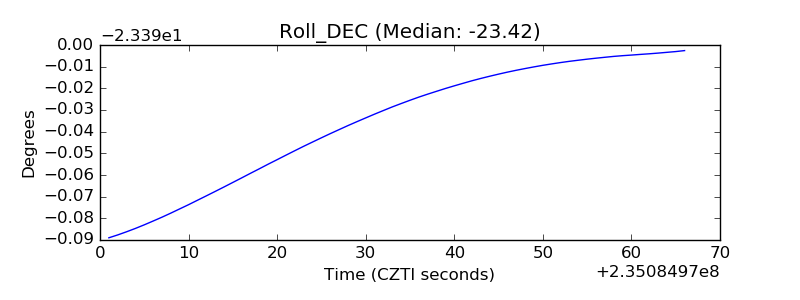 |
| _Roll_RA | 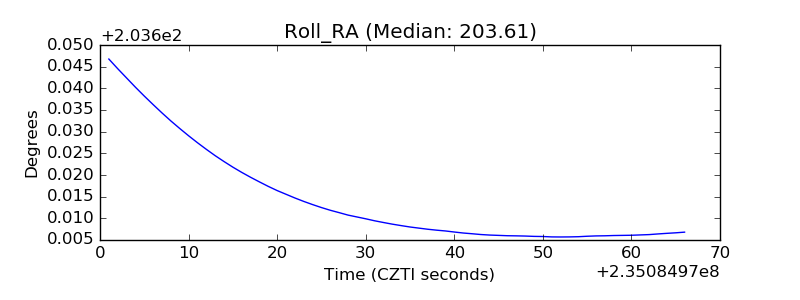 |
| Veto Counter | 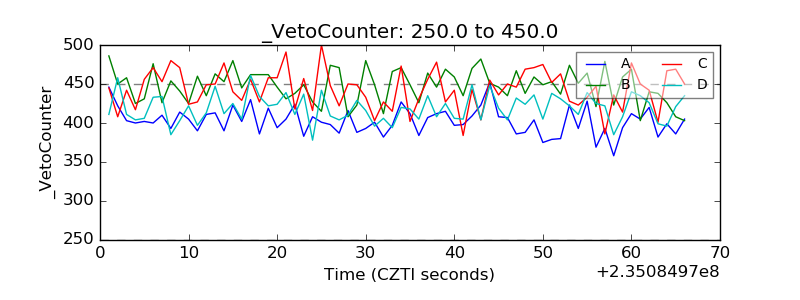 |