| Param | Original file | Final file |
|---|---|---|
| Filename | modeM0/AS1A03_091T02_9000001292_09250cztM0_level2.evt | modeM0/AS1A03_091T02_9000001292_09250cztM0_level2_quad_clean.evt |
| Size (bytes) | 321,883,200 | 54,095,040 |
| Size | 307.0 MB | 51.6 MB |
| Events in quadrant A | 2,330,524 | 335,280 |
| Events in quadrant B | 2,322,438 | 343,653 |
| Events in quadrant C | 2,599,389 | 329,416 |
| Events in quadrant D | 2,196,057 | 321,127 |
| Mode M0 | |||
|---|---|---|---|
| Quadrant | BADHDUFLAG | Total packets | Discarded packets |
| A | 0 | 13779 | 4244 |
| B | 0 | 13601 | 3915 |
| C | 0 | 16407 | 5818 |
| D | 0 | 13720 | 4213 |
| Mode M9 | |||
|---|---|---|---|
| Quadrant | BADHDUFLAG | Total packets | Discarded packets |
| A | 0 | 18 | 1 |
| B | 0 | 18 | 2 |
| C | 0 | 18 | 1 |
| D | 0 | 19 | 2 |
| Mode SS | |||
|---|---|---|---|
| Quadrant | BADHDUFLAG | Total packets | Discarded packets |
| A | 0 | 128 | 40 |
| B | 0 | 128 | 38 |
| C | 0 | 128 | 42 |
| D | 0 | 128 | 34 |
| Quadrant | Total seconds | Saturated seconds | Saturation percentage |
|---|---|---|---|
| A | 4383 | 21 | 0.479124% |
| B | 4420 | 42 | 0.950226% |
| C | 4298 | 138 | 3.210796% |
| D | 4390 | 45 | 1.025057% |
Noise dominated data is calculated using 1-second bins in cleaned event files. If a bin has >2000 counts, and if more than 50% of those come from <1% of pixels, then it is considered to be noise-dominated and hence unusable.
| Quadrant | # 1 sec bins | Bins with >0 counts | Bins with >2000 counts | High rate bins dominated by noise | Noise dominated (total time) | Noise dominated (detector-on time) | Marked lightcurve |
|---|---|---|---|---|---|---|---|
| A | 7540 | 5154 | 2 | 2 | 0.03% | 0.04% | 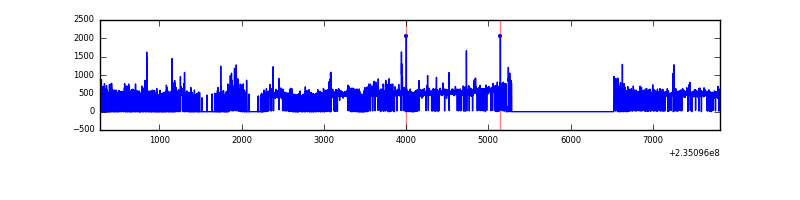 |
| B | 7540 | 5201 | 0 | 0 | 0.00% | 0.00% | 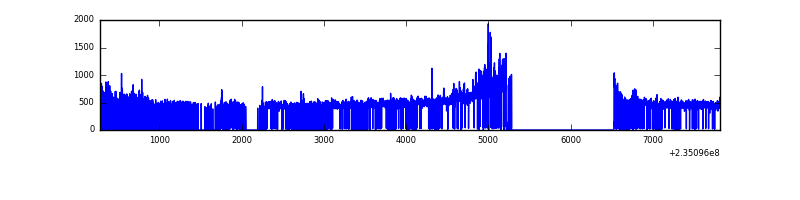 |
| C | 7540 | 5111 | 110 | 110 | 1.46% | 2.15% | 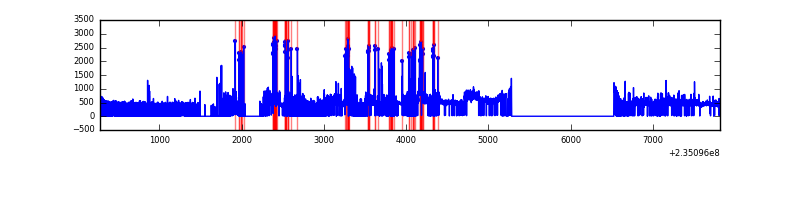 |
| D | 7539 | 5194 | 26 | 26 | 0.34% | 0.50% | 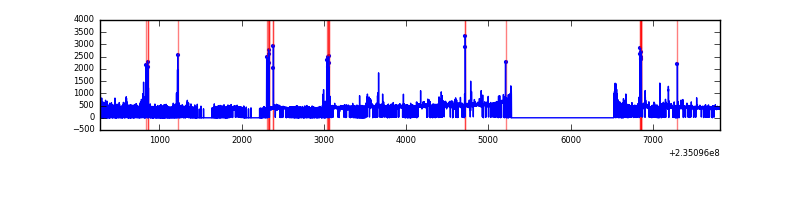 |
Top three noisy pixels from each quadrant. If the there are fewer than three noisy pixels in the level2.evt file, extra rows are filled as -1
| Pixel properties | Quadrant properties | ||||||
|---|---|---|---|---|---|---|---|
| Quadrant | DetID | PixID | Counts | Sigma | Mean | Median | Sigma |
| A | 8 | 5 | 192126 | 1725.84 | 542 | 532 | 111.0 |
| A | 1 | 162 | 15182 | 131.96 | 542 | 532 | 111.0 |
| A | 15 | 174 | 12213 | 105.22 | 542 | 532 | 111.0 |
| B | 0 | 219 | 99526 | 931.42 | 551 | 540 | 106.3 |
| B | 15 | 255 | 24347 | 224.01 | 551 | 540 | 106.3 |
| B | 0 | 214 | 24067 | 221.38 | 551 | 540 | 106.3 |
| C | 9 | 68 | 578117 | 4834.65 | 509 | 512 | 119.5 |
| C | 14 | 234 | 31884 | 262.59 | 509 | 512 | 119.5 |
| C | 13 | 61 | 3799 | 27.51 | 509 | 512 | 119.5 |
| D | 2 | 136 | 83451 | 580.8 | 517 | 504 | 142.8 |
| D | 7 | 71 | 66274 | 460.52 | 517 | 504 | 142.8 |
| D | 1 | 52 | 36517 | 252.16 | 517 | 504 | 142.8 |
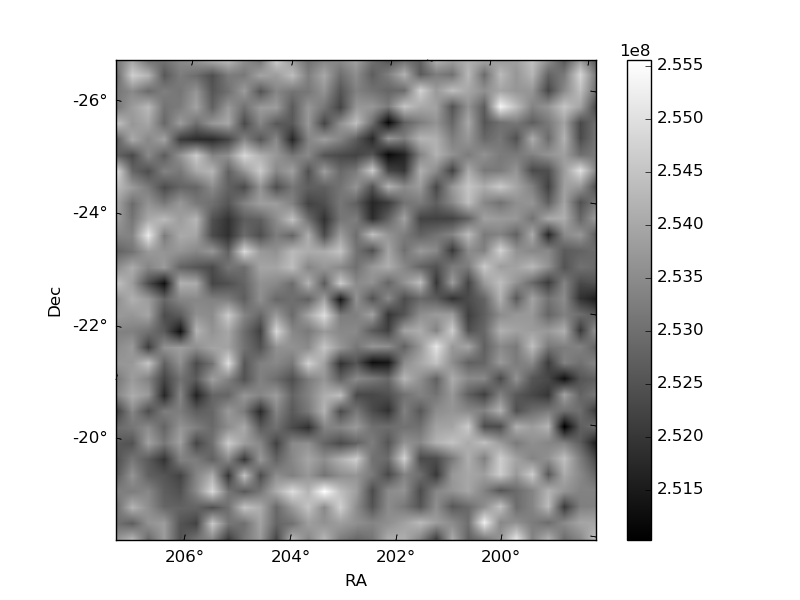
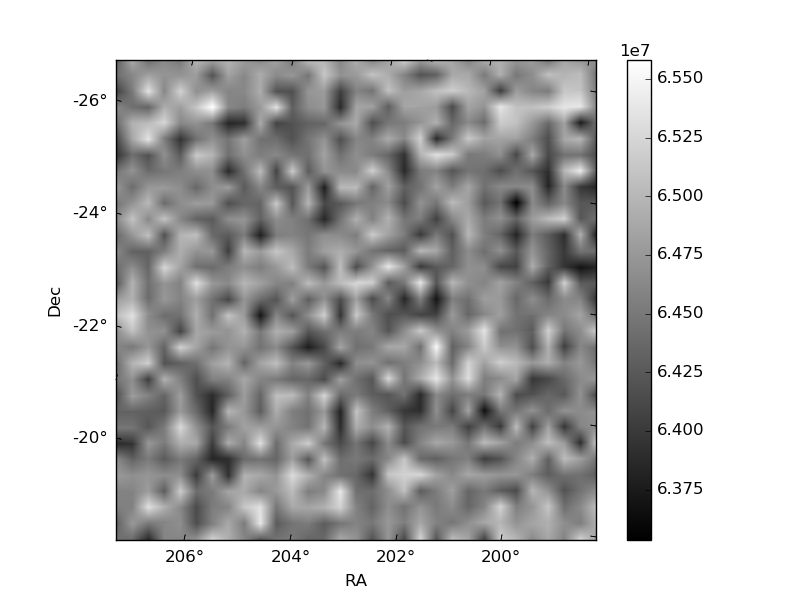
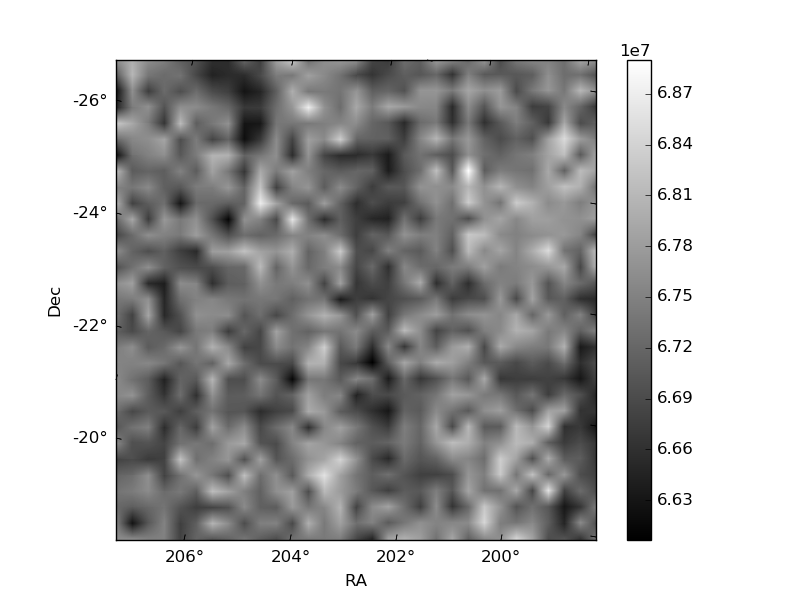
Histogram calculated using DETX and DETY for each event in the final _common_clean file
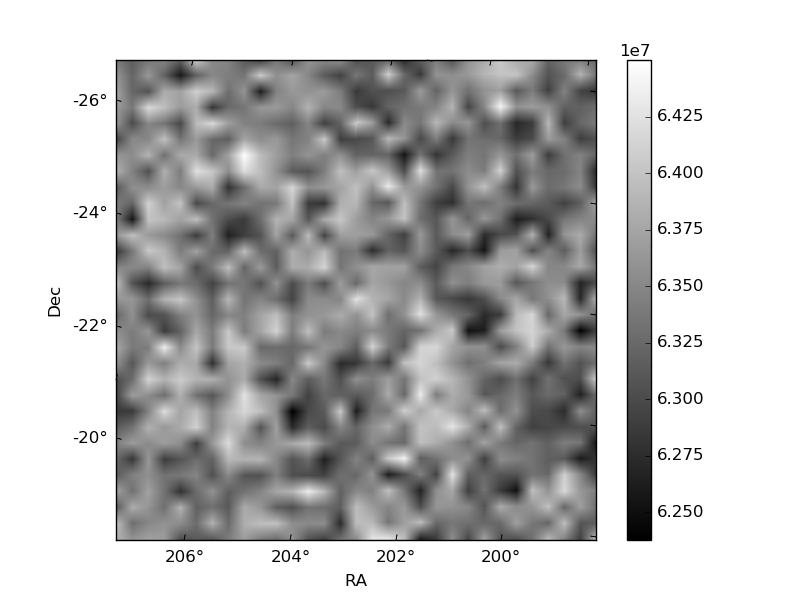
| Quadrant A | 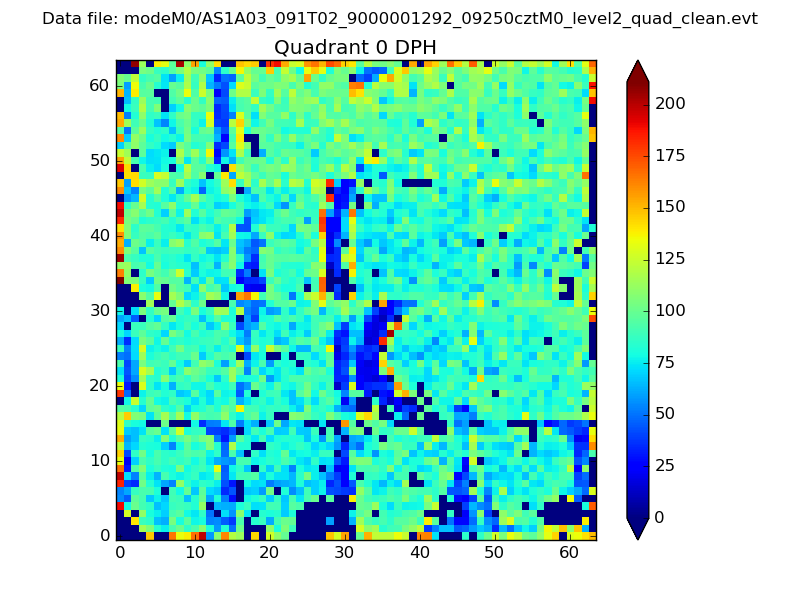 |
 |
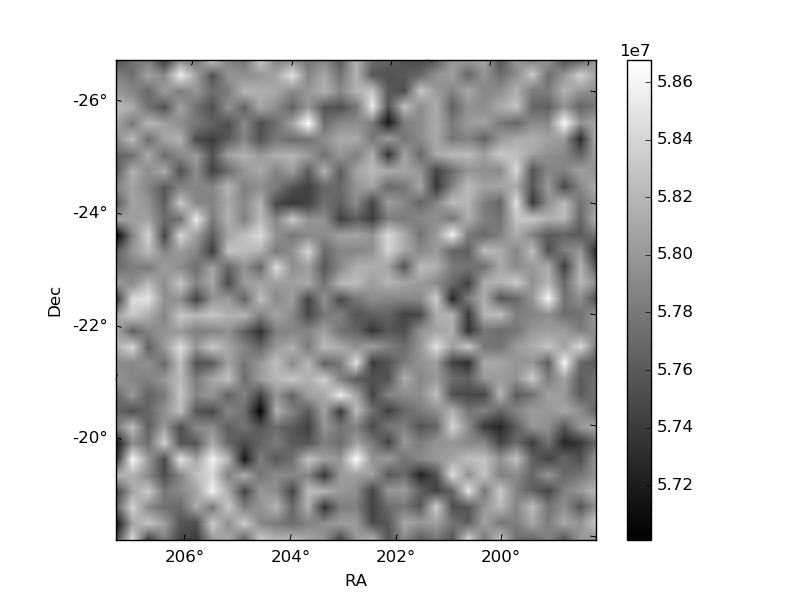
Quadrant B |
|---|---|---|---|
| Quadrant D | 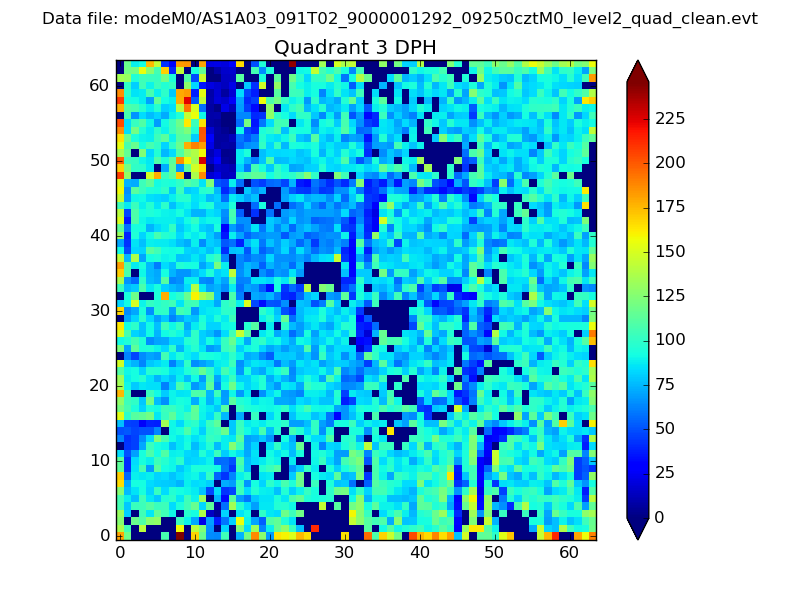 |
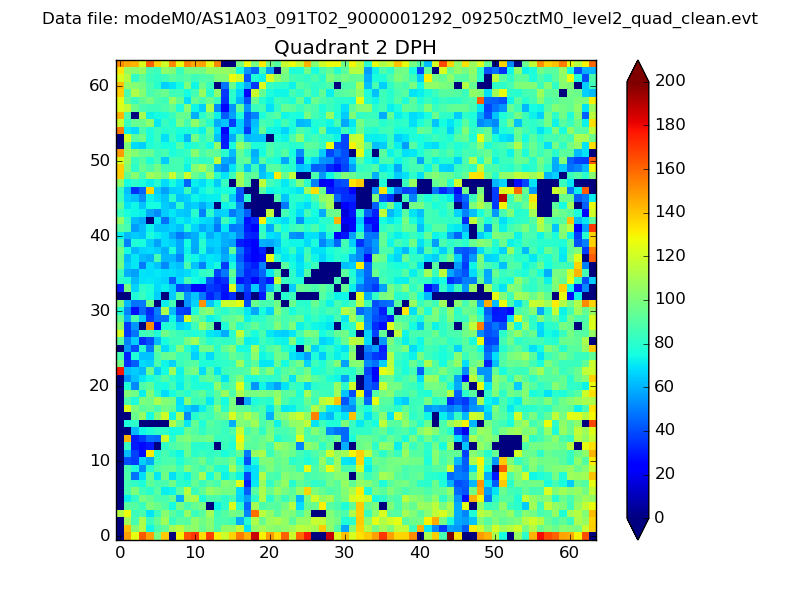 |
Quadrant C |
| Plot type | Count rate plots | Images |
|---|---|---|
| Comparison with Poisson distribution Blue bars denote a histogram of data divided into 1 sec bins. Red curve is a Poisson curve with rate = median count rate of data. |
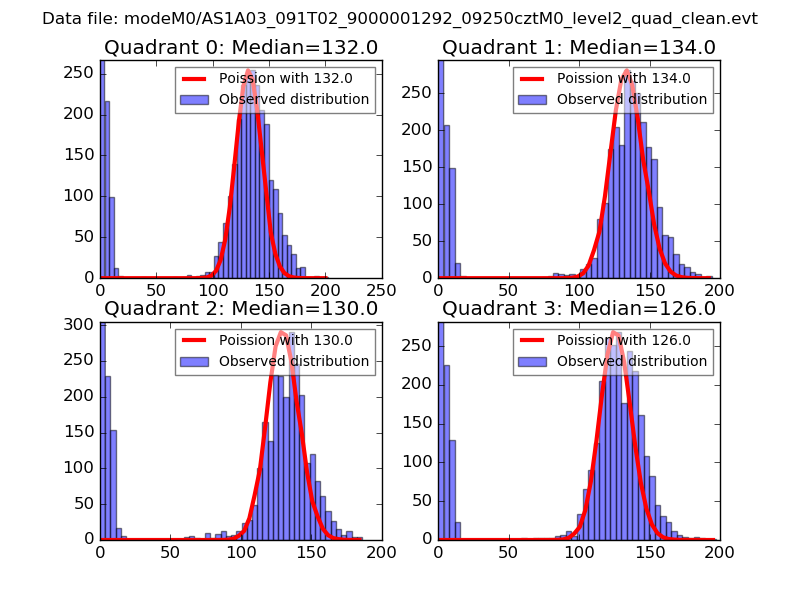 |
 |
| Quadrant-wise count rates Data is divided into 100 sec bins |
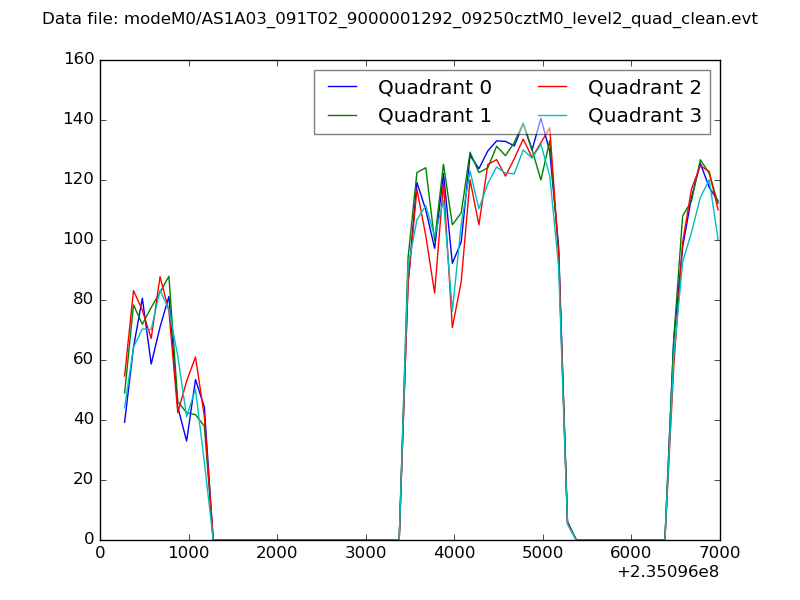 |
|
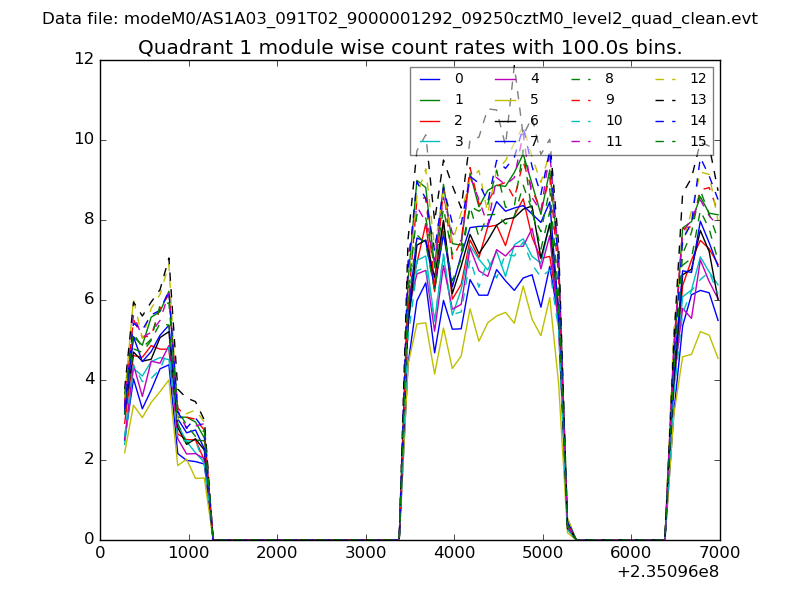
| Module-wise count rates for Quadrant A Data is divided into 100 sec bins |
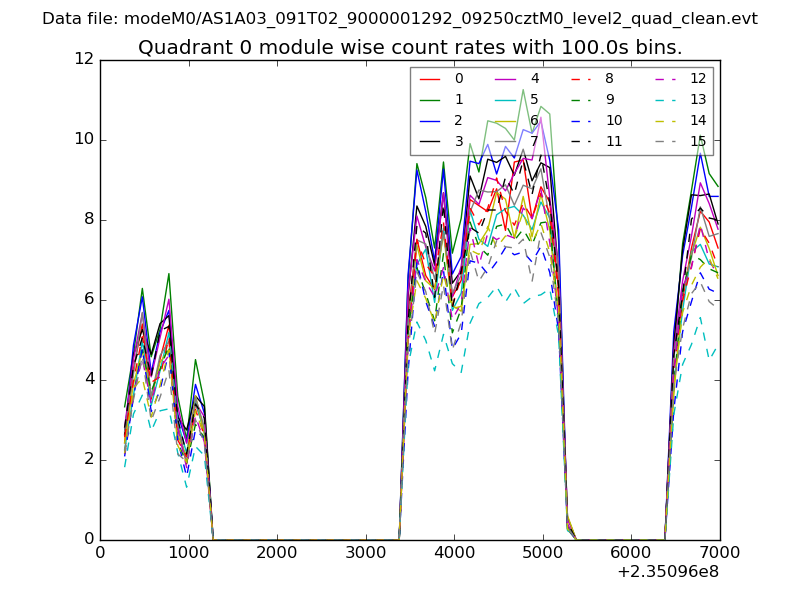 |
 |
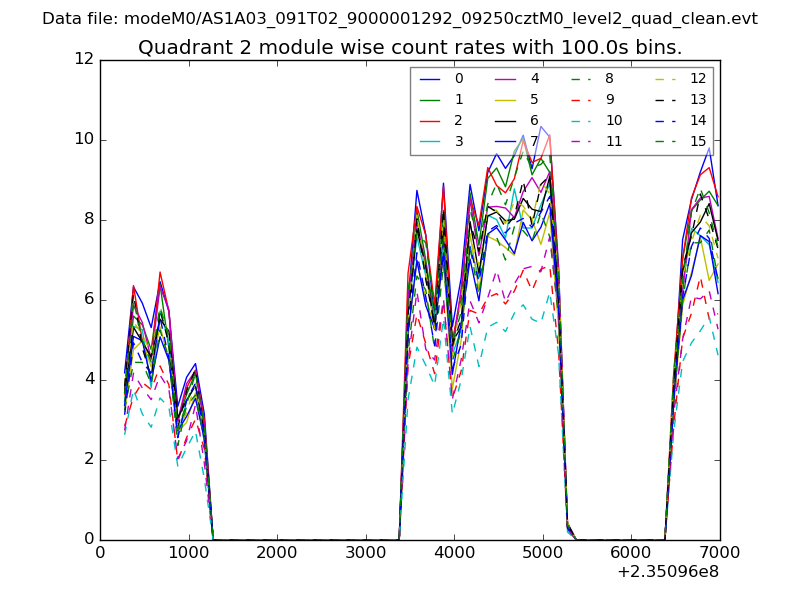
| Module-wise count rates for Quadrant B Data is divided into 100 sec bins |
 |
 |
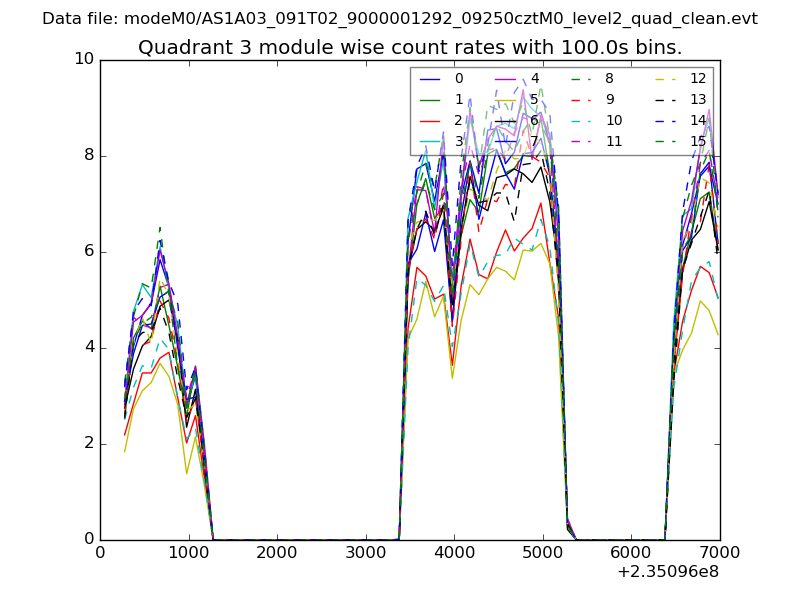
| Module-wise count rates for Quadrant C Data is divided into 100 sec bins |
 |
 |
| Module-wise count rates for Quadrant D Data is divided into 100 sec bins |
 |
 |
| Parameter | Plot |
|---|---|
| CZT HV Monitor | 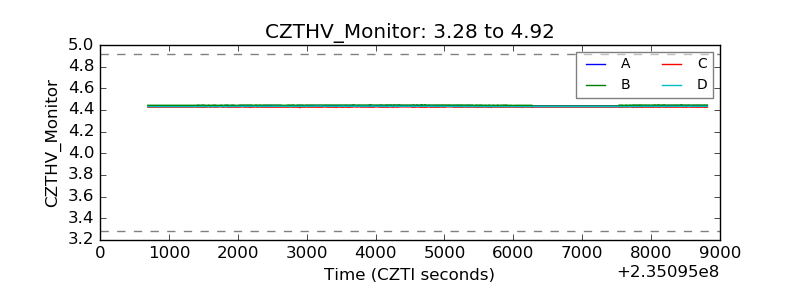 |
| D_VDD | 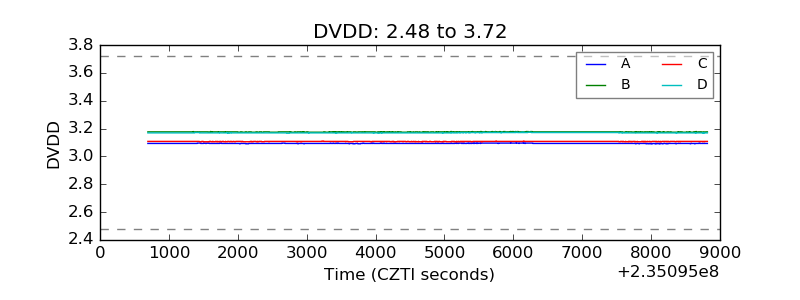 |
| Temperature 1 | 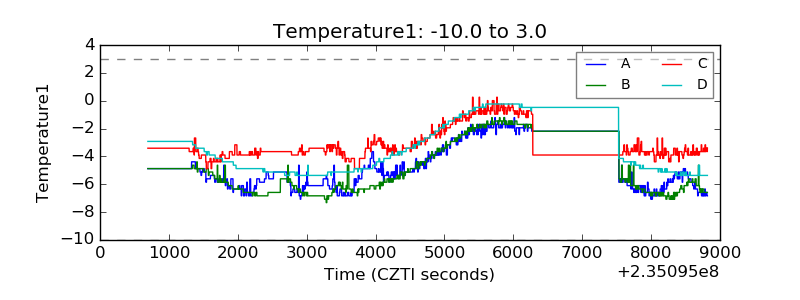 |
| Veto HV Monitor | 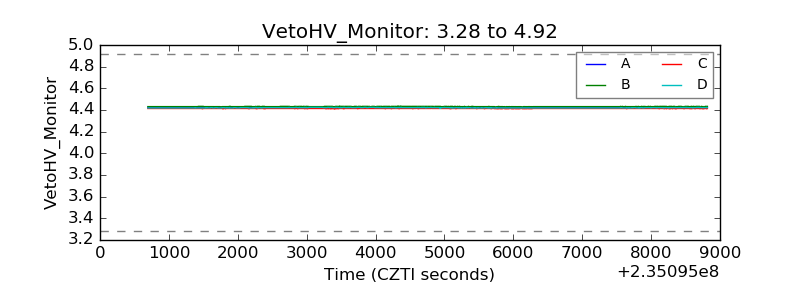 |
| Veto LLD | 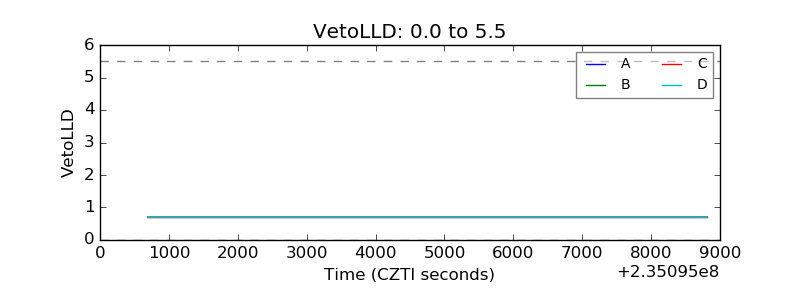 |
| Alpha Counter | 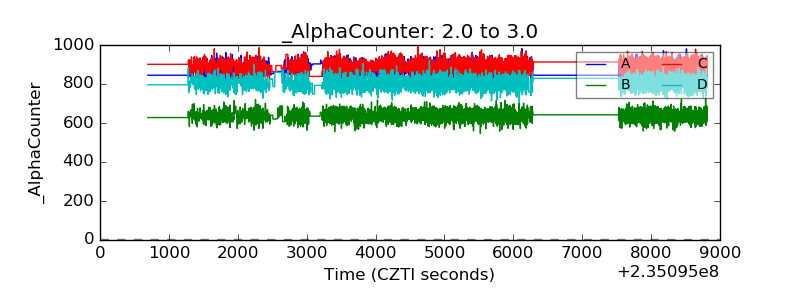 |
| _CPM_Rate | 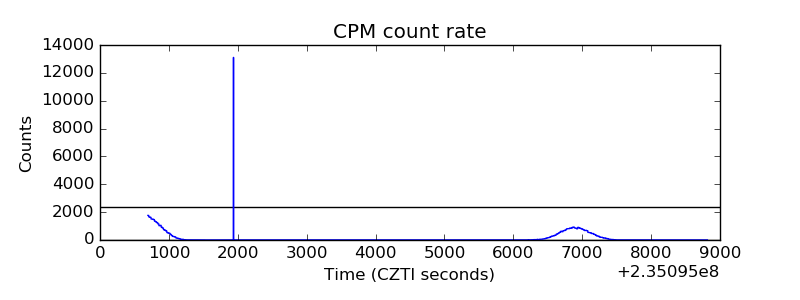 |
| CZT Counter | 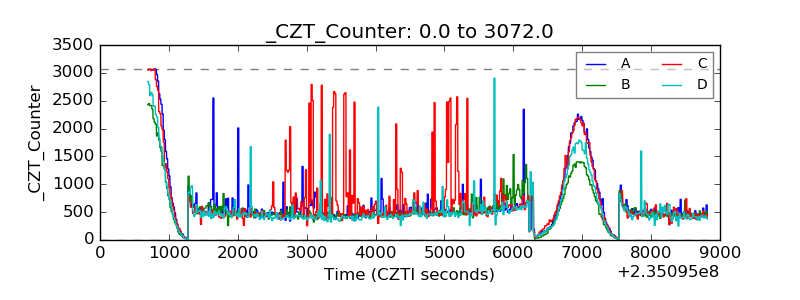 |
| +2.5 Volts monitor |  |
| +5 Volts monitor |  |
| _ROLL_ROT | 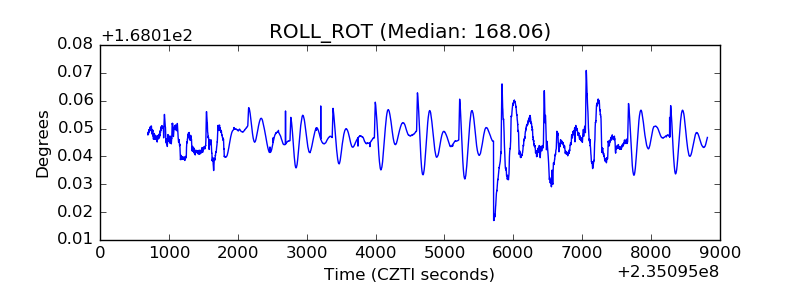 |
| _Roll_DEC | 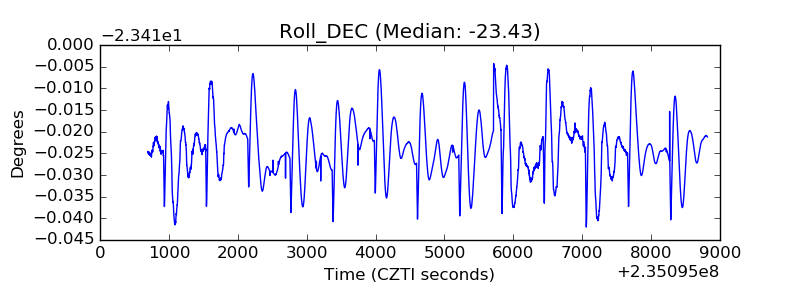 |
| _Roll_RA | 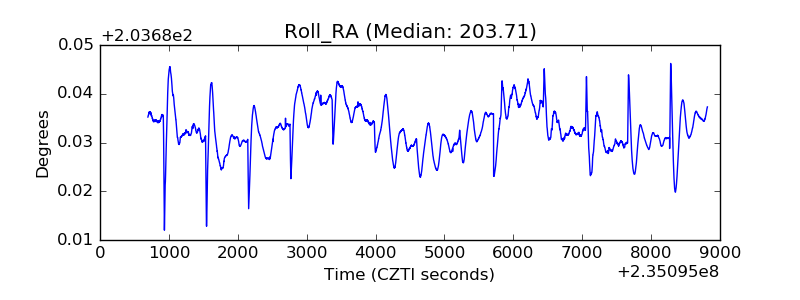 |
| Veto Counter | 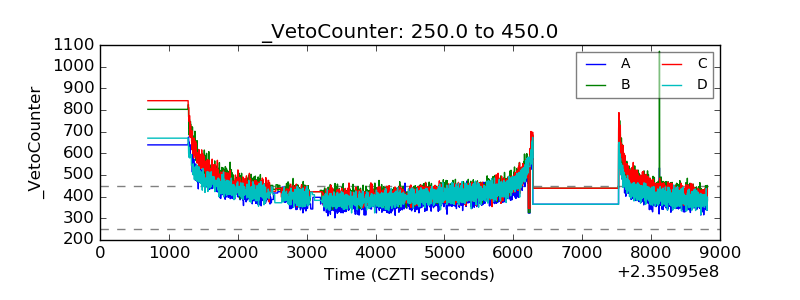 |