| Param | Original file | Final file |
|---|---|---|
| Filename | modeM0/AS1A03_091T02_9000001292_09251cztM0_level2.evt | modeM0/AS1A03_091T02_9000001292_09251cztM0_level2_quad_clean.evt |
| Size (bytes) | 759,764,160 | 105,361,920 |
| Size | 724.6 MB | 100.5 MB |
| Events in quadrant A | 5,375,768 | 630,582 |
| Events in quadrant B | 5,194,140 | 639,290 |
| Events in quadrant C | 6,770,085 | 607,744 |
| Events in quadrant D | 4,973,568 | 600,934 |
| Mode M0 | |||
|---|---|---|---|
| Quadrant | BADHDUFLAG | Total packets | Discarded packets |
| A | 0 | 22664 | 496 |
| B | 0 | 22551 | 513 |
| C | 0 | 27931 | 895 |
| D | 0 | 22541 | 534 |
| Mode M9 | |||
|---|---|---|---|
| Quadrant | BADHDUFLAG | Total packets | Discarded packets |
| A | 0 | 23 | 0 |
| B | 0 | 23 | 0 |
| C | 0 | 23 | 0 |
| D | 0 | 23 | 0 |
| Mode SS | |||
|---|---|---|---|
| Quadrant | BADHDUFLAG | Total packets | Discarded packets |
| A | 0 | 214 | 4 |
| B | 0 | 214 | 2 |
| C | 0 | 214 | 6 |
| D | 0 | 214 | 4 |
| Quadrant | Total seconds | Saturated seconds | Saturation percentage |
|---|---|---|---|
| A | 10279 | 61 | 0.593443% |
| B | 10270 | 77 | 0.749757% |
| C | 10238 | 555 | 5.420981% |
| D | 10304 | 76 | 0.737578% |
Noise dominated data is calculated using 1-second bins in cleaned event files. If a bin has >2000 counts, and if more than 50% of those come from <1% of pixels, then it is considered to be noise-dominated and hence unusable.
| Quadrant | # 1 sec bins | Bins with >0 counts | Bins with >2000 counts | High rate bins dominated by noise | Noise dominated (total time) | Noise dominated (detector-on time) | Marked lightcurve |
|---|---|---|---|---|---|---|---|
| A | 12775 | 10396 | 12 | 12 | 0.09% | 0.12% | 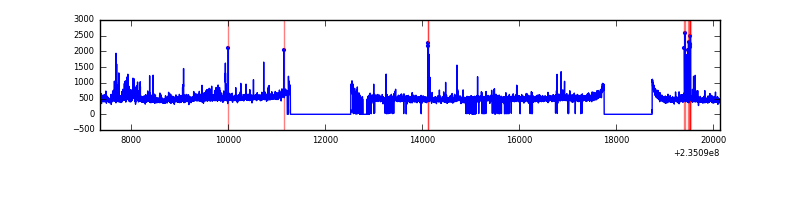 |
| B | 12775 | 10398 | 1 | 1 | 0.01% | 0.01% | 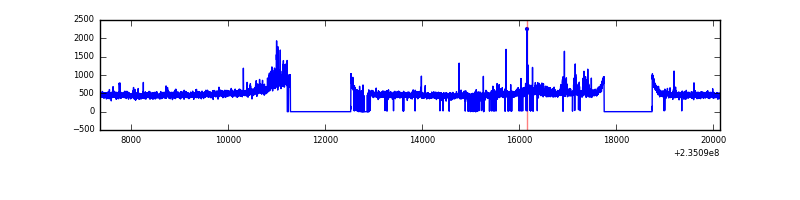 |
| C | 12775 | 10394 | 498 | 498 | 3.90% | 4.79% | 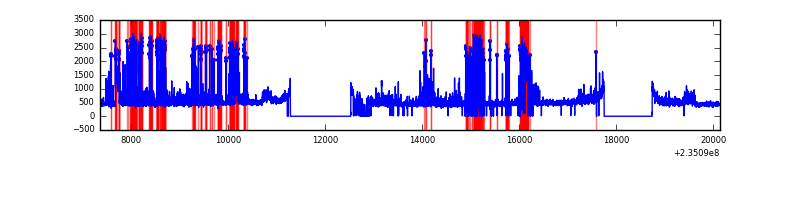 |
| D | 12775 | 10405 | 40 | 40 | 0.31% | 0.38% | 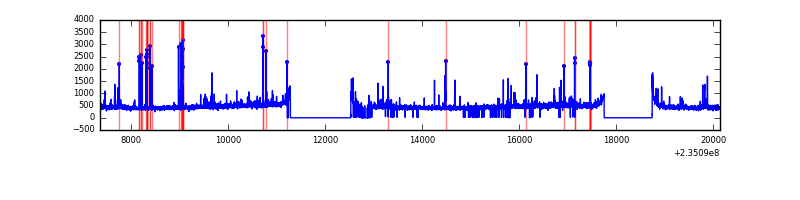 |
Top three noisy pixels from each quadrant. If the there are fewer than three noisy pixels in the level2.evt file, extra rows are filled as -1
| Pixel properties | Quadrant properties | ||||||
|---|---|---|---|---|---|---|---|
| Quadrant | DetID | PixID | Counts | Sigma | Mean | Median | Sigma |
| A | 8 | 5 | 416429 | 1629.75 | 1251 | 1225 | 254.8 |
| A | 15 | 174 | 68403 | 263.68 | 1251 | 1225 | 254.8 |
| A | 5 | 16 | 33774 | 127.76 | 1251 | 1225 | 254.8 |
| B | 0 | 219 | 122583 | 511.33 | 1254 | 1227 | 237.3 |
| B | 4 | 173 | 62131 | 256.62 | 1254 | 1227 | 237.3 |
| B | 0 | 214 | 56085 | 231.14 | 1254 | 1227 | 237.3 |
| C | 9 | 68 | 2039021 | 7399.42 | 1184 | 1188 | 275.4 |
| C | 14 | 234 | 106841 | 383.63 | 1184 | 1188 | 275.4 |
| C | 13 | 61 | 9014 | 28.42 | 1184 | 1188 | 275.4 |
| D | 2 | 136 | 183946 | 559.94 | 1198 | 1167 | 326.4 |
| D | 7 | 71 | 84404 | 254.99 | 1198 | 1167 | 326.4 |
| D | 1 | 52 | 56670 | 170.03 | 1198 | 1167 | 326.4 |
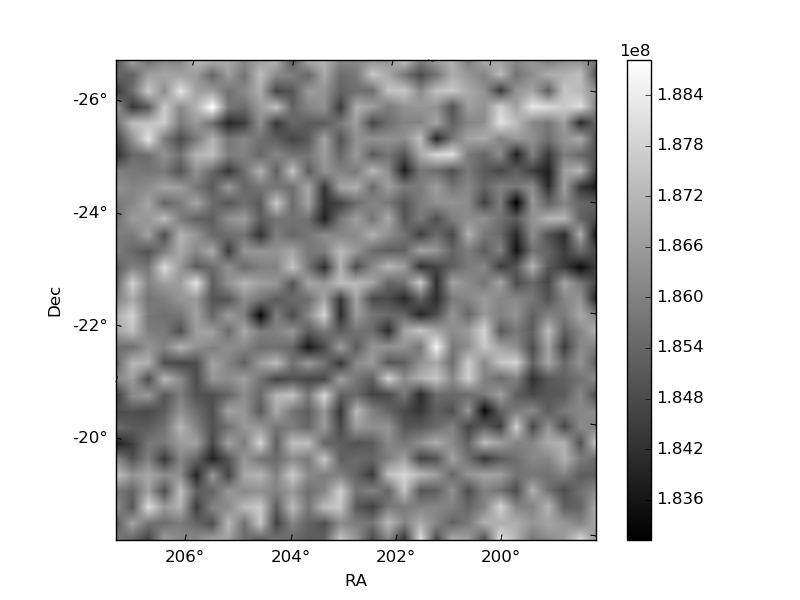
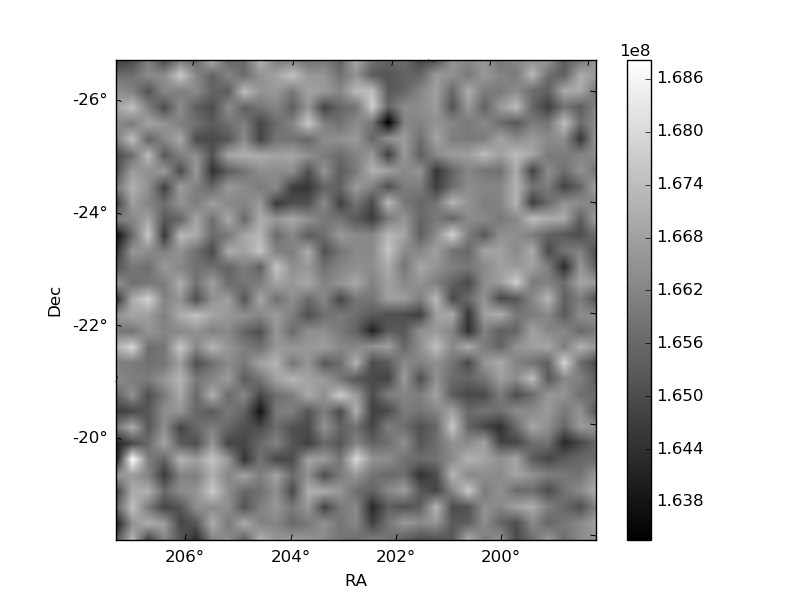
Histogram calculated using DETX and DETY for each event in the final _common_clean file
| Quadrant A |  |
 |
Quadrant B |
|---|---|---|---|
| Quadrant D |  |
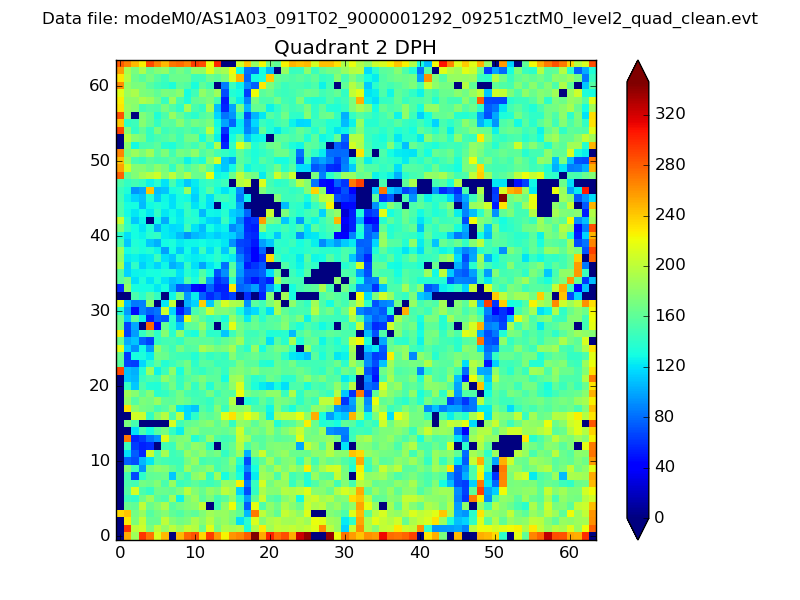 |
Quadrant C |
| Plot type | Count rate plots | Images |
|---|---|---|
| Comparison with Poisson distribution Blue bars denote a histogram of data divided into 1 sec bins. Red curve is a Poisson curve with rate = median count rate of data. |
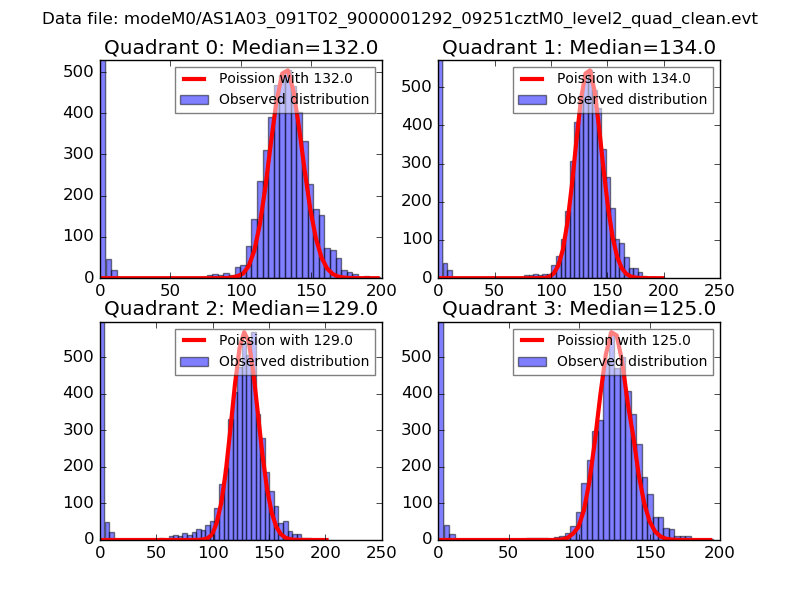 |
 |
| Quadrant-wise count rates Data is divided into 100 sec bins |
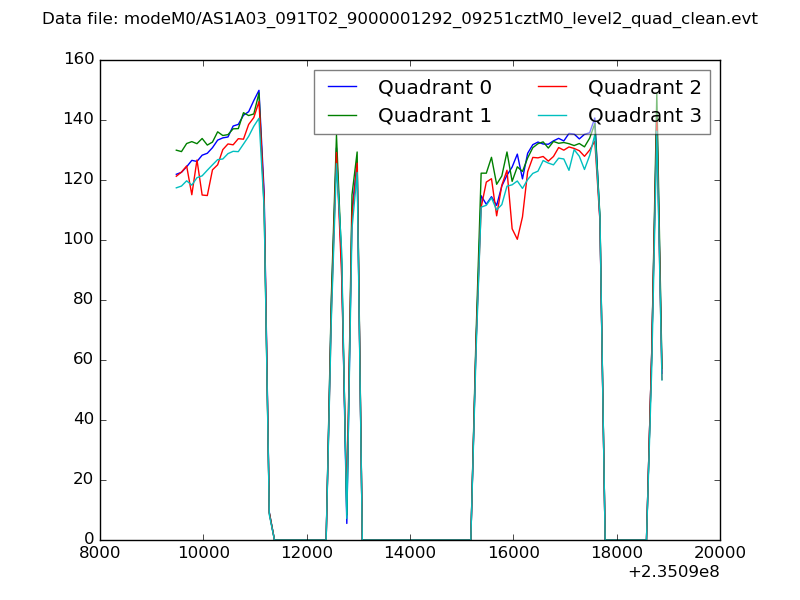 |
|
| Module-wise count rates for Quadrant A Data is divided into 100 sec bins |
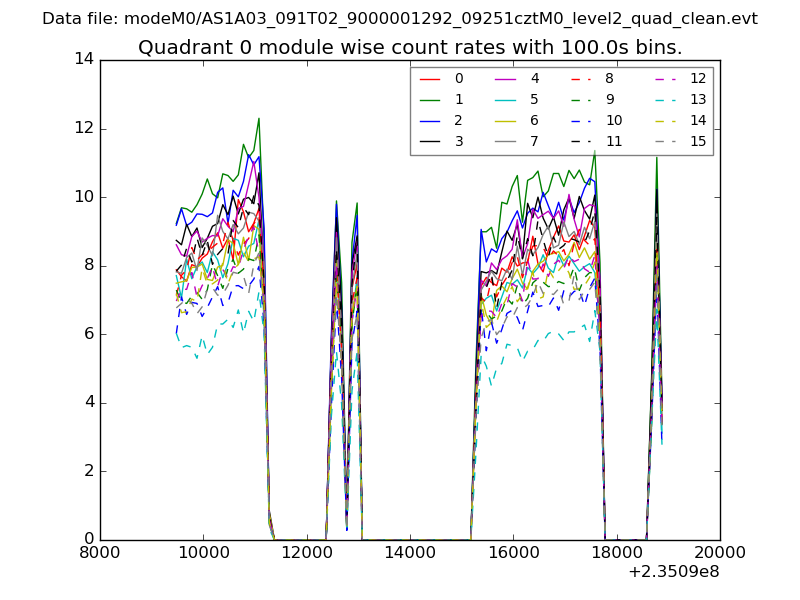 |
 |
| Module-wise count rates for Quadrant B Data is divided into 100 sec bins |
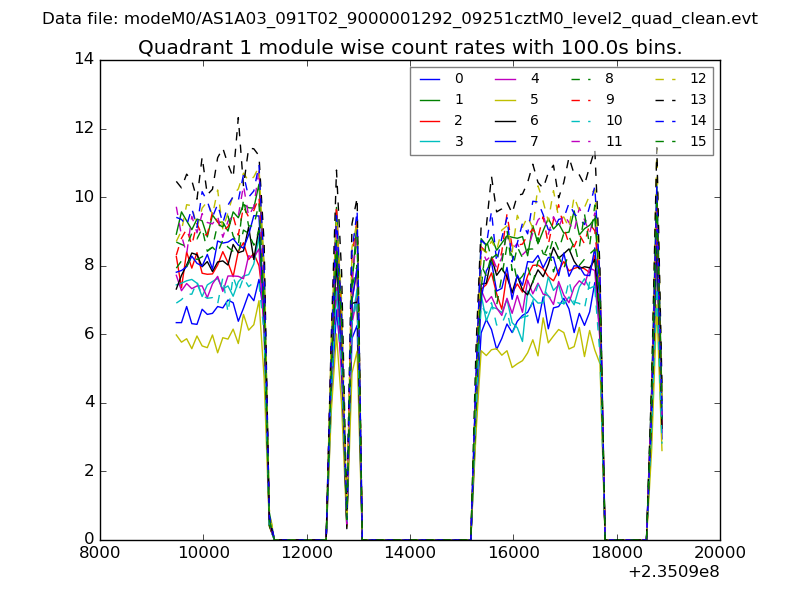 |
 |
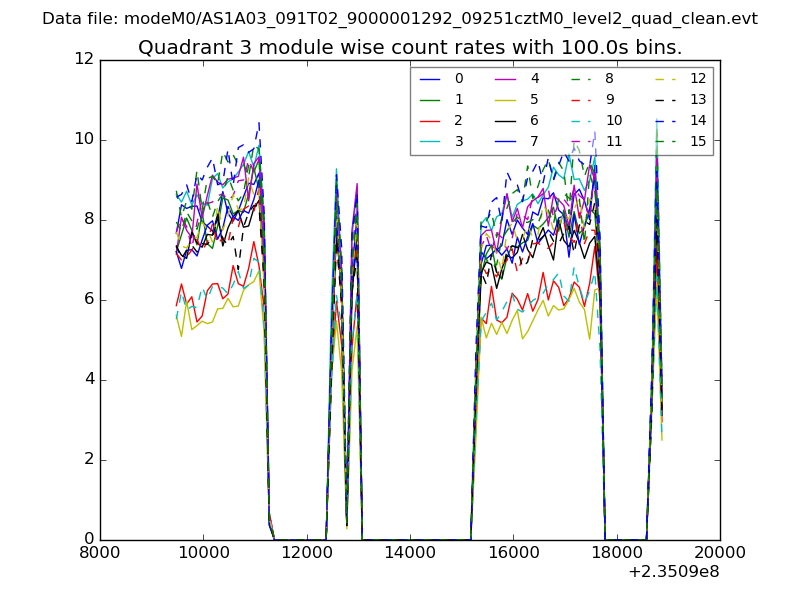
| Module-wise count rates for Quadrant C Data is divided into 100 sec bins |
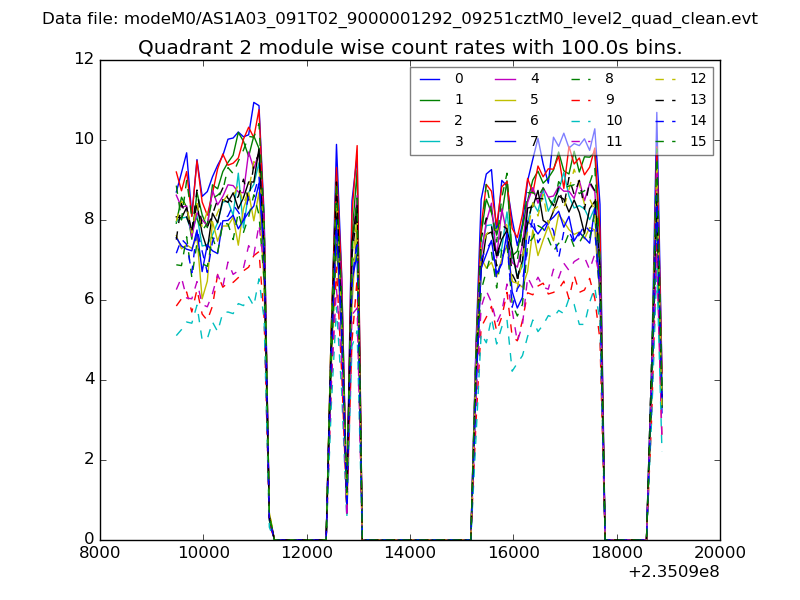 |
 |
| Module-wise count rates for Quadrant D Data is divided into 100 sec bins |
 |
 |
| Parameter | Plot |
|---|---|
| CZT HV Monitor | 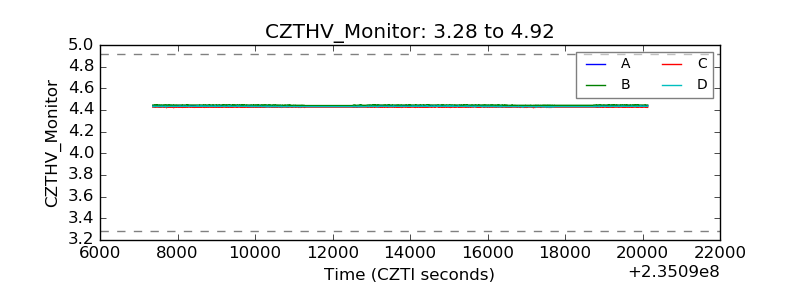 |
| D_VDD |  |
| Temperature 1 | 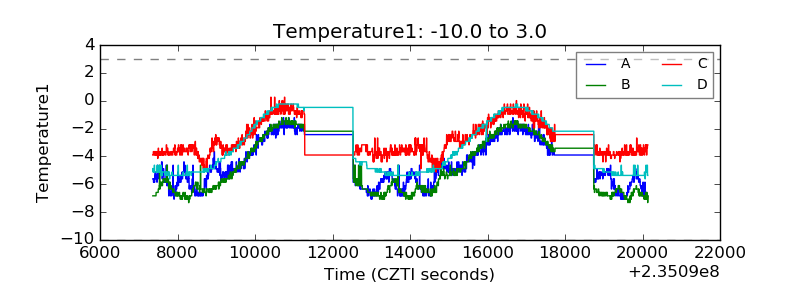 |
| Veto HV Monitor | 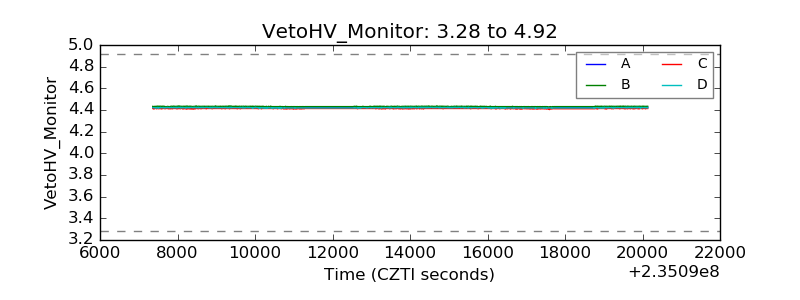 |
| Veto LLD | 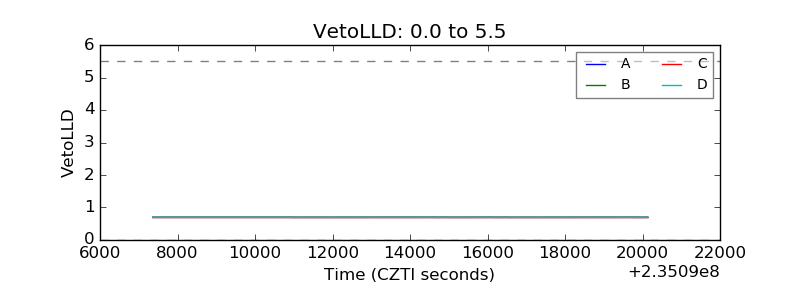 |
| Alpha Counter | 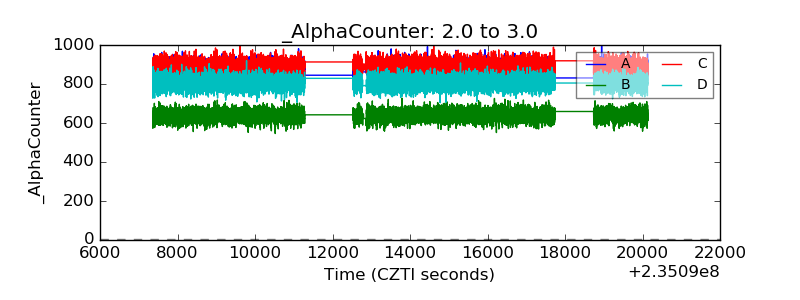 |
| _CPM_Rate | 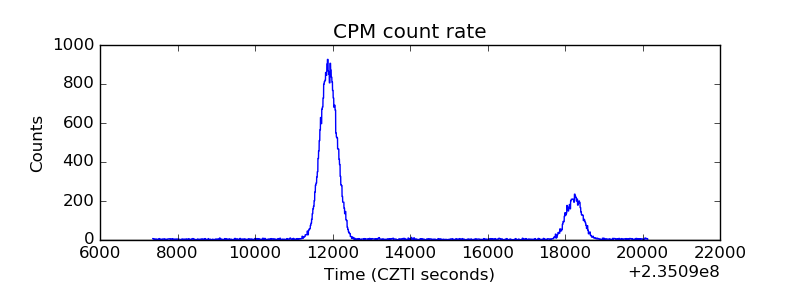 |
| CZT Counter | 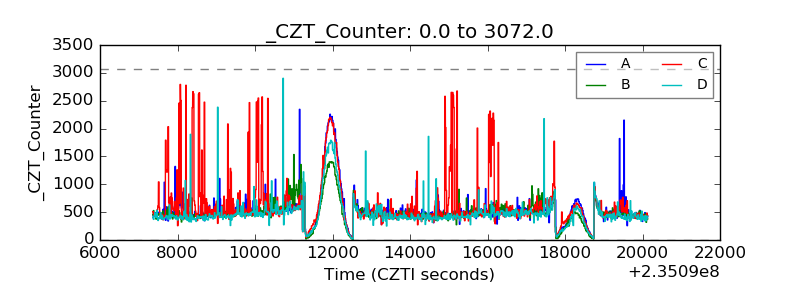 |
| +2.5 Volts monitor |  |
| +5 Volts monitor |  |
| _ROLL_ROT | 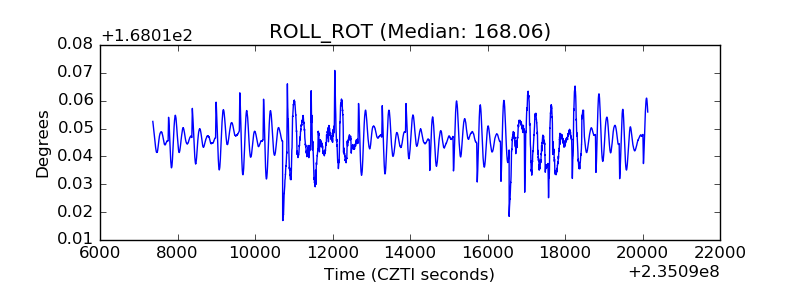 |
| _Roll_DEC | 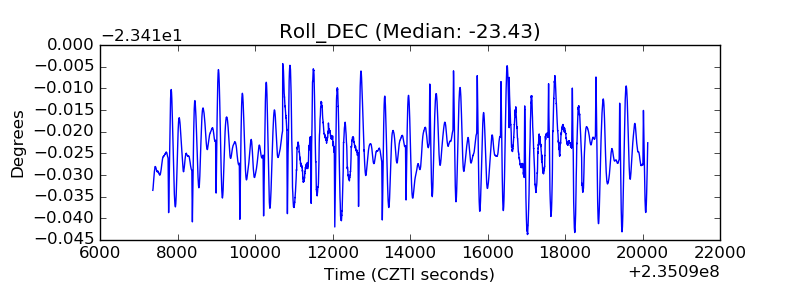 |
| _Roll_RA | 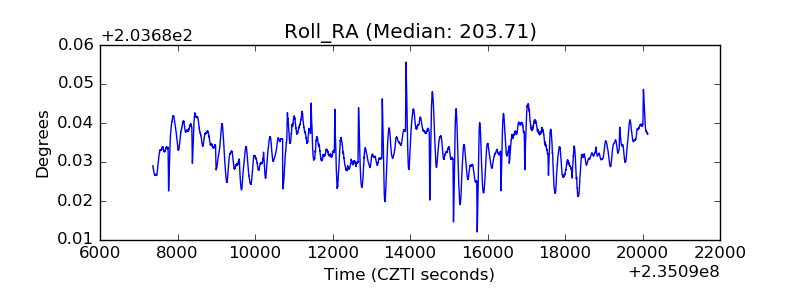 |
| Veto Counter | 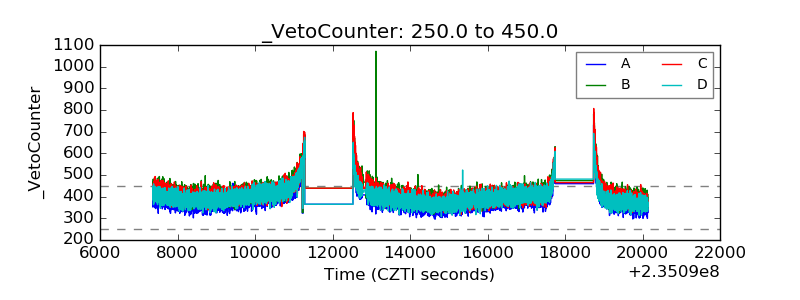 |