| Param | Original file | Final file |
|---|---|---|
| Filename | modeM0/AS1A03_091T02_9000001292_09252cztM0_level2.evt | modeM0/AS1A03_091T02_9000001292_09252cztM0_level2_quad_clean.evt |
| Size (bytes) | 529,447,680 | 82,005,120 |
| Size | 504.9 MB | 78.2 MB |
| Events in quadrant A | 4,206,406 | 494,683 |
| Events in quadrant B | 3,803,612 | 496,644 |
| Events in quadrant C | 3,708,682 | 484,865 |
| Events in quadrant D | 3,793,211 | 472,034 |
| Mode M0 | |||
|---|---|---|---|
| Quadrant | BADHDUFLAG | Total packets | Discarded packets |
| A | 0 | 17369 | 3 |
| B | 0 | 16251 | 2 |
| C | 0 | 16404 | 2 |
| D | 0 | 16702 | 2 |
| Mode M9 | |||
|---|---|---|---|
| Quadrant | BADHDUFLAG | Total packets | Discarded packets |
| A | 0 | 16 | 0 |
| B | 0 | 16 | 0 |
| C | 0 | 16 | 0 |
| D | 0 | 16 | 0 |
| Mode SS | |||
|---|---|---|---|
| Quadrant | BADHDUFLAG | Total packets | Discarded packets |
| A | 0 | 158 | 0 |
| B | 0 | 158 | 0 |
| C | 0 | 158 | 0 |
| D | 0 | 158 | 0 |
| Quadrant | Total seconds | Saturated seconds | Saturation percentage |
|---|---|---|---|
| A | 7691 | 217 | 2.821480% |
| B | 7691 | 125 | 1.625276% |
| C | 7691 | 104 | 1.352230% |
| D | 7691 | 132 | 1.716292% |
Noise dominated data is calculated using 1-second bins in cleaned event files. If a bin has >2000 counts, and if more than 50% of those come from <1% of pixels, then it is considered to be noise-dominated and hence unusable.
| Quadrant | # 1 sec bins | Bins with >0 counts | Bins with >2000 counts | High rate bins dominated by noise | Noise dominated (total time) | Noise dominated (detector-on time) | Marked lightcurve |
|---|---|---|---|---|---|---|---|
| A | 9246 | 7694 | 85 | 85 | 0.92% | 1.10% | 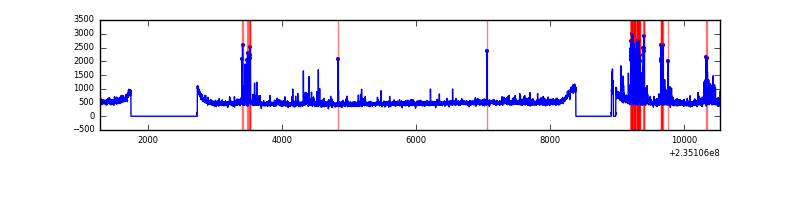 |
| B | 9246 | 7694 | 3 | 3 | 0.03% | 0.04% | 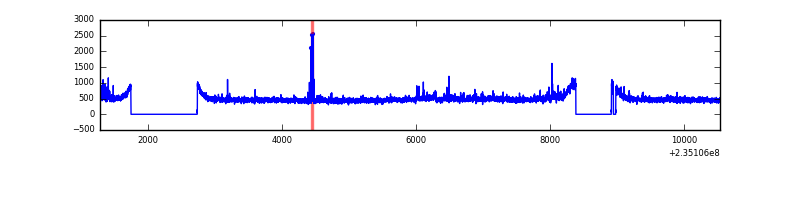 |
| C | 9246 | 7694 | 1 | 1 | 0.01% | 0.01% | 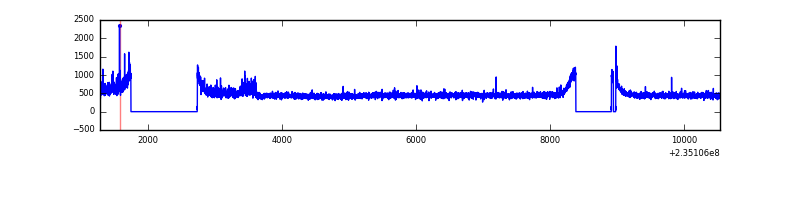 |
| D | 9246 | 7694 | 49 | 49 | 0.53% | 0.64% | 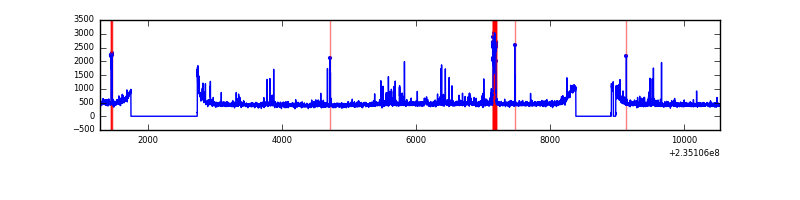 |
Top three noisy pixels from each quadrant. If the there are fewer than three noisy pixels in the level2.evt file, extra rows are filled as -1
| Pixel properties | Quadrant properties | ||||||
|---|---|---|---|---|---|---|---|
| Quadrant | DetID | PixID | Counts | Sigma | Mean | Median | Sigma |
| A | 8 | 5 | 499333 | 2596.63 | 937 | 915 | 191.9 |
| A | 15 | 174 | 59914 | 307.37 | 937 | 915 | 191.9 |
| A | 1 | 162 | 19668 | 97.7 | 937 | 915 | 191.9 |
| B | 0 | 214 | 47043 | 251.74 | 946 | 923 | 183.2 |
| B | 4 | 173 | 31669 | 167.82 | 946 | 923 | 183.2 |
| B | 0 | 187 | 27590 | 145.56 | 946 | 923 | 183.2 |
| C | 9 | 68 | 150108 | 699.88 | 909 | 912 | 213.2 |
| C | 13 | 61 | 6930 | 28.23 | 909 | 912 | 213.2 |
| C | 12 | 4 | 6332 | 25.43 | 909 | 912 | 213.2 |
| D | 7 | 71 | 151103 | 618.98 | 901 | 878 | 242.7 |
| D | 2 | 136 | 85410 | 348.3 | 901 | 878 | 242.7 |
| D | 1 | 52 | 51789 | 209.77 | 901 | 878 | 242.7 |
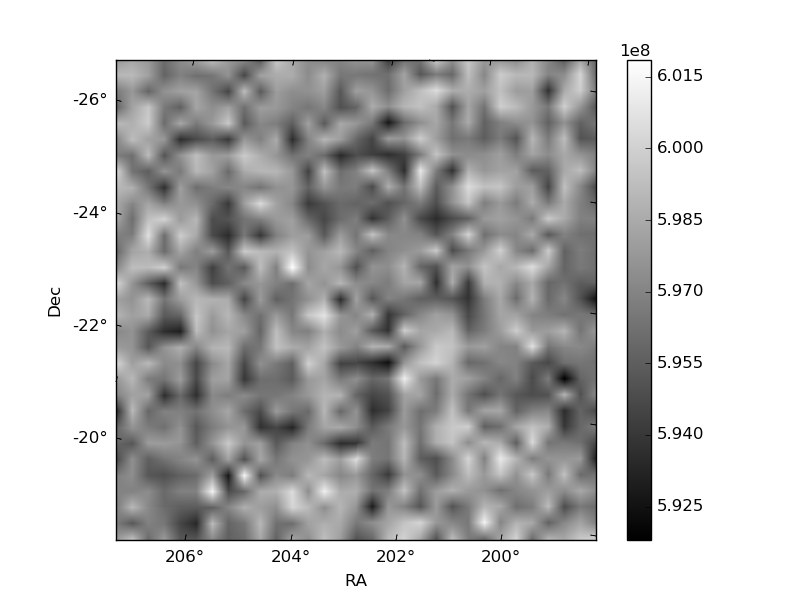
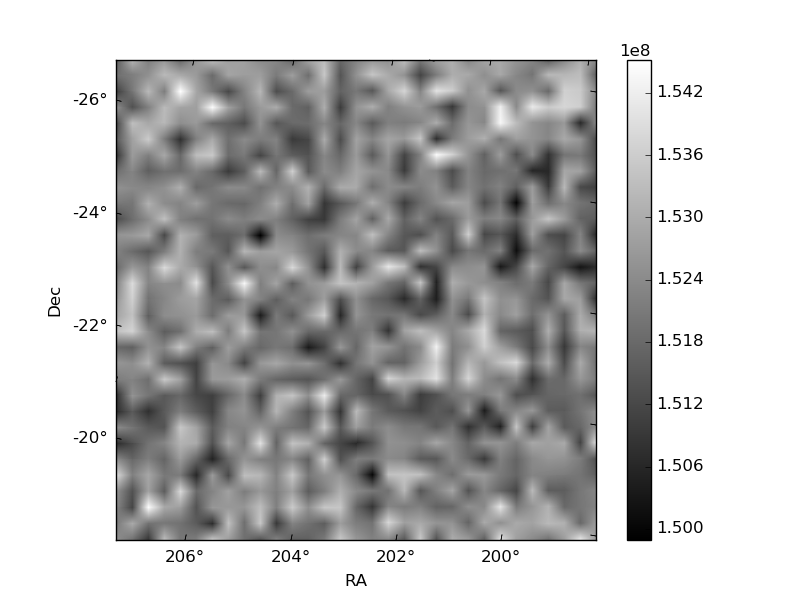
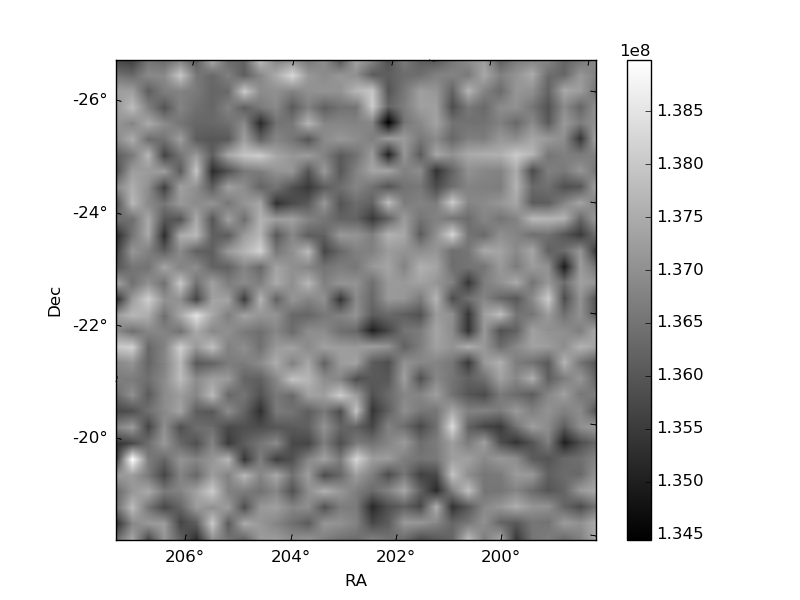
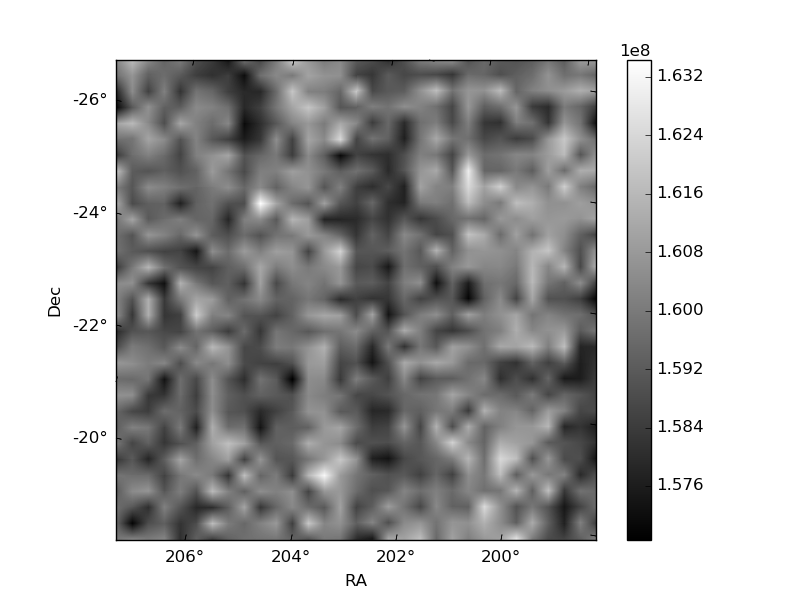
Histogram calculated using DETX and DETY for each event in the final _common_clean file
| Quadrant A | 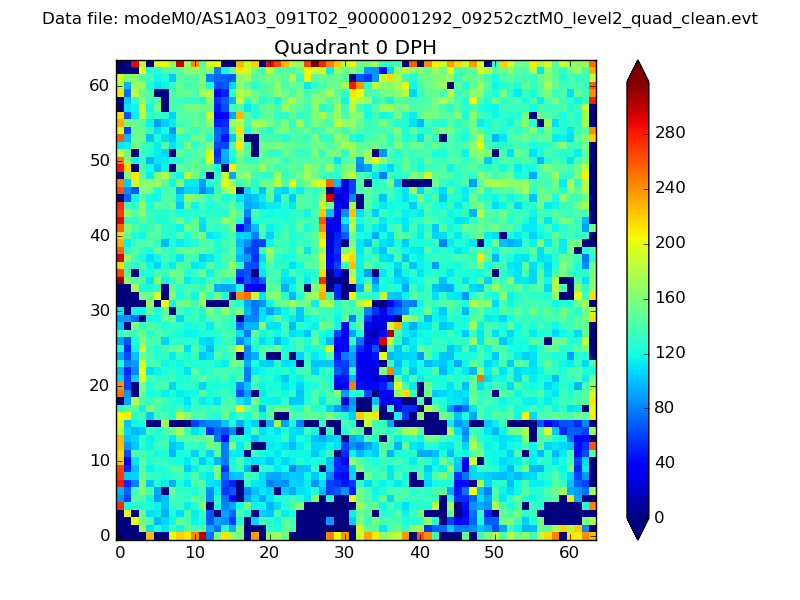 |
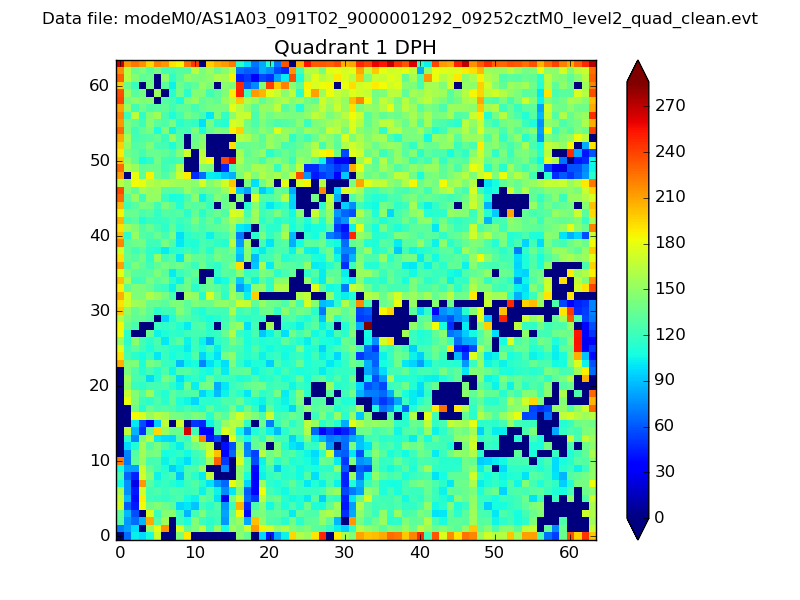 |
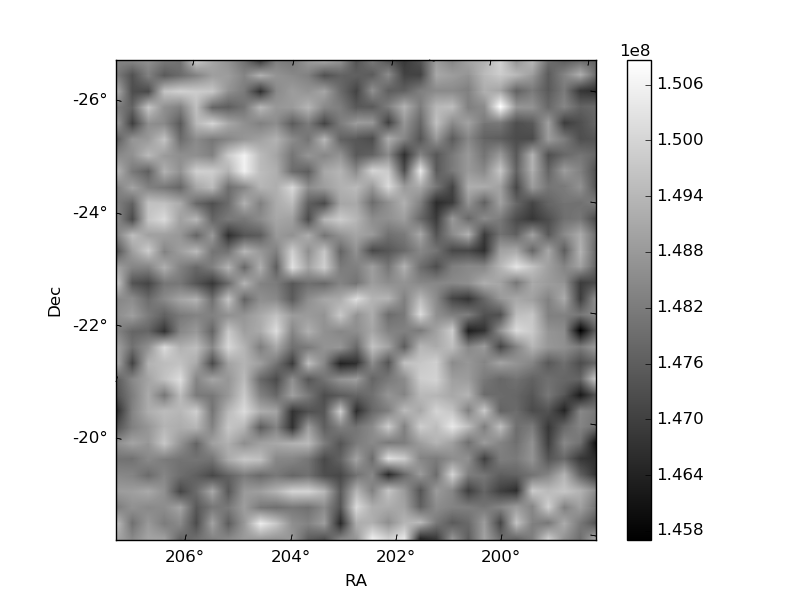
Quadrant B |
|---|---|---|---|
| Quadrant D | 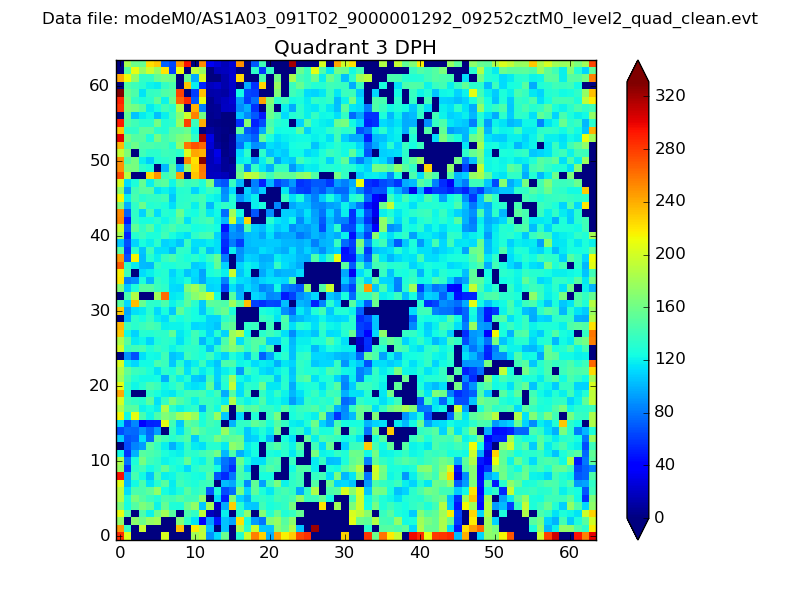 |
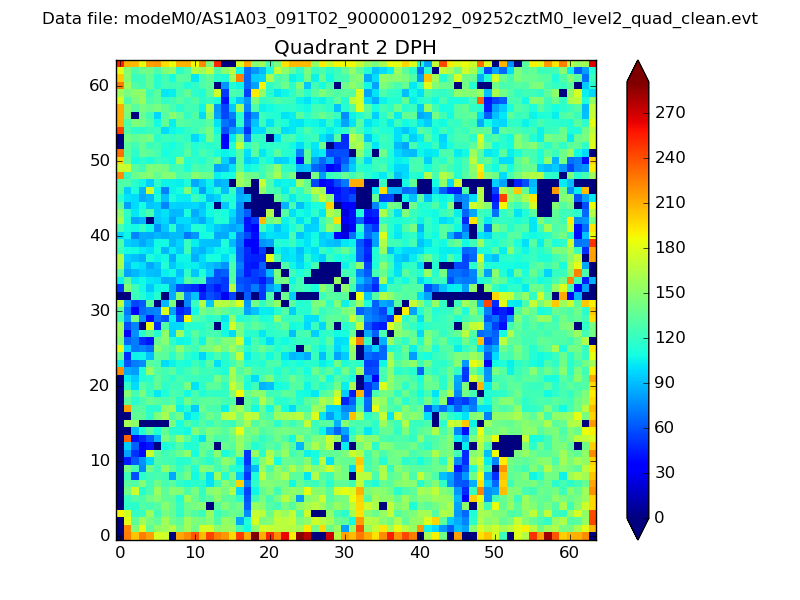 |
Quadrant C |
| Plot type | Count rate plots | Images |
|---|---|---|
| Comparison with Poisson distribution Blue bars denote a histogram of data divided into 1 sec bins. Red curve is a Poisson curve with rate = median count rate of data. |
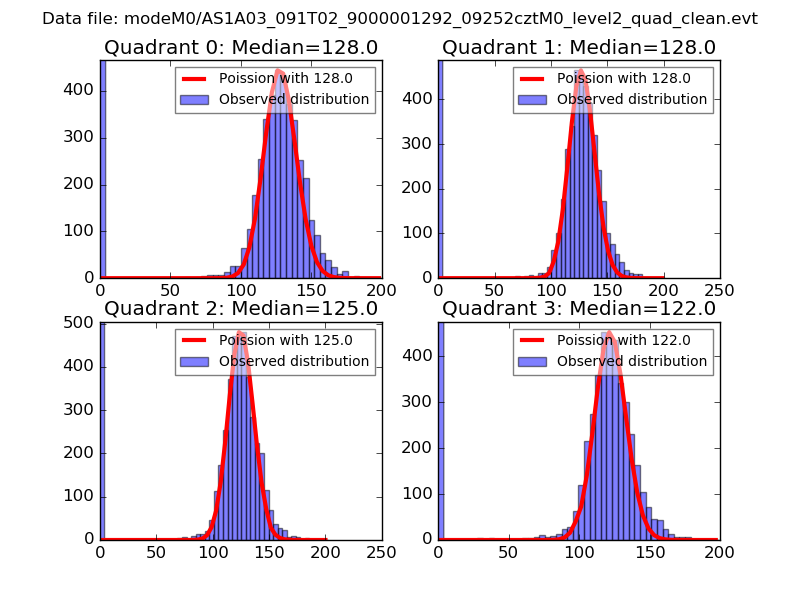 |
 |
| Quadrant-wise count rates Data is divided into 100 sec bins |
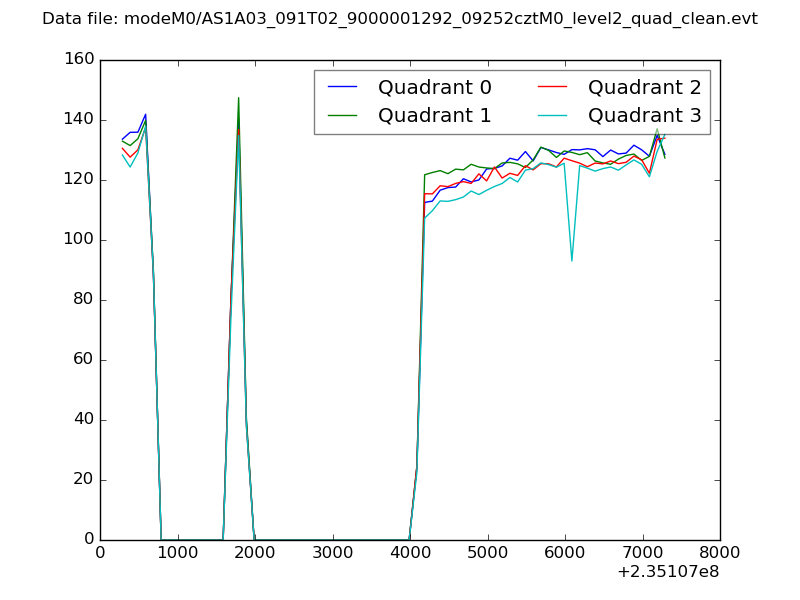 |
|
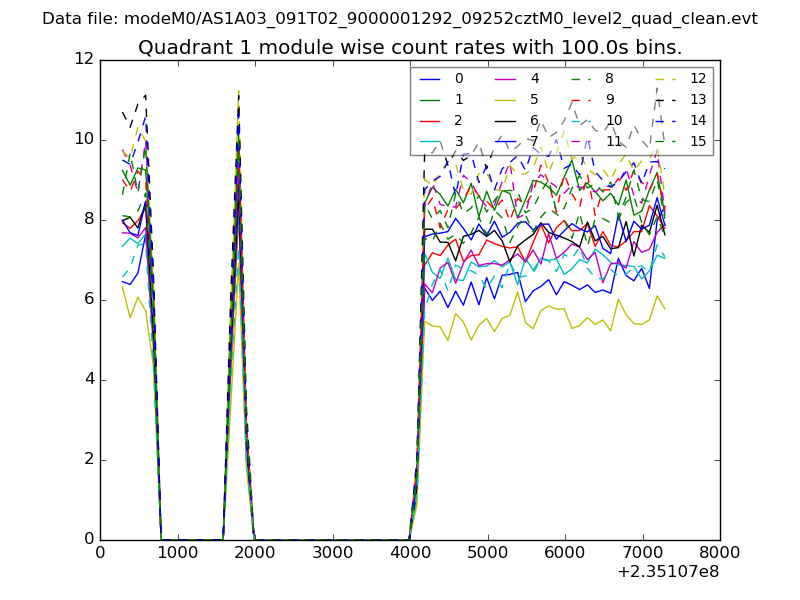
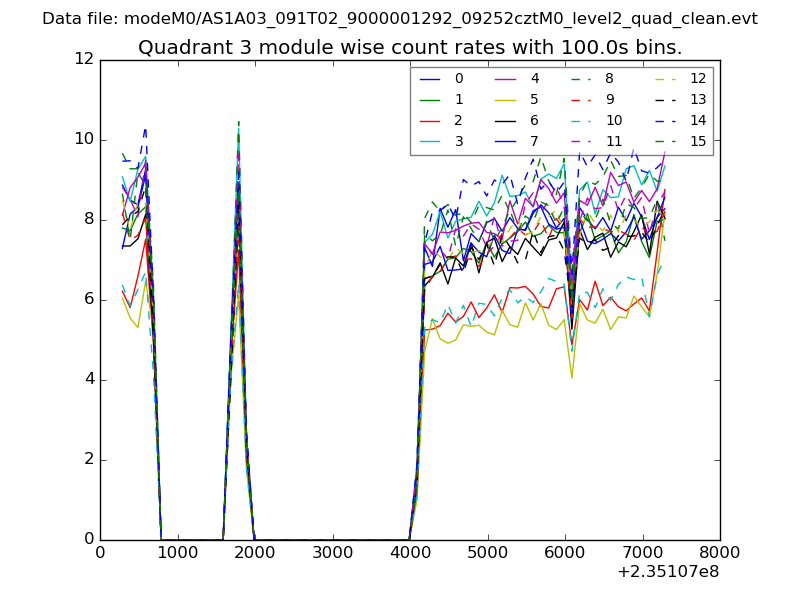
| Module-wise count rates for Quadrant A Data is divided into 100 sec bins |
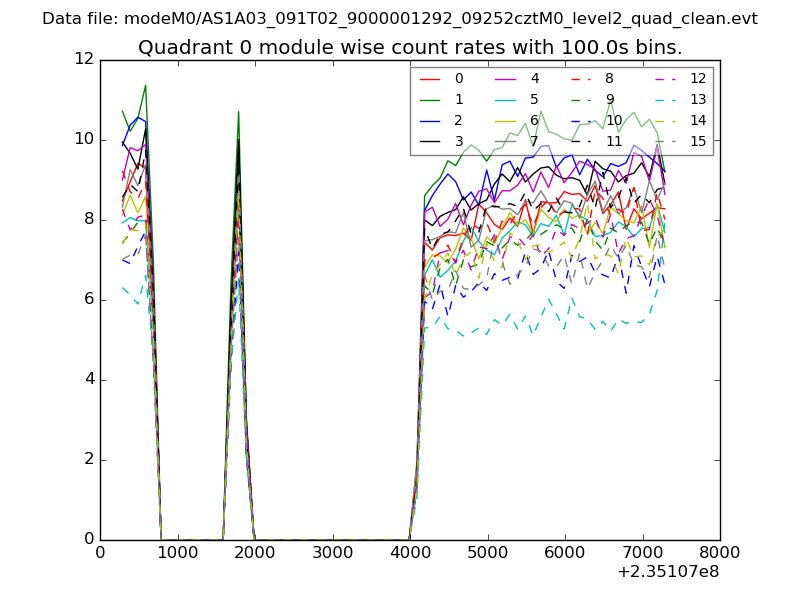 |
 |
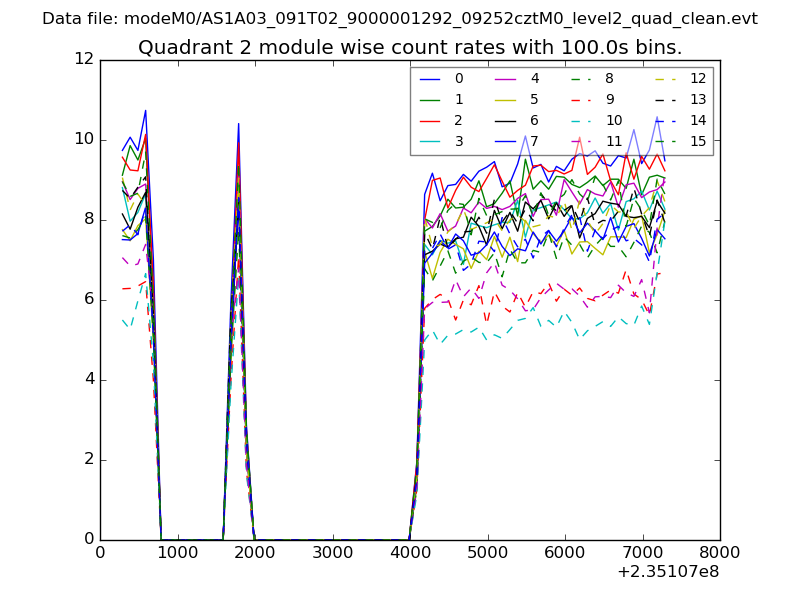
| Module-wise count rates for Quadrant B Data is divided into 100 sec bins |
 |
 |
| Module-wise count rates for Quadrant C Data is divided into 100 sec bins |
 |
 |
| Module-wise count rates for Quadrant D Data is divided into 100 sec bins |
 |
 |
| Parameter | Plot |
|---|---|
| CZT HV Monitor | 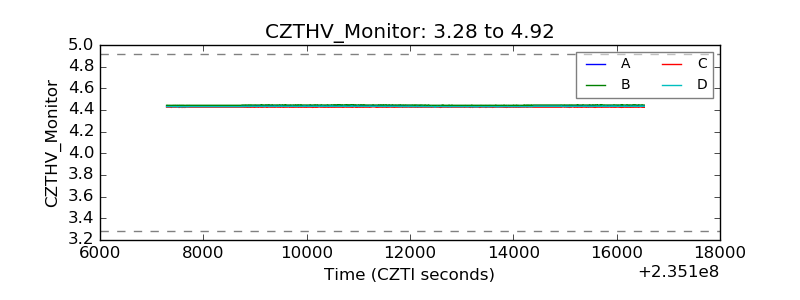 |
| D_VDD | 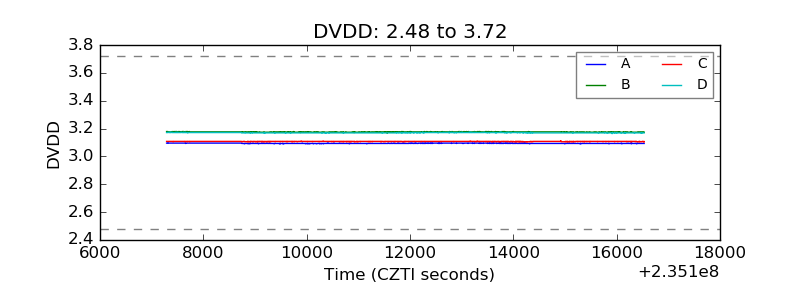 |
| Temperature 1 | 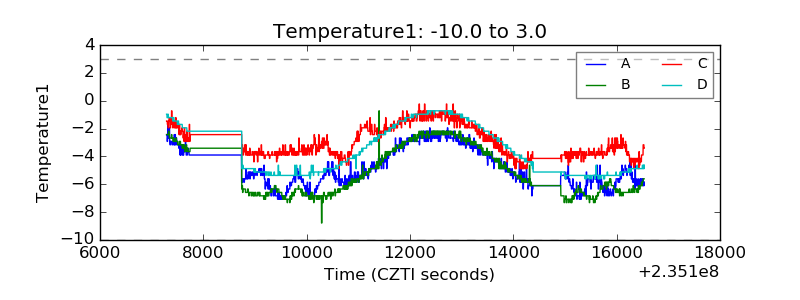 |
| Veto HV Monitor | 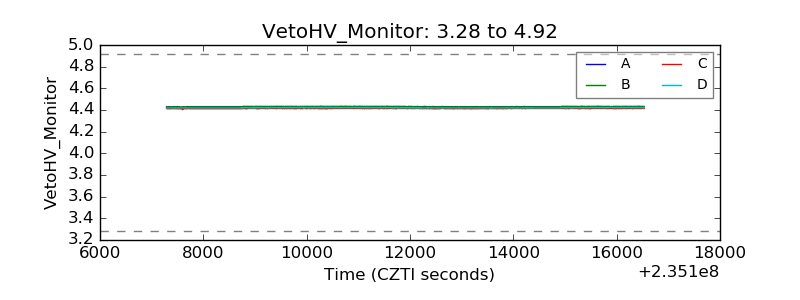 |
| Veto LLD | 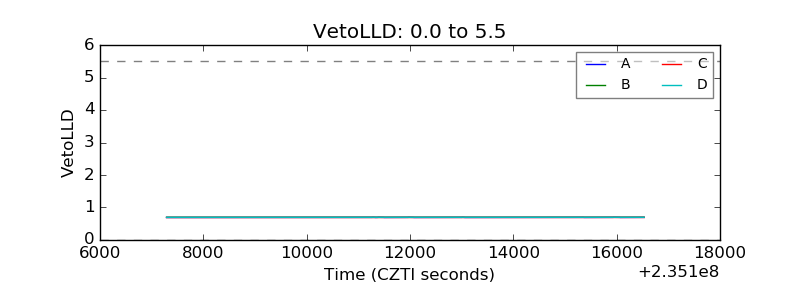 |
| Alpha Counter | 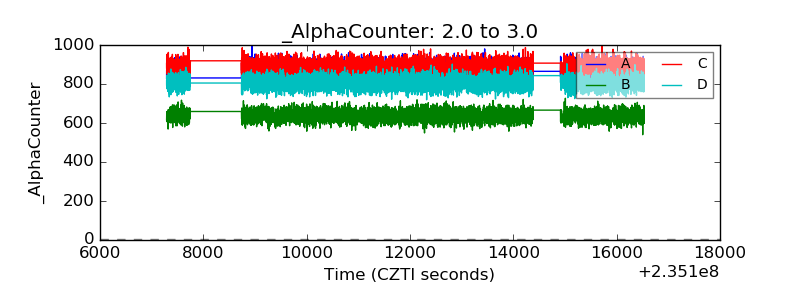 |
| _CPM_Rate | 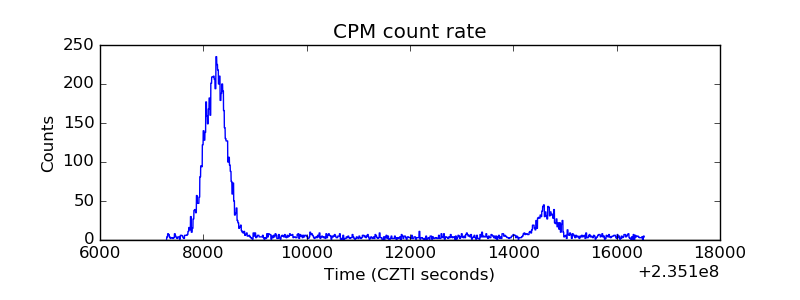 |
| CZT Counter | 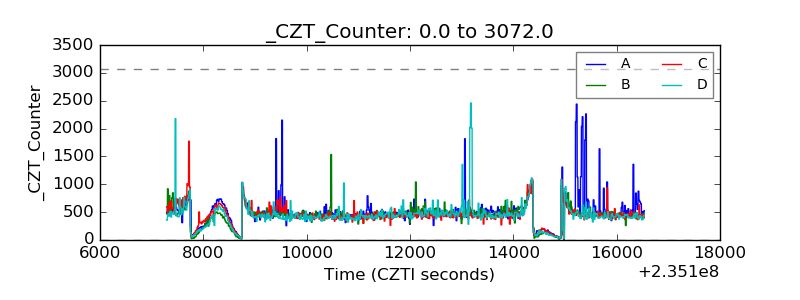 |
| +2.5 Volts monitor |  |
| +5 Volts monitor |  |
| _ROLL_ROT | 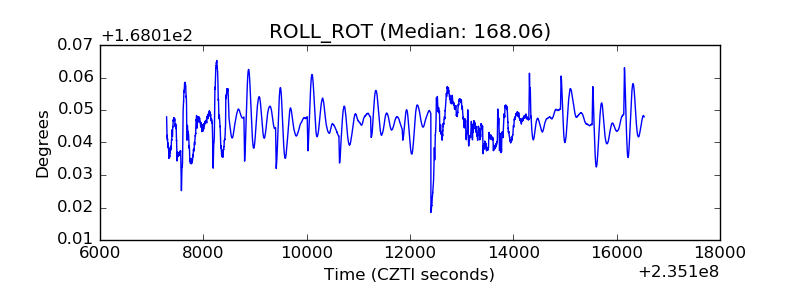 |
| _Roll_DEC |  |
| _Roll_RA | 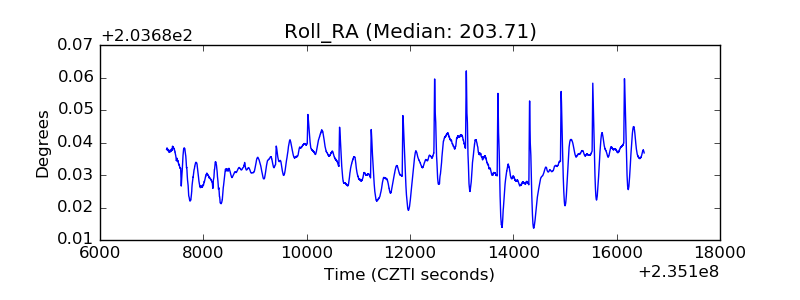 |
| Veto Counter | 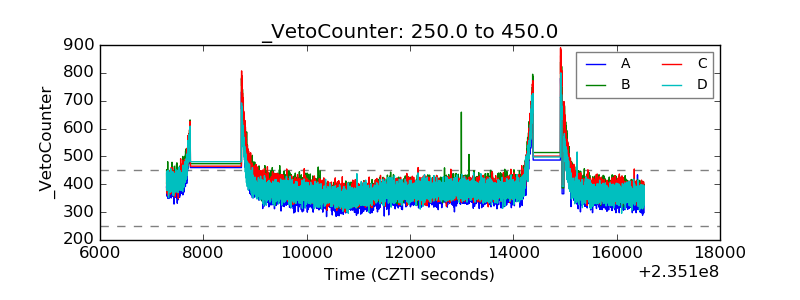 |