| Param | Original file | Final file |
|---|---|---|
| Filename | modeM0/AS1A03_091T02_9000001292_09253cztM0_level2.evt | modeM0/AS1A03_091T02_9000001292_09253cztM0_level2_quad_clean.evt |
| Size (bytes) | 206,159,040 | 32,313,600 |
| Size | 196.6 MB | 30.8 MB |
| Events in quadrant A | 1,713,543 | 193,214 |
| Events in quadrant B | 1,494,692 | 191,989 |
| Events in quadrant C | 1,388,841 | 184,945 |
| Events in quadrant D | 1,428,999 | 183,044 |
| Mode M0 | |||
|---|---|---|---|
| Quadrant | BADHDUFLAG | Total packets | Discarded packets |
| A | 0 | 10013 | 2976 |
| B | 0 | 9132 | 2632 |
| C | 0 | 8979 | 2590 |
| D | 0 | 9245 | 2700 |
| Mode M9 | |||
|---|---|---|---|
| Quadrant | BADHDUFLAG | Total packets | Discarded packets |
| A | 0 | 4 | 3 |
| B | 0 | 4 | 2 |
| C | 0 | 4 | 3 |
| D | 0 | 5 | 4 |
| Mode SS | |||
|---|---|---|---|
| Quadrant | BADHDUFLAG | Total packets | Discarded packets |
| A | 0 | 88 | 28 |
| B | 0 | 88 | 26 |
| C | 0 | 88 | 22 |
| D | 0 | 88 | 36 |
| Quadrant | Total seconds | Saturated seconds | Saturation percentage |
|---|---|---|---|
| A | 3137 | 79 | 2.518330% |
| B | 3175 | 16 | 0.503937% |
| C | 3156 | 15 | 0.475285% |
| D | 3172 | 14 | 0.441362% |
Noise dominated data is calculated using 1-second bins in cleaned event files. If a bin has >2000 counts, and if more than 50% of those come from <1% of pixels, then it is considered to be noise-dominated and hence unusable.
| Quadrant | # 1 sec bins | Bins with >0 counts | Bins with >2000 counts | High rate bins dominated by noise | Noise dominated (total time) | Noise dominated (detector-on time) | Marked lightcurve |
|---|---|---|---|---|---|---|---|
| A | 4448 | 3748 | 49 | 49 | 1.10% | 1.31% | 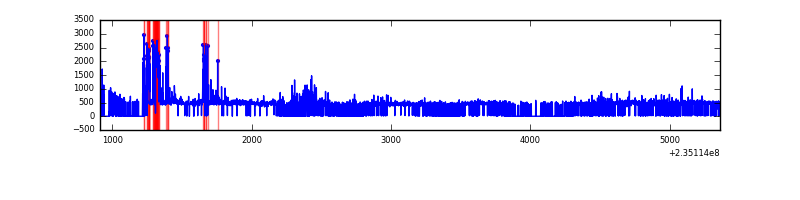 |
| B | 4448 | 3789 | 1 | 1 | 0.02% | 0.03% | 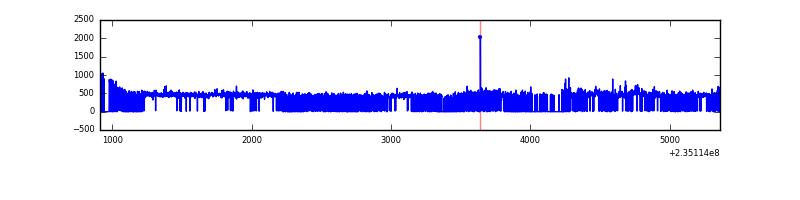 |
| C | 4447 | 3797 | 0 | 0 | 0.00% | 0.00% | 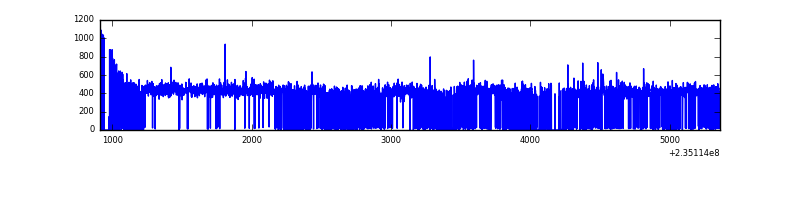 |
| D | 4445 | 3777 | 0 | 0 | 0.00% | 0.00% |  |
Top three noisy pixels from each quadrant. If the there are fewer than three noisy pixels in the level2.evt file, extra rows are filled as -1
| Pixel properties | Quadrant properties | ||||||
|---|---|---|---|---|---|---|---|
| Quadrant | DetID | PixID | Counts | Sigma | Mean | Median | Sigma |
| A | 8 | 5 | 291209 | 3792.71 | 361 | 353 | 76.7 |
| A | 1 | 162 | 17946 | 229.41 | 361 | 353 | 76.7 |
| A | 15 | 174 | 5351 | 65.17 | 361 | 353 | 76.7 |
| B | 0 | 214 | 19644 | 265.43 | 370 | 362 | 72.6 |
| B | 0 | 187 | 15296 | 205.58 | 370 | 362 | 72.6 |
| B | 4 | 173 | 10314 | 137.0 | 370 | 362 | 72.6 |
| C | 9 | 68 | 7037 | 79.88 | 353 | 354 | 83.7 |
| C | 13 | 61 | 2684 | 27.85 | 353 | 354 | 83.7 |
| C | 8 | 222 | 1895 | 18.42 | 353 | 354 | 83.7 |
| D | 1 | 52 | 25681 | 275.17 | 353 | 343 | 92.1 |
| D | 2 | 136 | 23501 | 251.49 | 353 | 343 | 92.1 |
| D | 7 | 71 | 15203 | 161.38 | 353 | 343 | 92.1 |
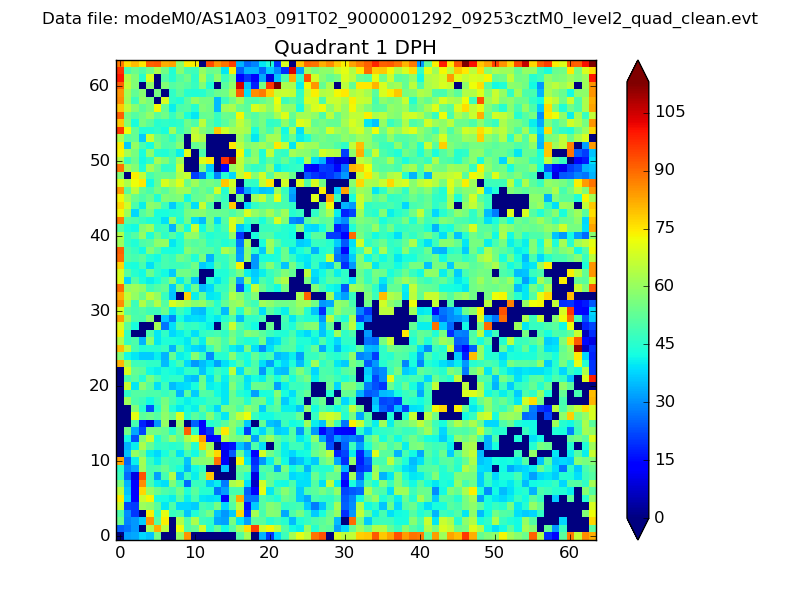
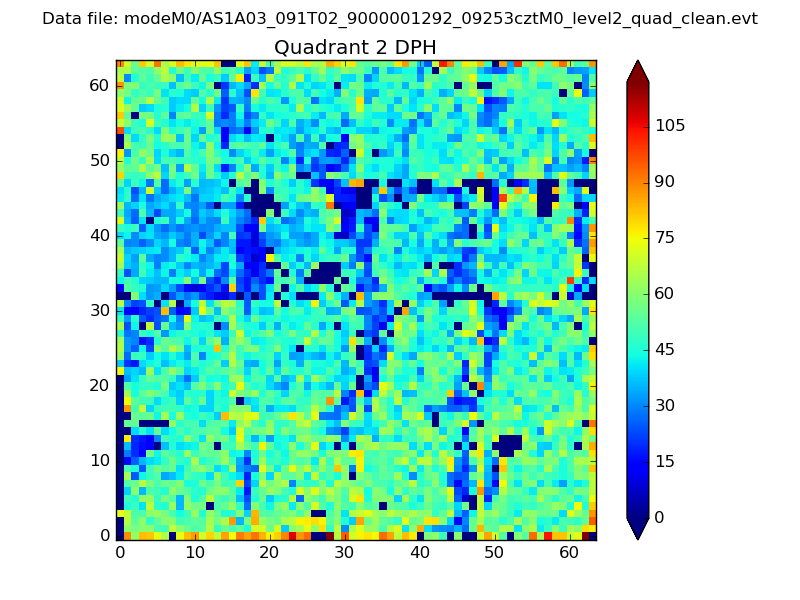
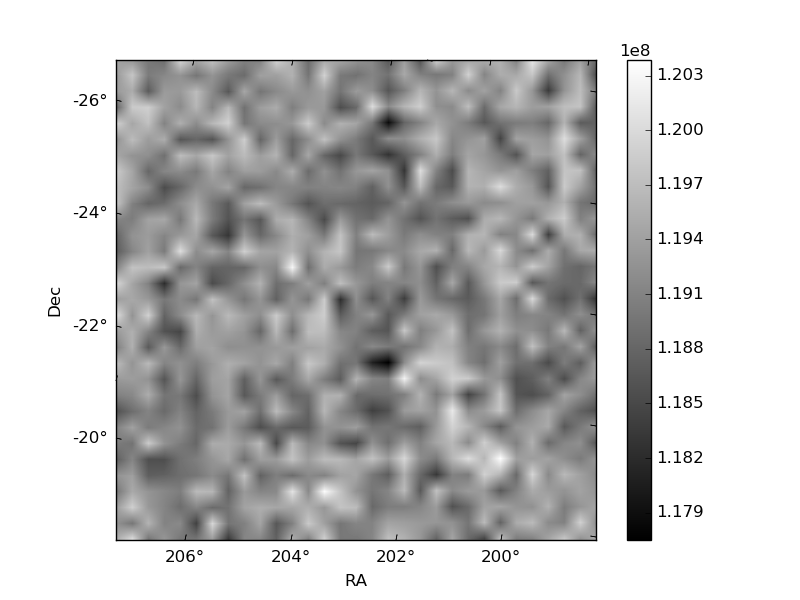
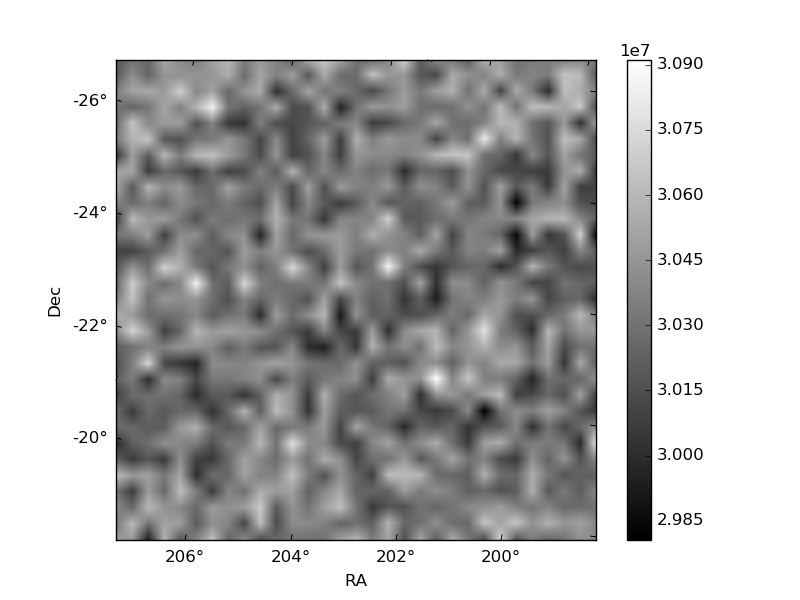
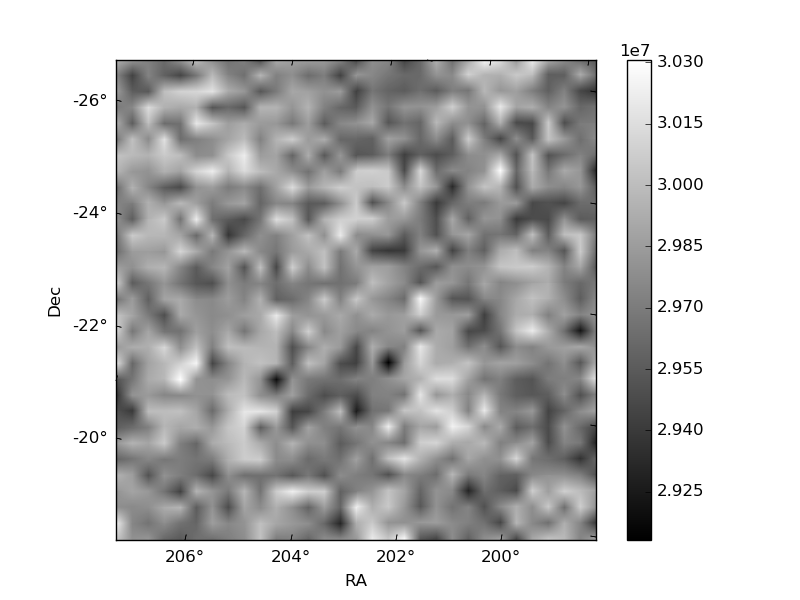
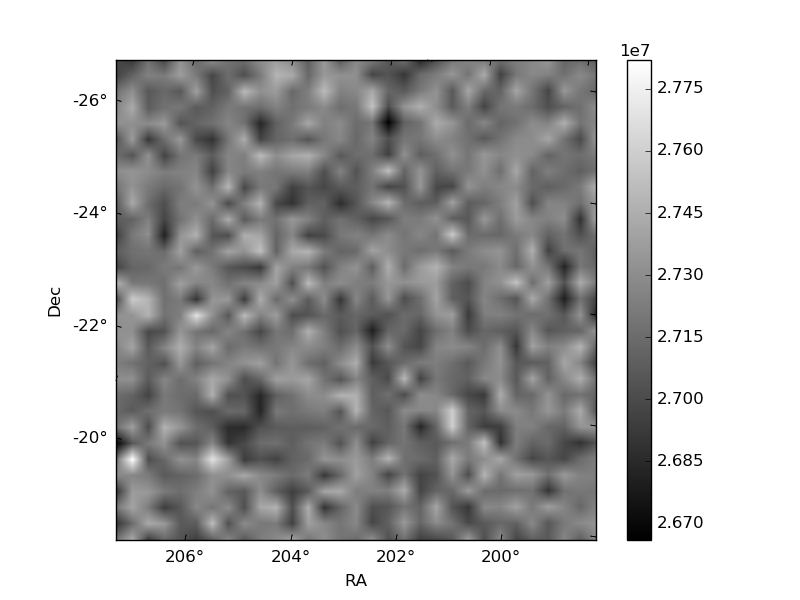
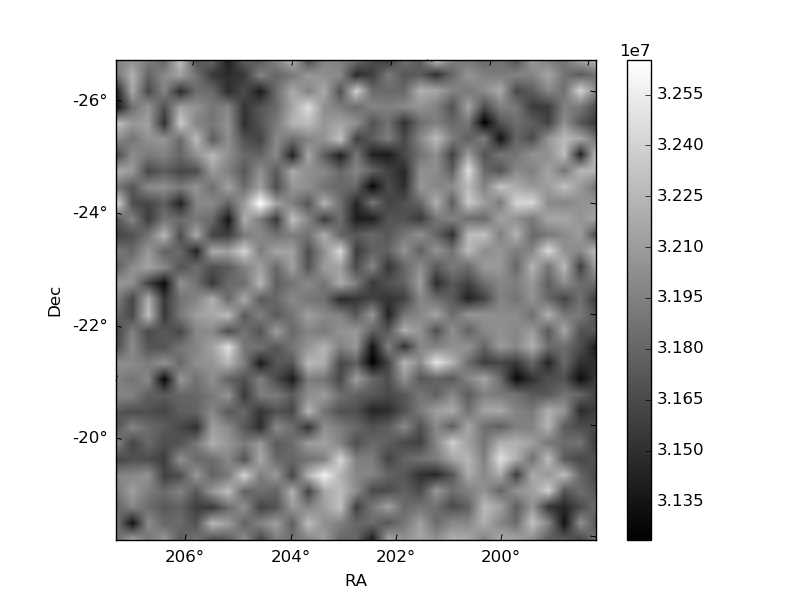
Histogram calculated using DETX and DETY for each event in the final _common_clean file
| Quadrant A | 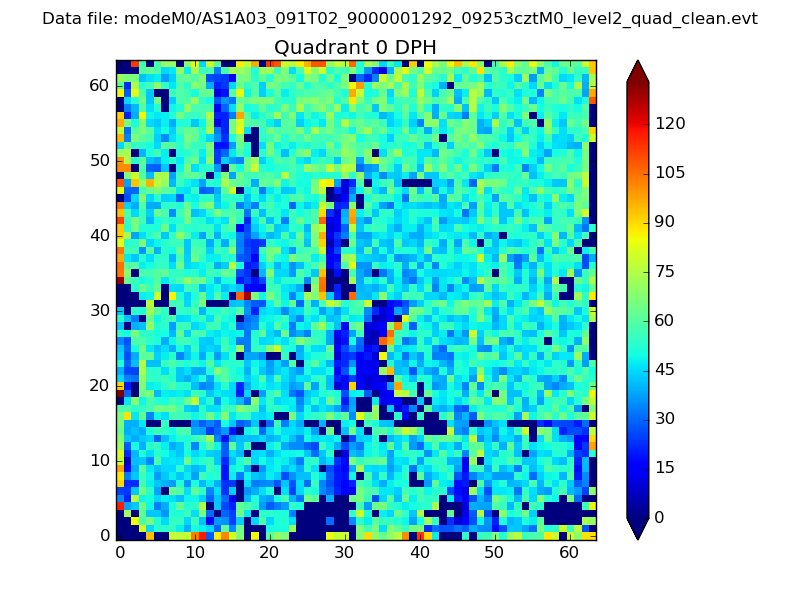 |
 |
Quadrant B |
|---|---|---|---|
| Quadrant D | 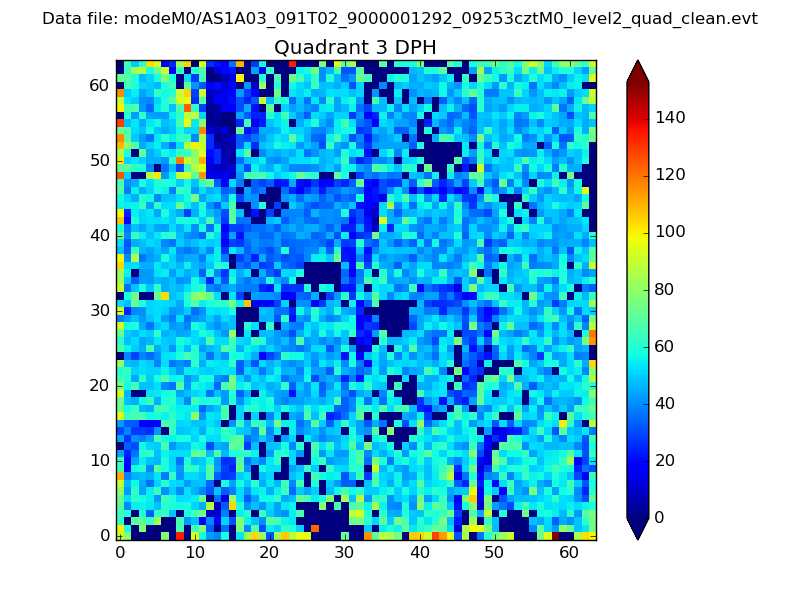 |
 |
Quadrant C |
| Plot type | Count rate plots | Images |
|---|---|---|
| Comparison with Poisson distribution Blue bars denote a histogram of data divided into 1 sec bins. Red curve is a Poisson curve with rate = median count rate of data. |
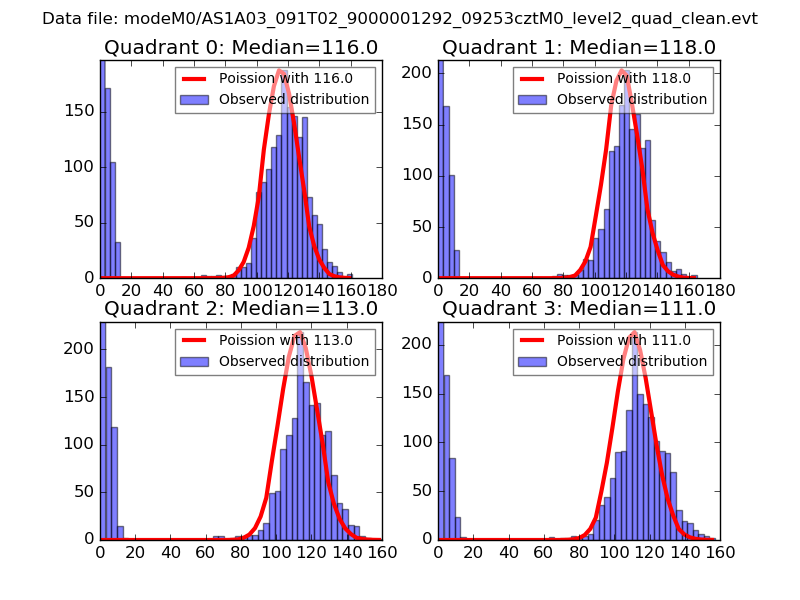 |
 |
| Quadrant-wise count rates Data is divided into 100 sec bins |
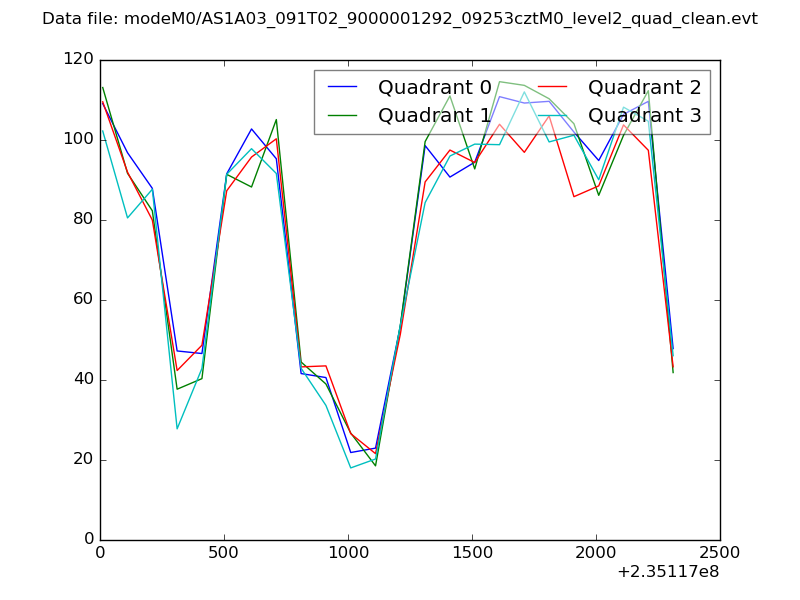 |
|
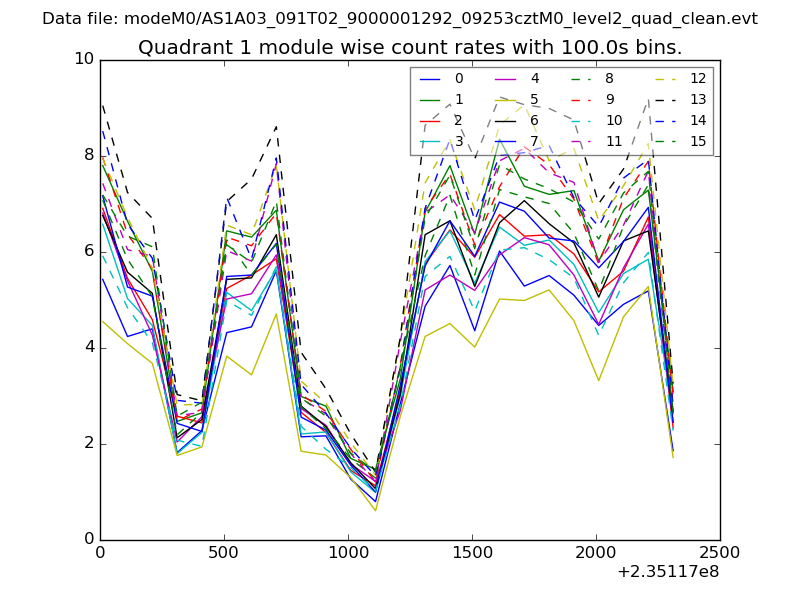
| Module-wise count rates for Quadrant A Data is divided into 100 sec bins |
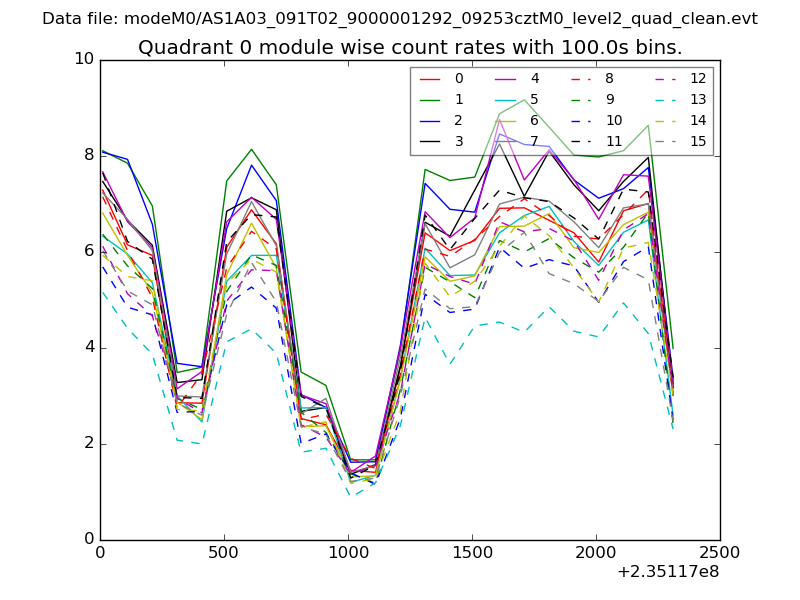 |
 |
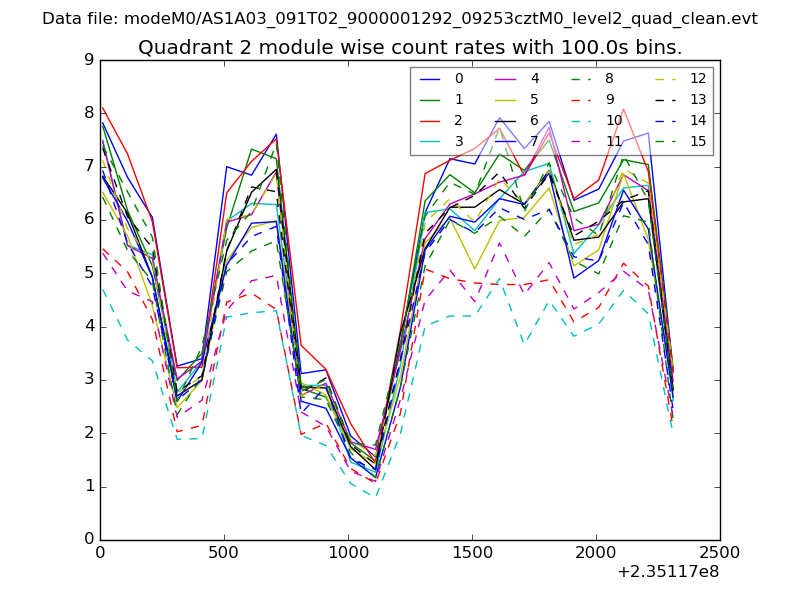
| Module-wise count rates for Quadrant B Data is divided into 100 sec bins |
 |
 |
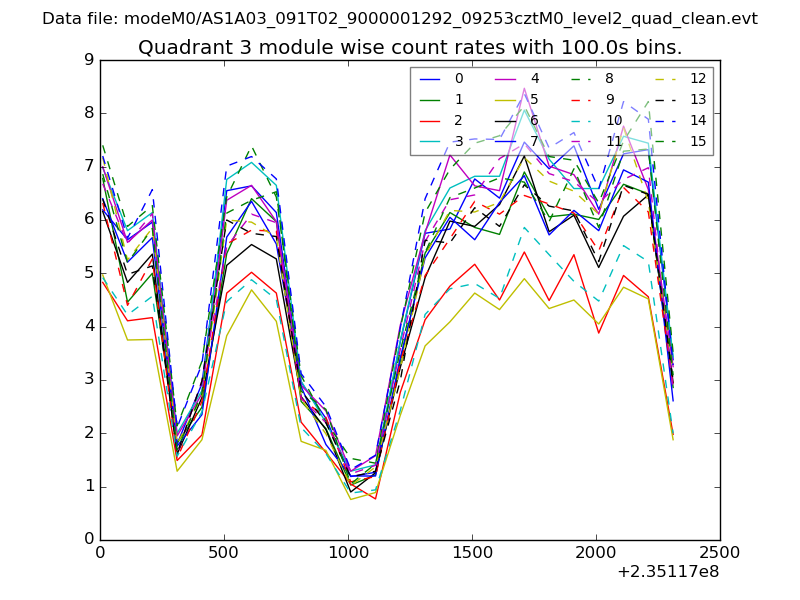
| Module-wise count rates for Quadrant C Data is divided into 100 sec bins |
 |
 |
| Module-wise count rates for Quadrant D Data is divided into 100 sec bins |
 |
 |
| Parameter | Plot |
|---|---|
| CZT HV Monitor | 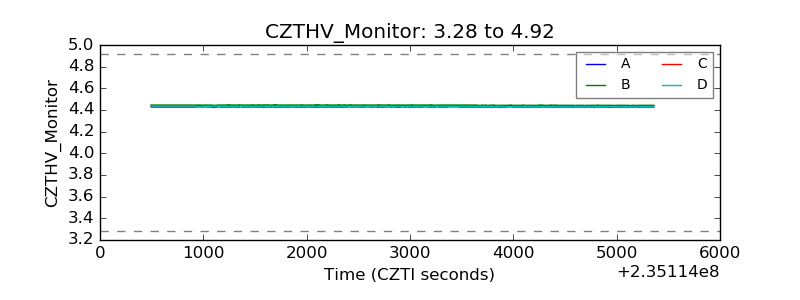 |
| D_VDD | 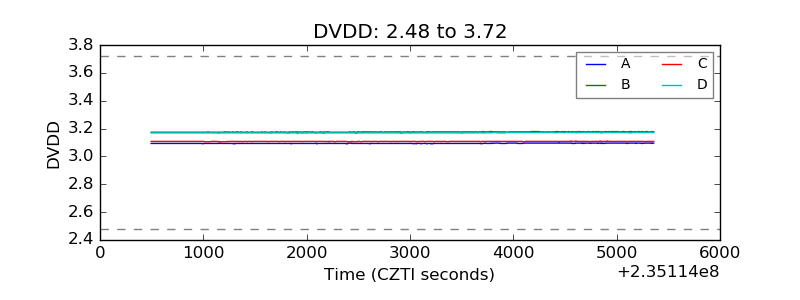 |
| Temperature 1 | 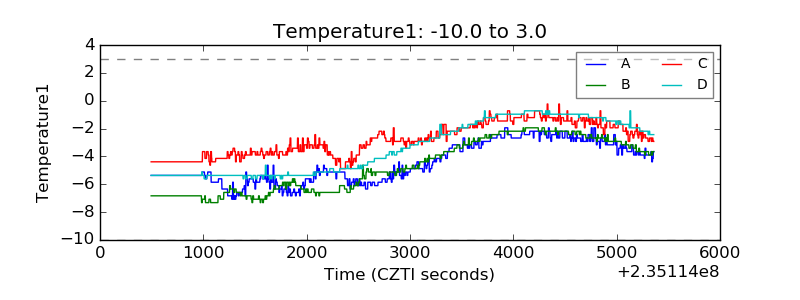 |
| Veto HV Monitor | 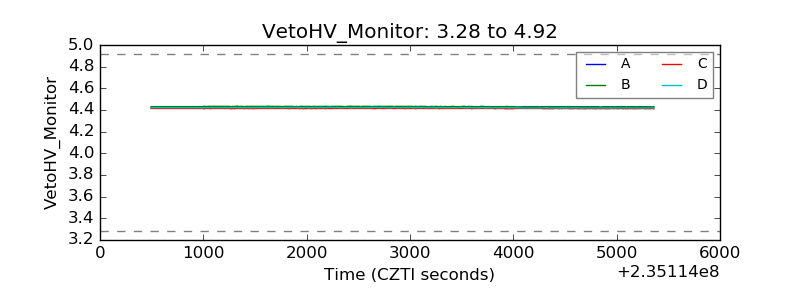 |
| Veto LLD | 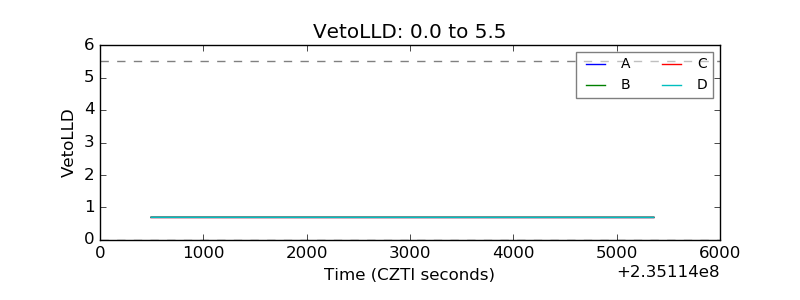 |
| Alpha Counter | 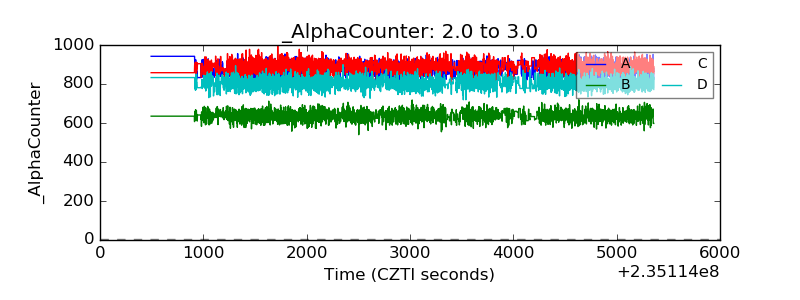 |
| _CPM_Rate | 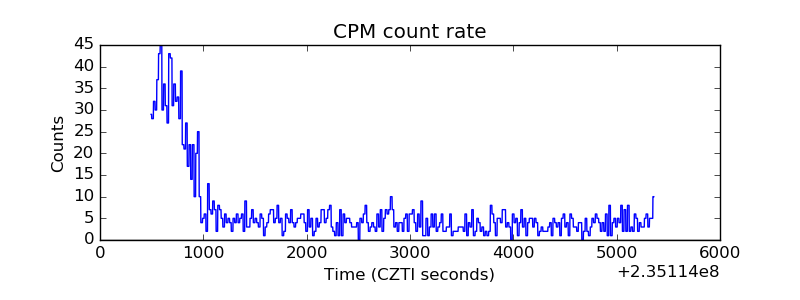 |
| CZT Counter | 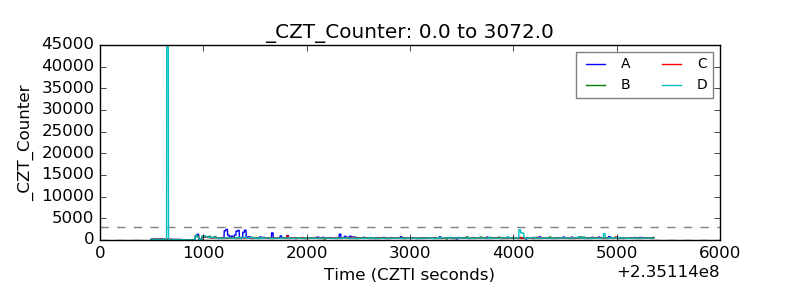 |
| +2.5 Volts monitor |  |
| +5 Volts monitor | 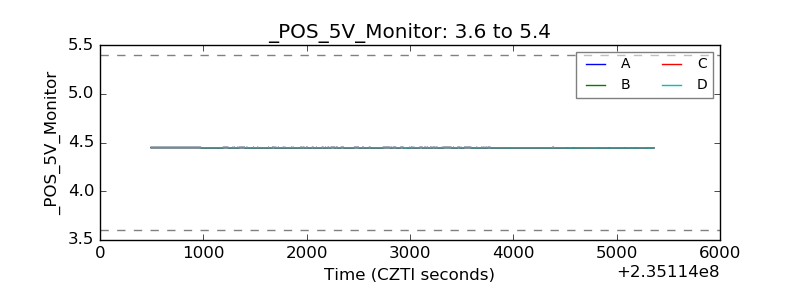 |
| _ROLL_ROT | 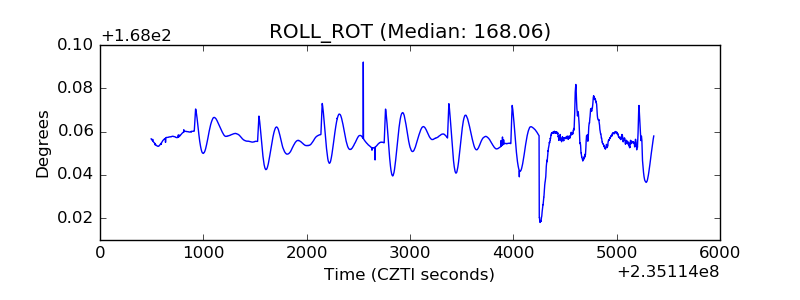 |
| _Roll_DEC | 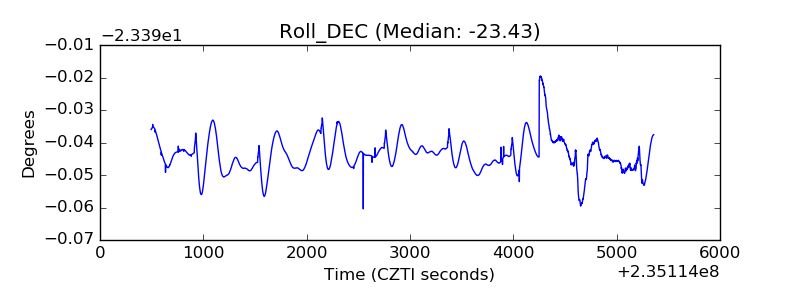 |
| _Roll_RA | 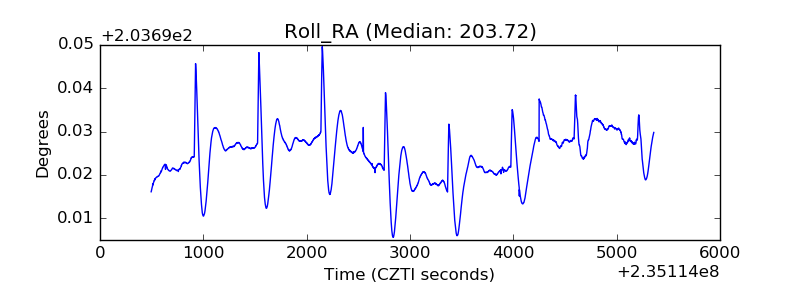 |
| Veto Counter | 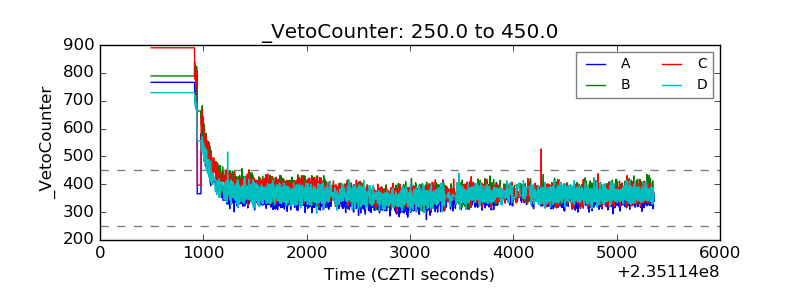 |