| Param | Original file | Final file |
|---|---|---|
| Filename | modeM0/AS1A03_091T02_9000001292_09254cztM0_level2.evt | modeM0/AS1A03_091T02_9000001292_09254cztM0_level2_quad_clean.evt |
| Size (bytes) | 220,760,640 | 44,904,960 |
| Size | 210.5 MB | 42.8 MB |
| Events in quadrant A | 1,728,407 | 281,263 |
| Events in quadrant B | 1,642,763 | 285,622 |
| Events in quadrant C | 1,508,193 | 275,633 |
| Events in quadrant D | 1,567,114 | 269,587 |
| Mode M0 | |||
|---|---|---|---|
| Quadrant | BADHDUFLAG | Total packets | Discarded packets |
| A | 0 | 7344 | 31 |
| B | 0 | 7195 | 36 |
| C | 0 | 7054 | 47 |
| D | 0 | 7223 | 49 |
| Mode SS | |||
|---|---|---|---|
| Quadrant | BADHDUFLAG | Total packets | Discarded packets |
| A | 0 | 70 | 0 |
| B | 0 | 70 | 0 |
| C | 0 | 70 | 0 |
| D | 0 | 70 | 0 |
| Quadrant | Total seconds | Saturated seconds | Saturation percentage |
|---|---|---|---|
| A | 3494 | 8 | 0.228964% |
| B | 3491 | 4 | 0.114580% |
| C | 3485 | 2 | 0.057389% |
| D | 3487 | 10 | 0.286779% |
Noise dominated data is calculated using 1-second bins in cleaned event files. If a bin has >2000 counts, and if more than 50% of those come from <1% of pixels, then it is considered to be noise-dominated and hence unusable.
| Quadrant | # 1 sec bins | Bins with >0 counts | Bins with >2000 counts | High rate bins dominated by noise | Noise dominated (total time) | Noise dominated (detector-on time) | Marked lightcurve |
|---|---|---|---|---|---|---|---|
| A | 3509 | 3509 | 2 | 2 | 0.06% | 0.06% | 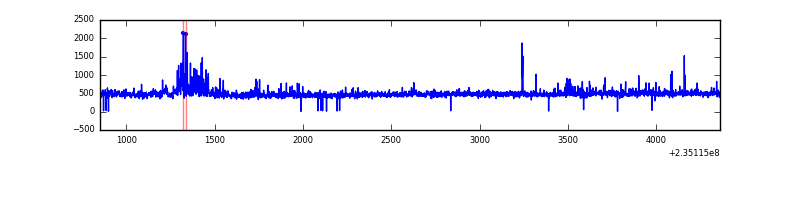 |
| B | 3509 | 3507 | 3 | 3 | 0.09% | 0.09% |  |
| C | 3509 | 3508 | 1 | 1 | 0.03% | 0.03% | 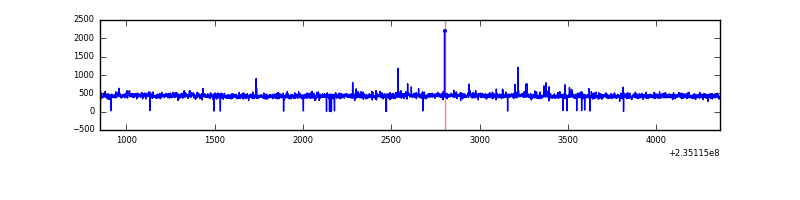 |
| D | 3509 | 3508 | 11 | 11 | 0.31% | 0.31% |  |
Top three noisy pixels from each quadrant. If the there are fewer than three noisy pixels in the level2.evt file, extra rows are filled as -1
| Pixel properties | Quadrant properties | ||||||
|---|---|---|---|---|---|---|---|
| Quadrant | DetID | PixID | Counts | Sigma | Mean | Median | Sigma |
| A | 8 | 5 | 160377 | 1893.9 | 399 | 391 | 84.5 |
| A | 1 | 162 | 19591 | 227.29 | 399 | 391 | 84.5 |
| A | 0 | 226 | 3743 | 39.68 | 399 | 391 | 84.5 |
| B | 0 | 214 | 45976 | 589.86 | 397 | 389 | 77.3 |
| B | 4 | 173 | 18673 | 236.58 | 397 | 389 | 77.3 |
| B | 0 | 187 | 18441 | 233.58 | 397 | 389 | 77.3 |
| C | 9 | 68 | 15132 | 164.16 | 382 | 383 | 89.8 |
| C | 13 | 61 | 2912 | 28.15 | 382 | 383 | 89.8 |
| C | 8 | 222 | 2044 | 18.49 | 382 | 383 | 89.8 |
| D | 10 | 199 | 38091 | 383.69 | 383 | 373 | 98.3 |
| D | 2 | 136 | 20519 | 204.94 | 383 | 373 | 98.3 |
| D | 7 | 71 | 20420 | 203.93 | 383 | 373 | 98.3 |
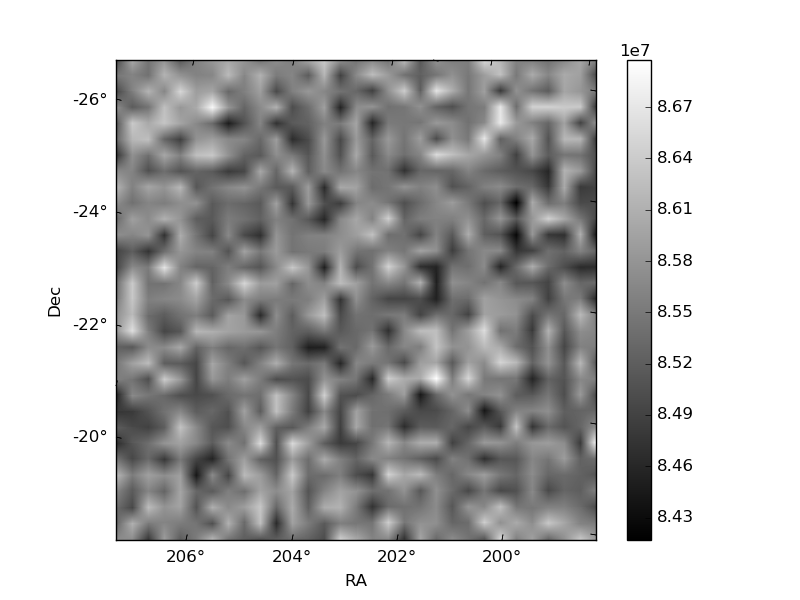
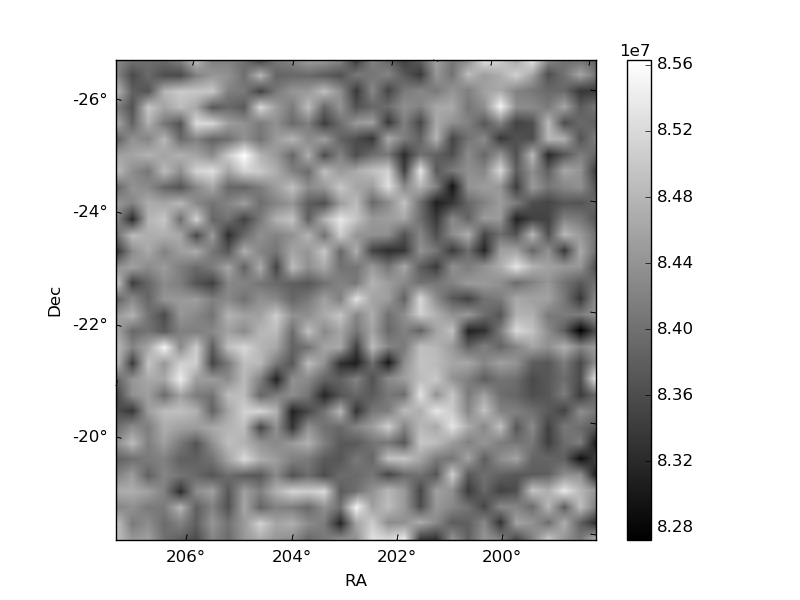
Histogram calculated using DETX and DETY for each event in the final _common_clean file
| Quadrant A | 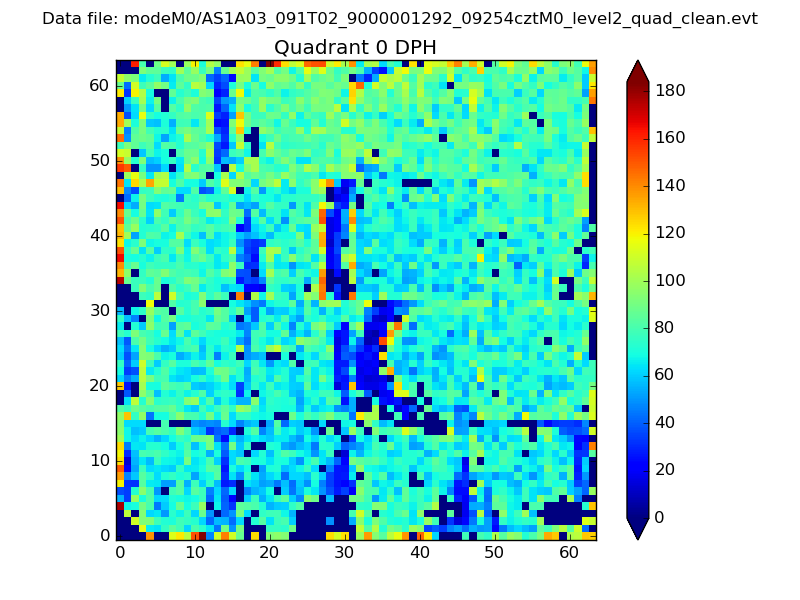 |
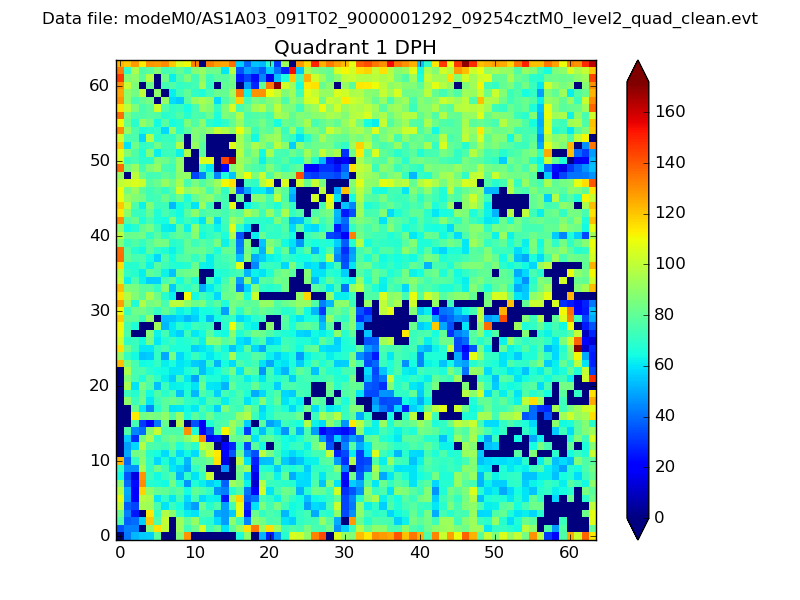 |
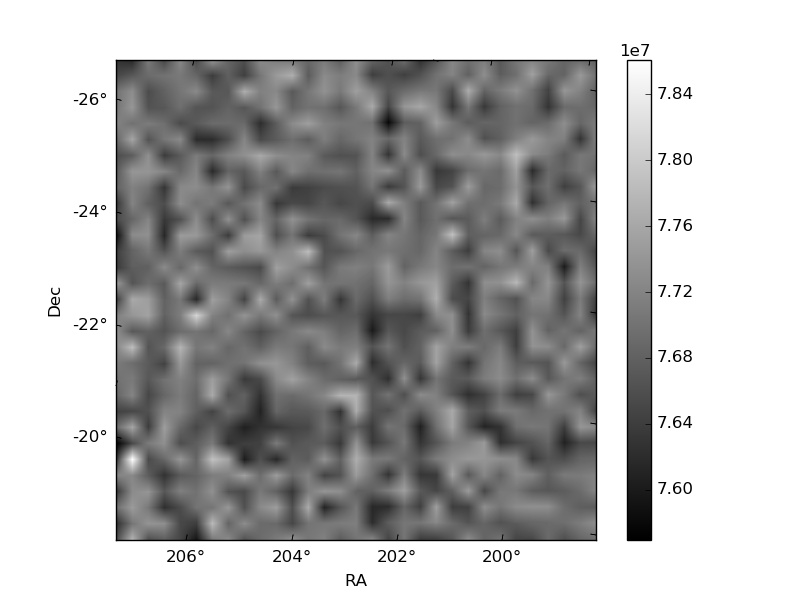
Quadrant B |
|---|---|---|---|
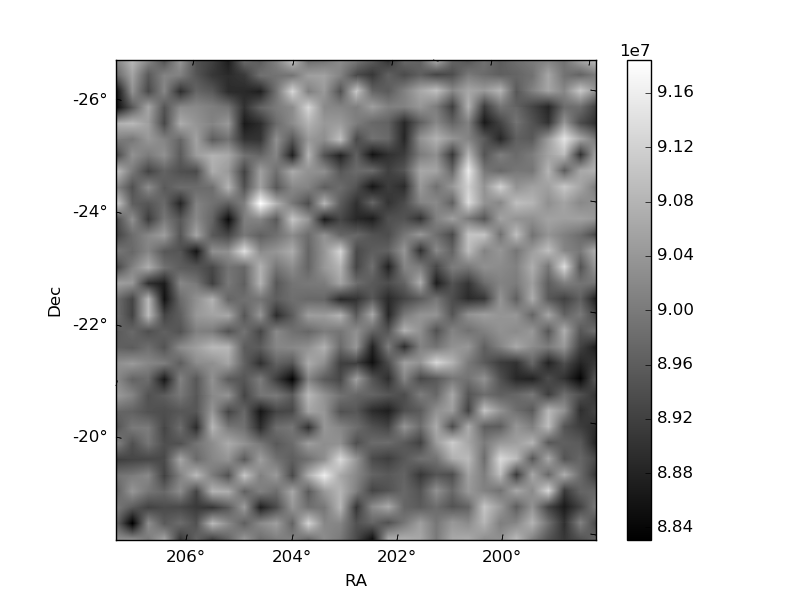
| Quadrant D |  |
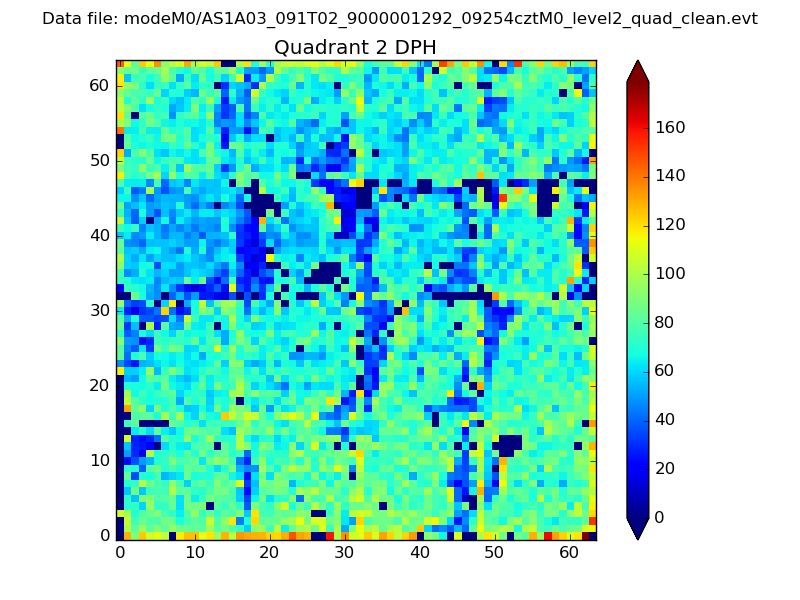 |
Quadrant C |
| Plot type | Count rate plots | Images |
|---|---|---|
| Comparison with Poisson distribution Blue bars denote a histogram of data divided into 1 sec bins. Red curve is a Poisson curve with rate = median count rate of data. |
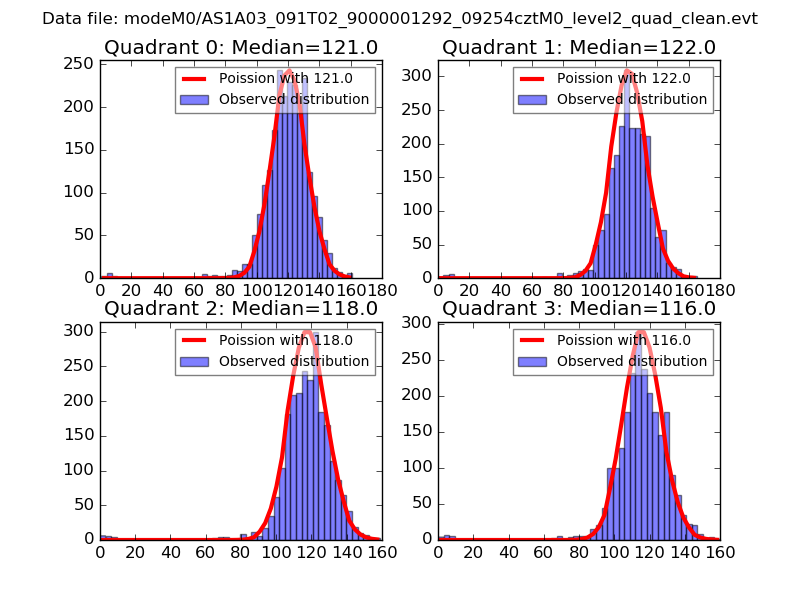 |
 |
| Quadrant-wise count rates Data is divided into 100 sec bins |
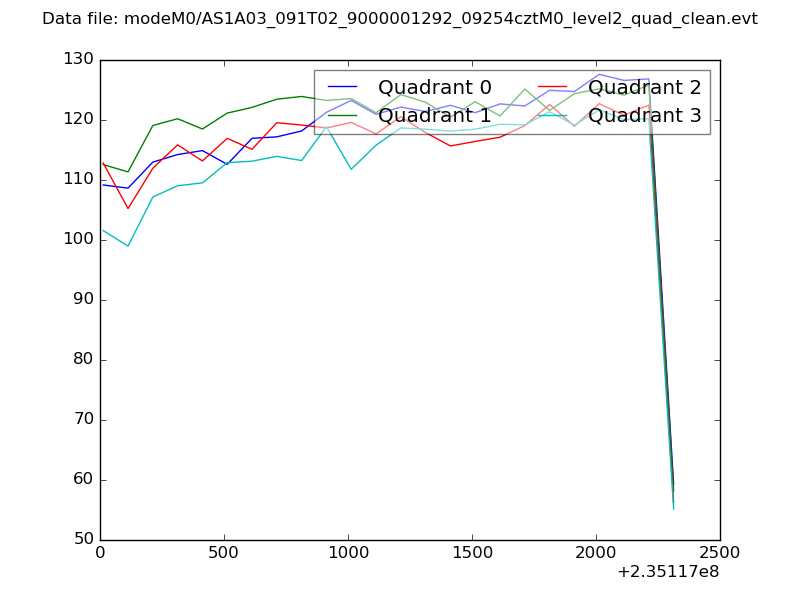 |
|
| Module-wise count rates for Quadrant A Data is divided into 100 sec bins |
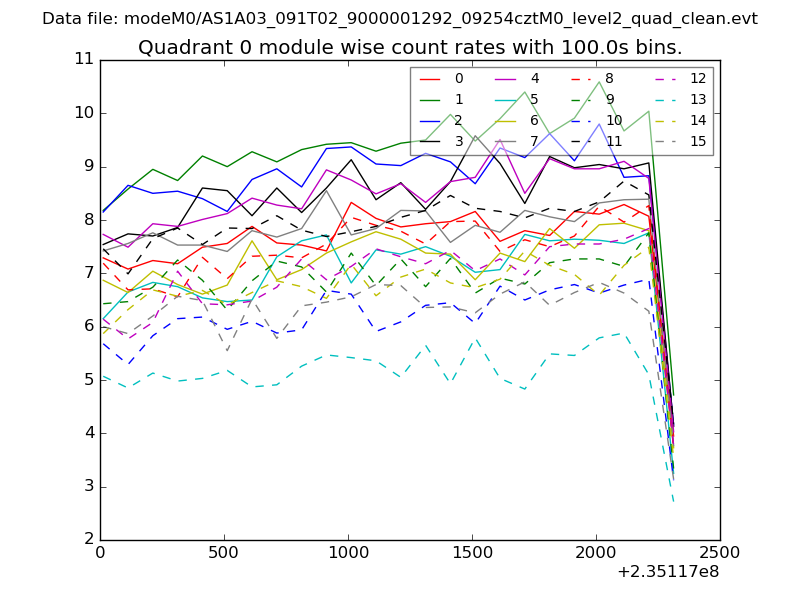 |
 |
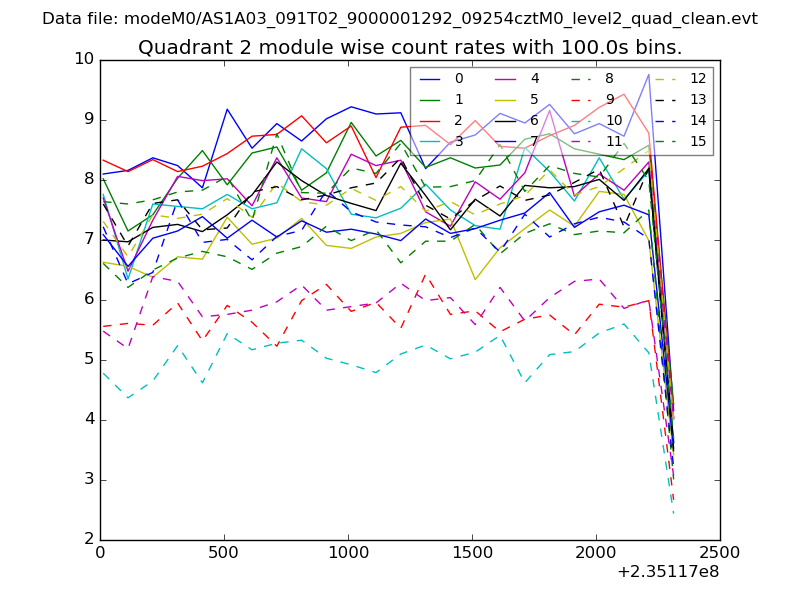
| Module-wise count rates for Quadrant B Data is divided into 100 sec bins |
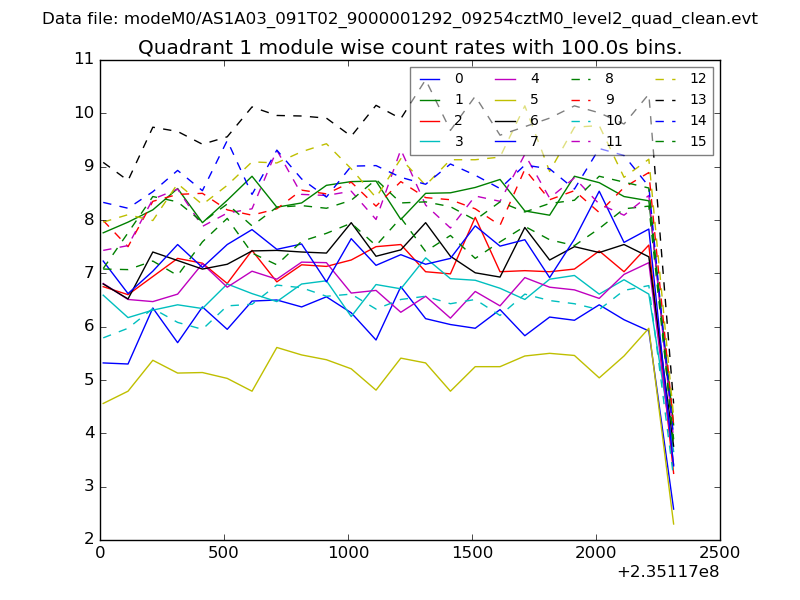 |
 |
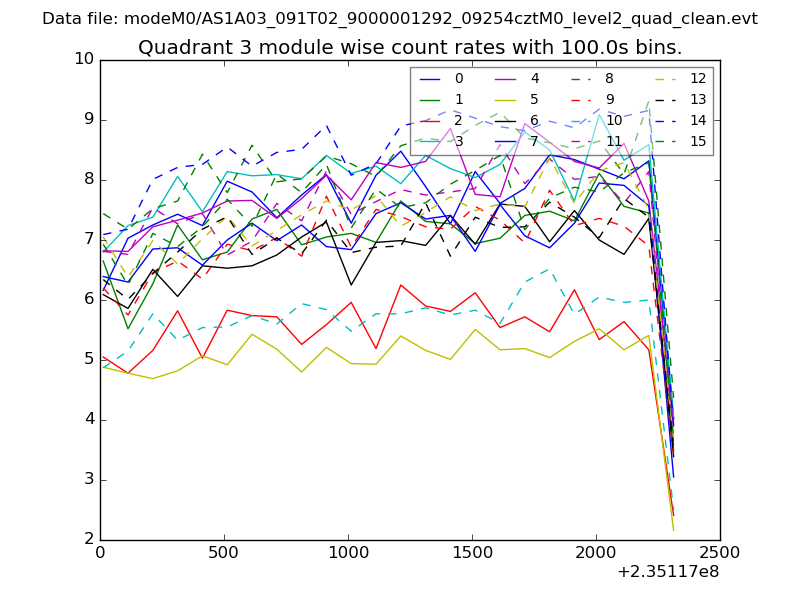
| Module-wise count rates for Quadrant C Data is divided into 100 sec bins |
 |
 |
| Module-wise count rates for Quadrant D Data is divided into 100 sec bins |
 |
 |
| Parameter | Plot |
|---|---|
| CZT HV Monitor | 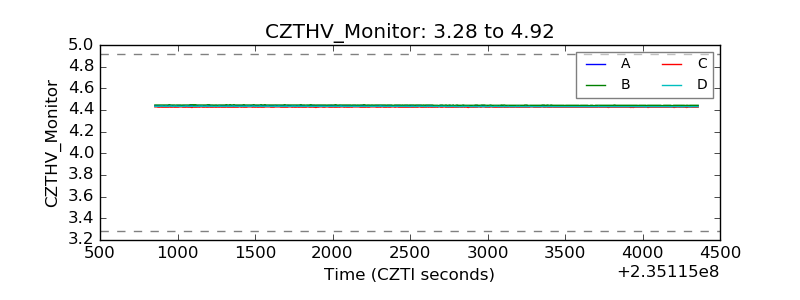 |
| D_VDD | 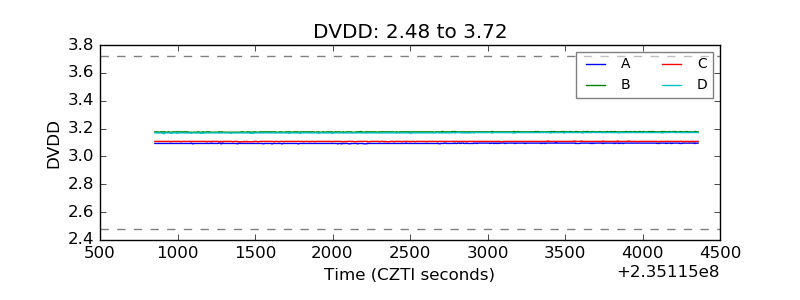 |
| Temperature 1 |  |
| Veto HV Monitor | 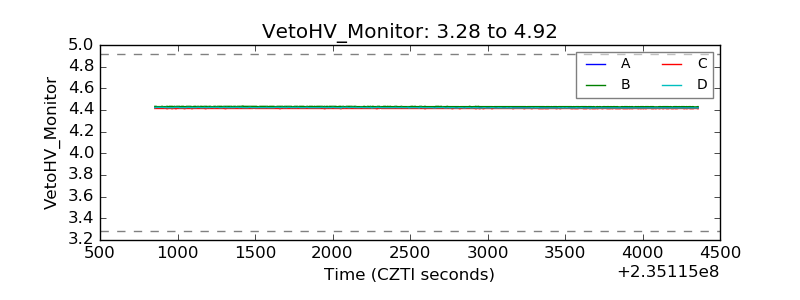 |
| Veto LLD | 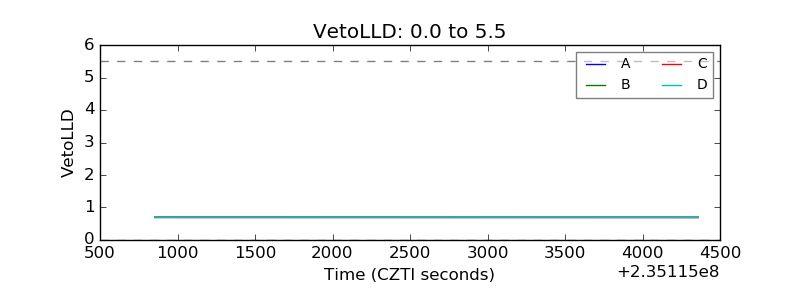 |
| Alpha Counter | 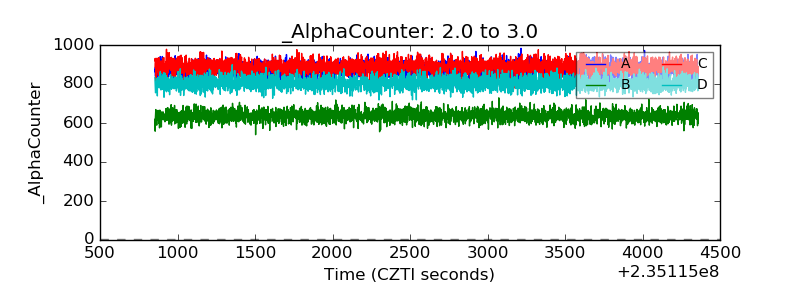 |
| _CPM_Rate | 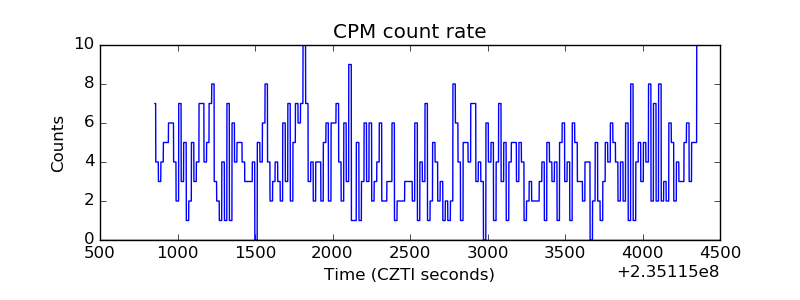 |
| CZT Counter | 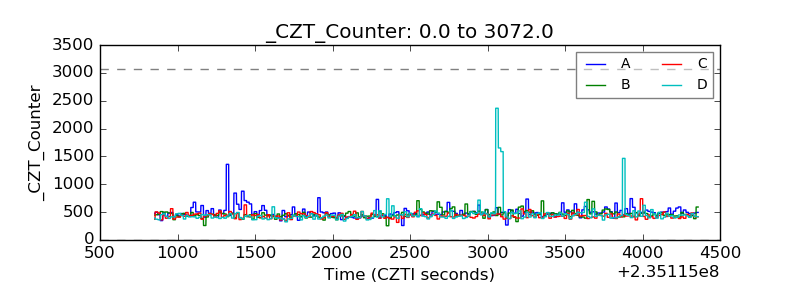 |
| +2.5 Volts monitor |  |
| +5 Volts monitor |  |
| _ROLL_ROT | 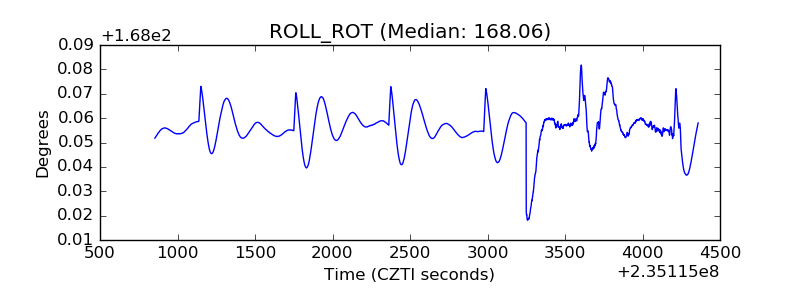 |
| _Roll_DEC | 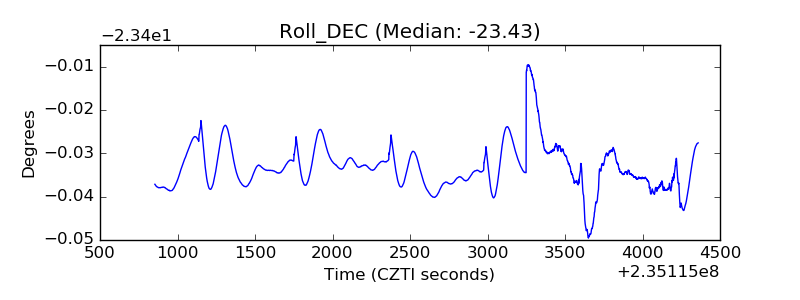 |
| _Roll_RA | 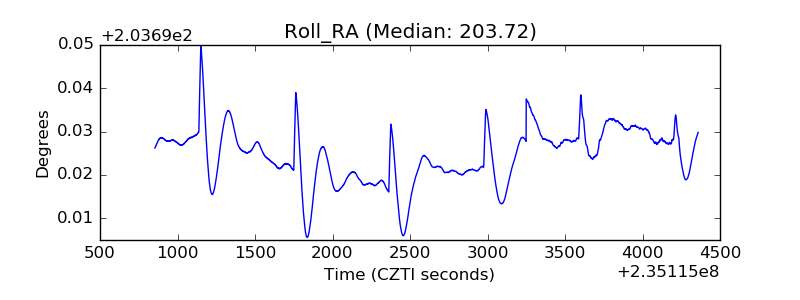 |
| Veto Counter | 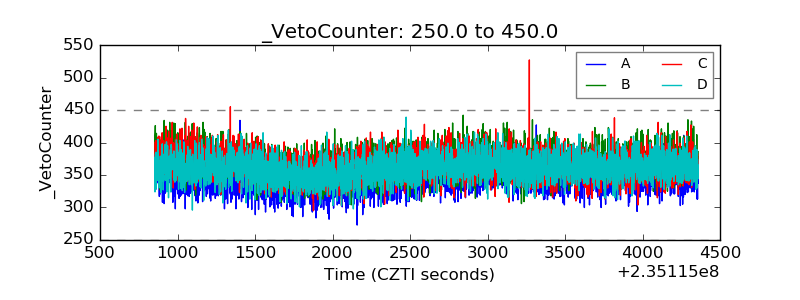 |