| Param | Original file | Final file |
|---|---|---|
| Filename | modeM0/AS1A03_091T02_9000001292_09257cztM0_level2.evt | modeM0/AS1A03_091T02_9000001292_09257cztM0_level2_quad_clean.evt |
| Size (bytes) | 106,957,440 | 14,662,080 |
| Size | 102.0 MB | 14.0 MB |
| Events in quadrant A | 855,135 | 80,469 |
| Events in quadrant B | 791,343 | 84,454 |
| Events in quadrant C | 737,582 | 78,164 |
| Events in quadrant D | 735,318 | 74,149 |
| Mode M0 | |||
|---|---|---|---|
| Quadrant | BADHDUFLAG | Total packets | Discarded packets |
| A | 0 | 7229 | 3616 |
| B | 0 | 7053 | 3566 |
| C | 0 | 6911 | 3492 |
| D | 0 | 7091 | 3659 |
| Mode M9 | |||
|---|---|---|---|
| Quadrant | BADHDUFLAG | Total packets | Discarded packets |
| A | 1 | 273359709408 | 0 |
| B | 1 | -1 | -1 |
| C | 1 | -1 | -1 |
| D | 1 | -1 | -1 |
| Mode SS | |||
|---|---|---|---|
| Quadrant | BADHDUFLAG | Total packets | Discarded packets |
| A | 0 | 70 | 28 |
| B | 0 | 68 | 32 |
| C | 0 | 71 | 33 |
| D | 0 | 68 | 36 |
| Quadrant | Total seconds | Saturated seconds | Saturation percentage |
|---|---|---|---|
| A | 1697 | 6 | 0.353565% |
| B | 1727 | 1 | 0.057904% |
| C | 1705 | 2 | 0.117302% |
| D | 1680 | 5 | 0.297619% |
Noise dominated data is calculated using 1-second bins in cleaned event files. If a bin has >2000 counts, and if more than 50% of those come from <1% of pixels, then it is considered to be noise-dominated and hence unusable.
| Quadrant | # 1 sec bins | Bins with >0 counts | Bins with >2000 counts | High rate bins dominated by noise | Noise dominated (total time) | Noise dominated (detector-on time) | Marked lightcurve |
|---|---|---|---|---|---|---|---|
| A | 3509 | 1936 | 2 | 2 | 0.06% | 0.10% | 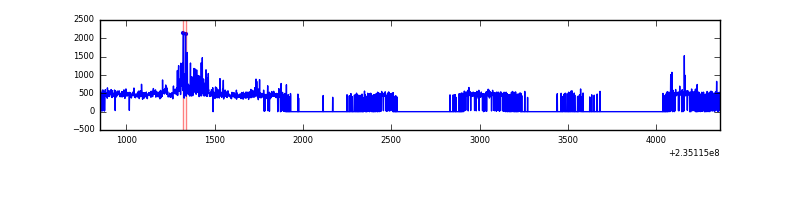 |
| B | 3509 | 1980 | 0 | 0 | 0.00% | 0.00% | 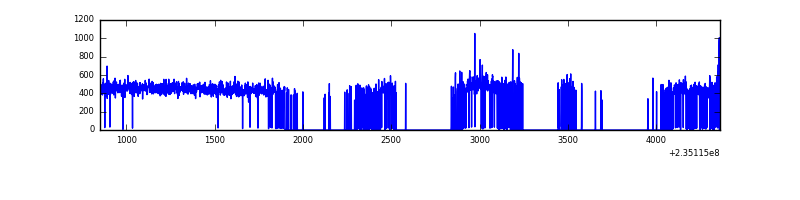 |
| C | 3509 | 1973 | 0 | 0 | 0.00% | 0.00% | 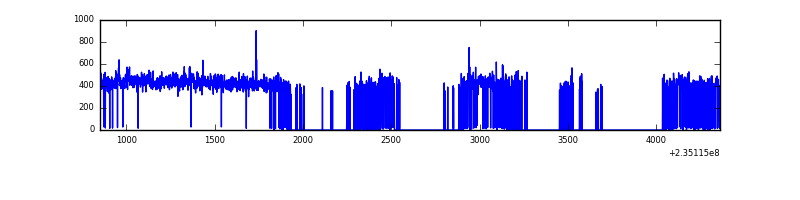 |
| D | 3509 | 1949 | 6 | 6 | 0.17% | 0.31% | 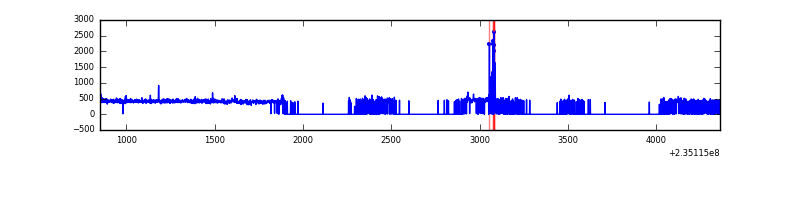 |
Top three noisy pixels from each quadrant. If the there are fewer than three noisy pixels in the level2.evt file, extra rows are filled as -1
| Pixel properties | Quadrant properties | ||||||
|---|---|---|---|---|---|---|---|
| Quadrant | DetID | PixID | Counts | Sigma | Mean | Median | Sigma |
| A | 8 | 5 | 101053 | 2399.99 | 192 | 188 | 42.0 |
| A | 1 | 162 | 8705 | 202.65 | 192 | 188 | 42.0 |
| A | 0 | 226 | 1814 | 38.69 | 192 | 188 | 42.0 |
| B | 0 | 214 | 10512 | 258.17 | 197 | 193 | 40.0 |
| B | 4 | 173 | 6470 | 157.04 | 197 | 193 | 40.0 |
| B | 12 | 111 | 4131 | 98.52 | 197 | 193 | 40.0 |
| C | 9 | 68 | 5643 | 121.16 | 187 | 187 | 45.0 |
| C | 13 | 61 | 1430 | 27.6 | 187 | 187 | 45.0 |
| C | 8 | 222 | 1189 | 22.25 | 187 | 187 | 45.0 |
| D | 10 | 199 | 21351 | 450.22 | 183 | 178 | 47.0 |
| D | 1 | 52 | 8267 | 172.0 | 183 | 178 | 47.0 |
| D | 2 | 234 | 6296 | 130.09 | 183 | 178 | 47.0 |
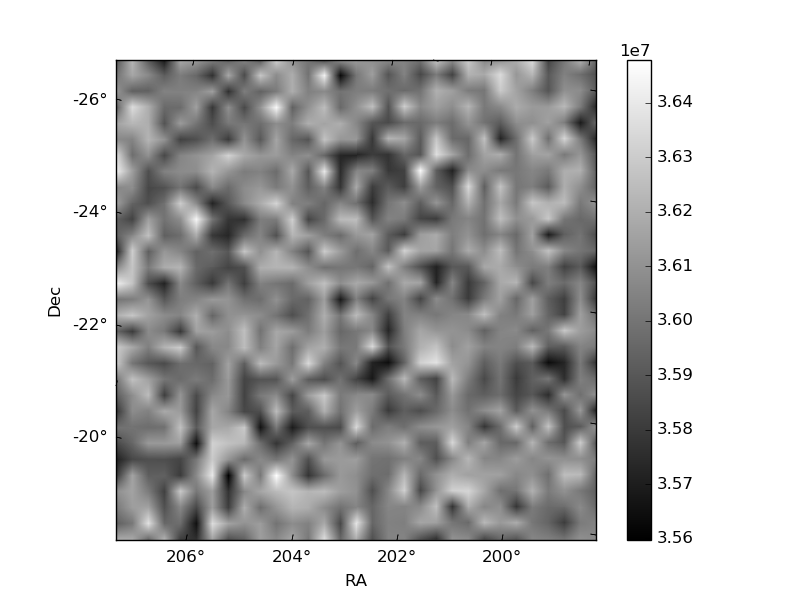
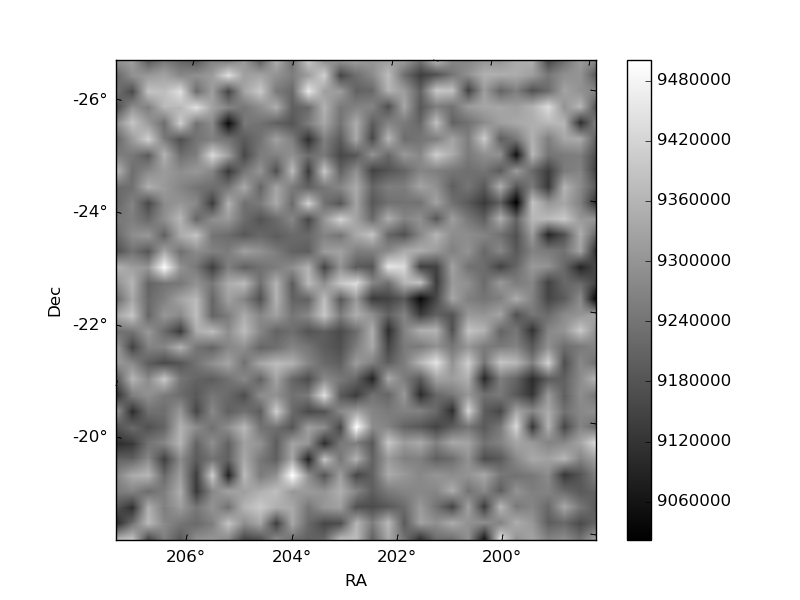
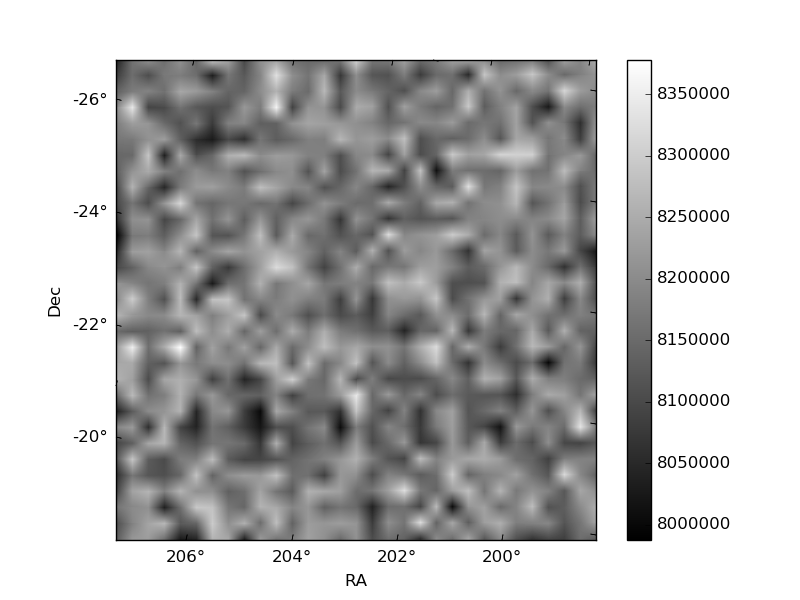
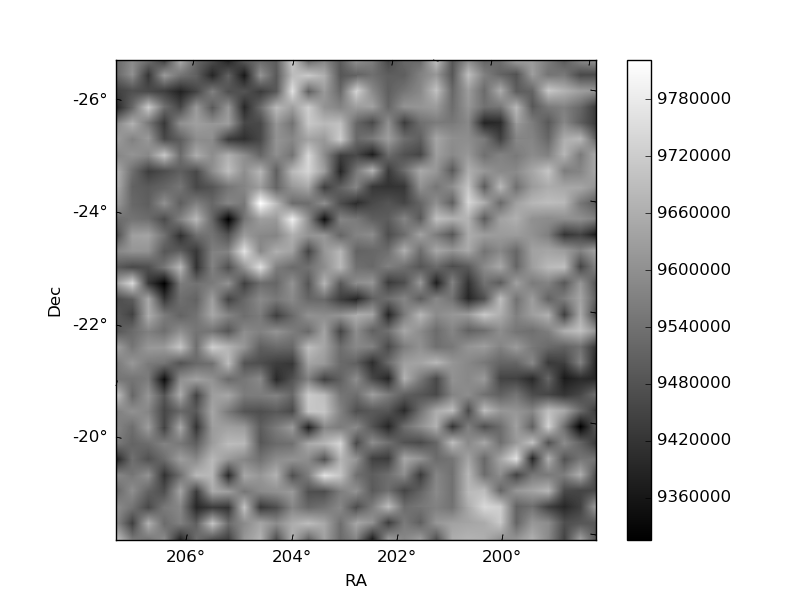
Histogram calculated using DETX and DETY for each event in the final _common_clean file
| Quadrant A | 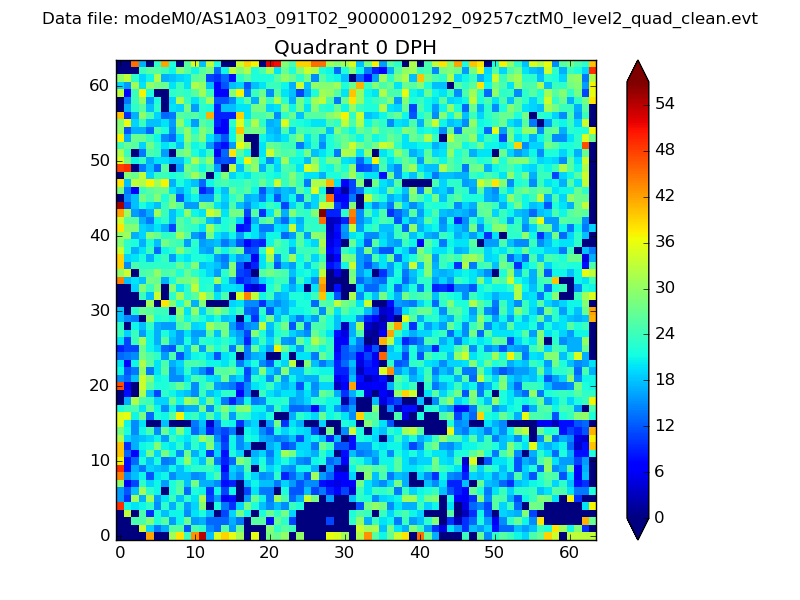 |
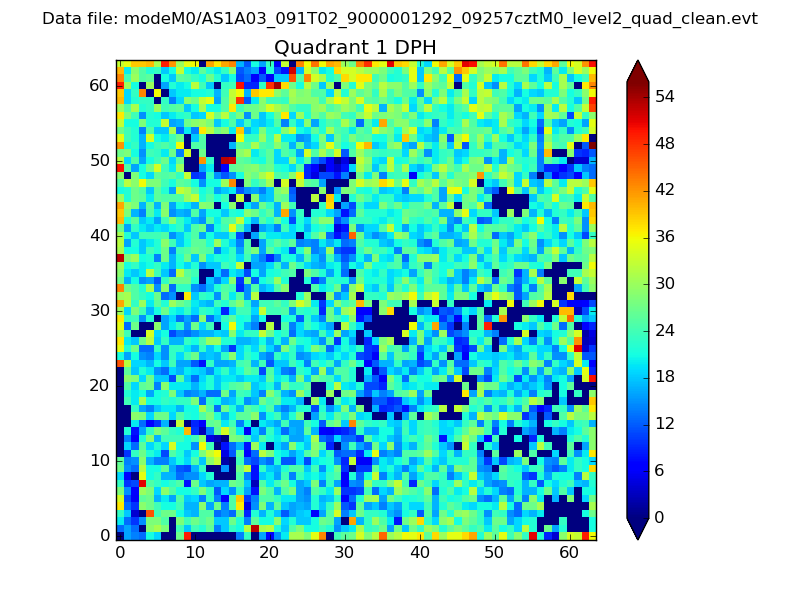 |
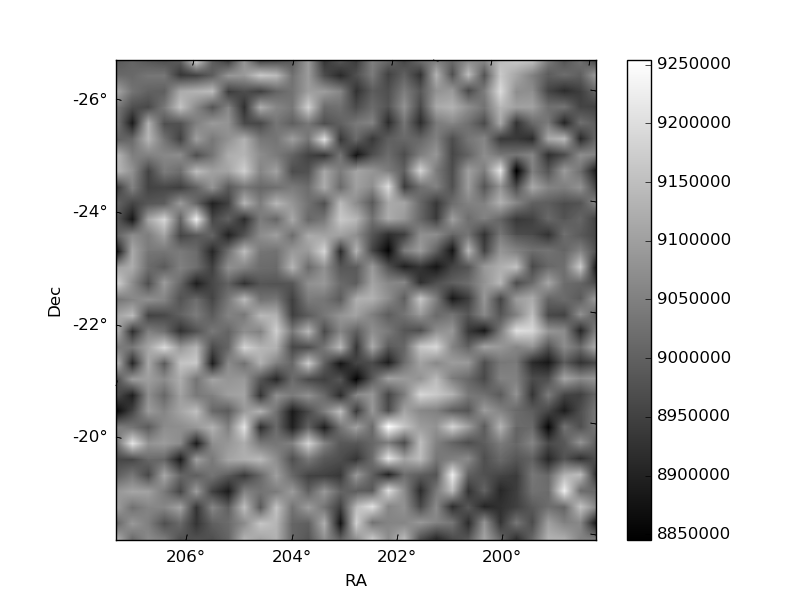
Quadrant B |
|---|---|---|---|
| Quadrant D | 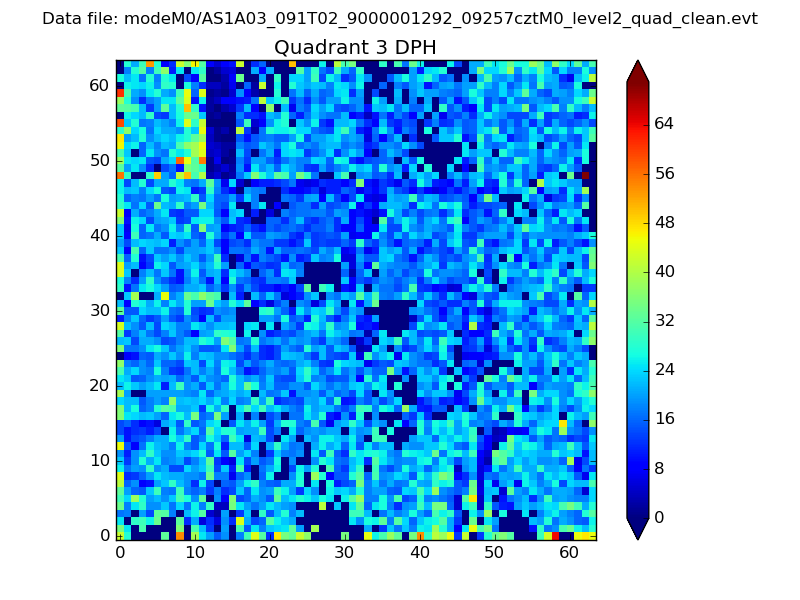 |
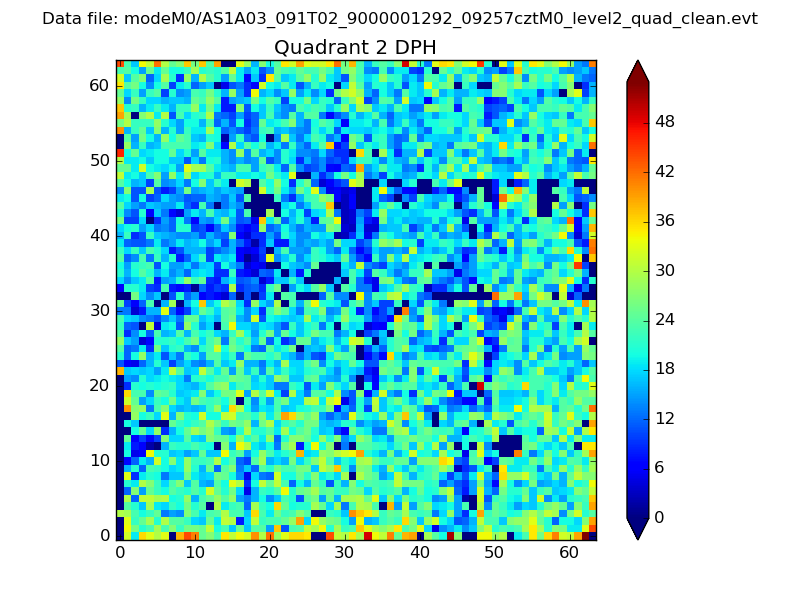 |
Quadrant C |
| Plot type | Count rate plots | Images |
|---|---|---|
| Comparison with Poisson distribution Blue bars denote a histogram of data divided into 1 sec bins. Red curve is a Poisson curve with rate = median count rate of data. |
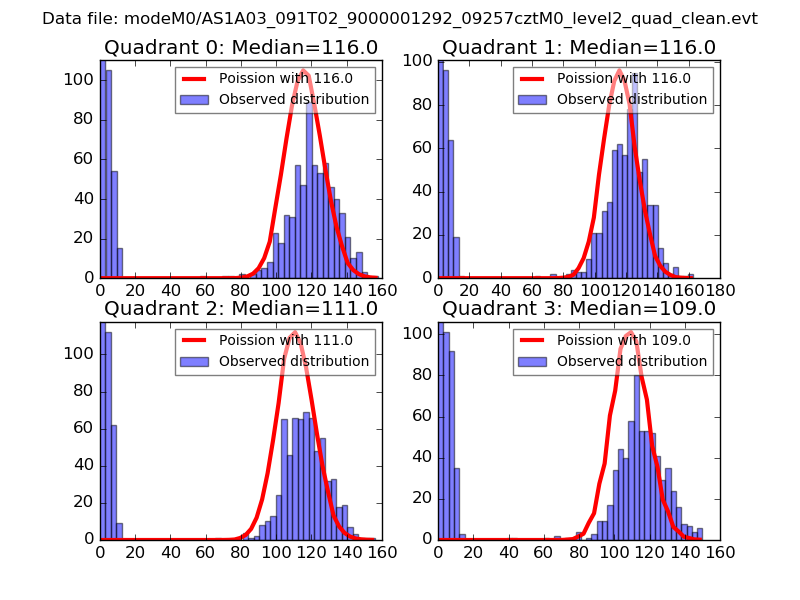 |
 |
| Quadrant-wise count rates Data is divided into 100 sec bins |
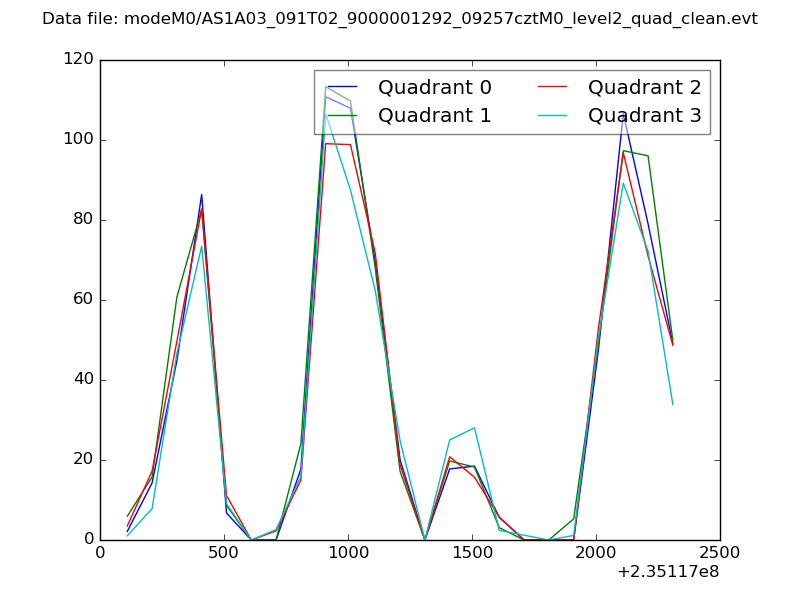 |
|
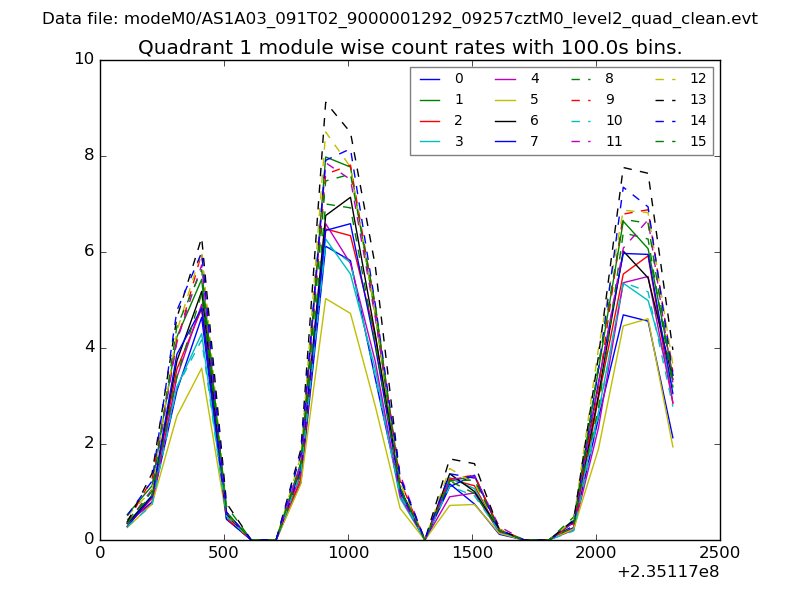
| Module-wise count rates for Quadrant A Data is divided into 100 sec bins |
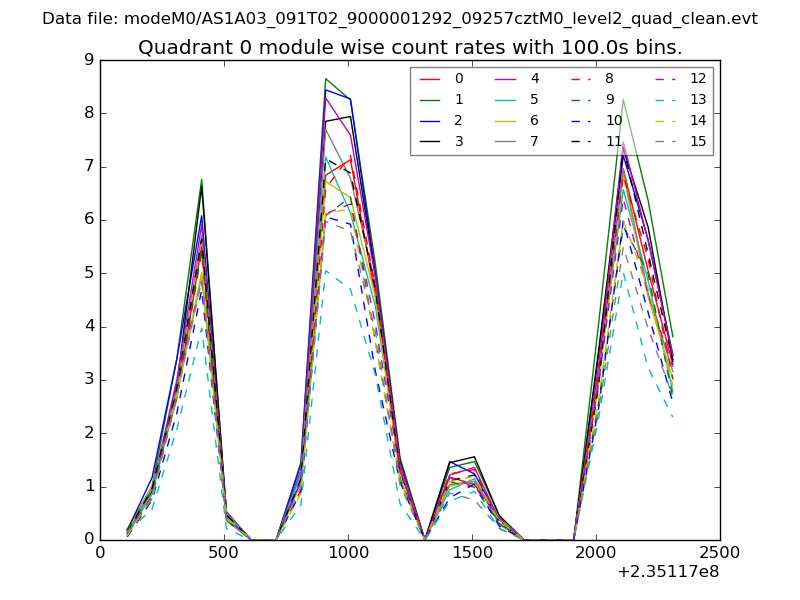 |
 |
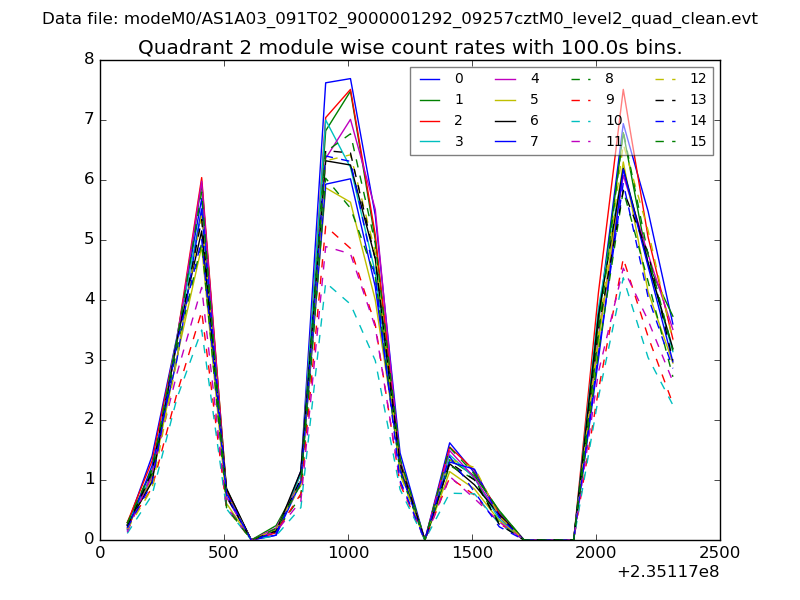
| Module-wise count rates for Quadrant B Data is divided into 100 sec bins |
 |
 |
| Module-wise count rates for Quadrant C Data is divided into 100 sec bins |
 |
 |
| Module-wise count rates for Quadrant D Data is divided into 100 sec bins |
 |
 |
| Parameter | Plot |
|---|---|
| CZT HV Monitor | 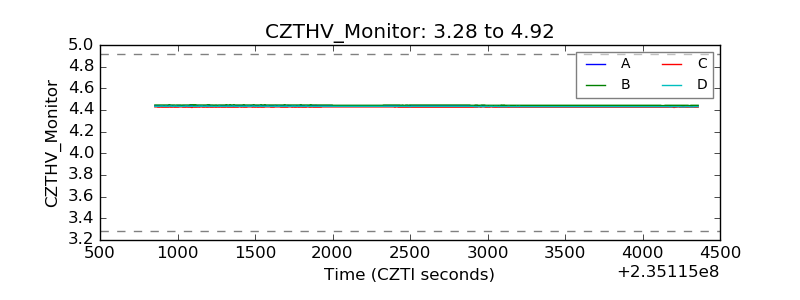 |
| D_VDD | 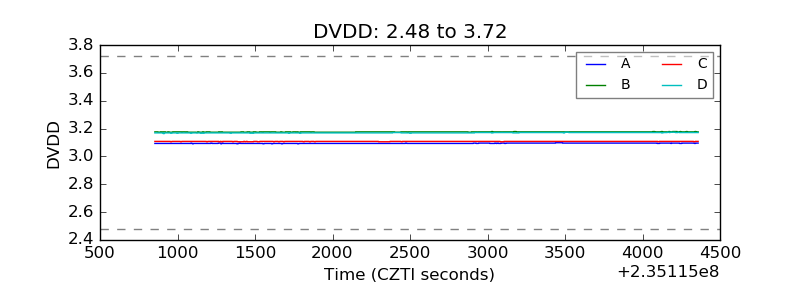 |
| Temperature 1 | 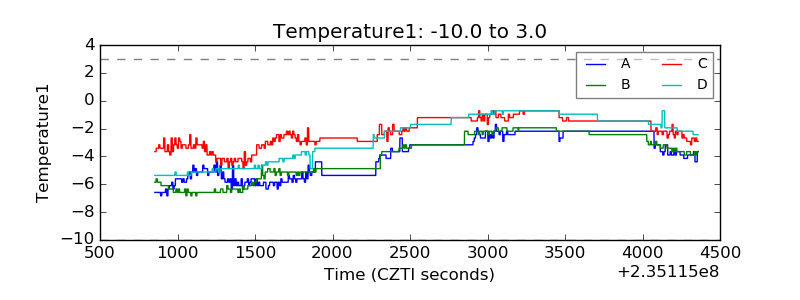 |
| Veto HV Monitor | 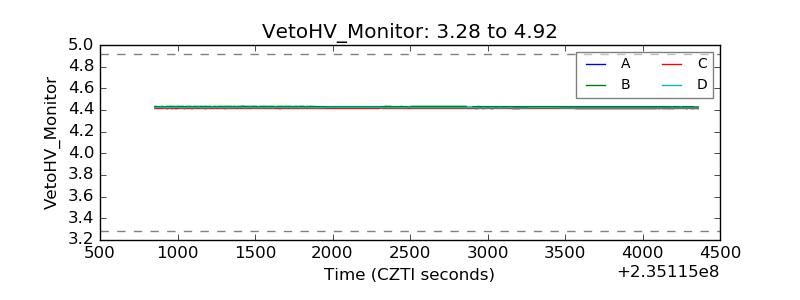 |
| Veto LLD | 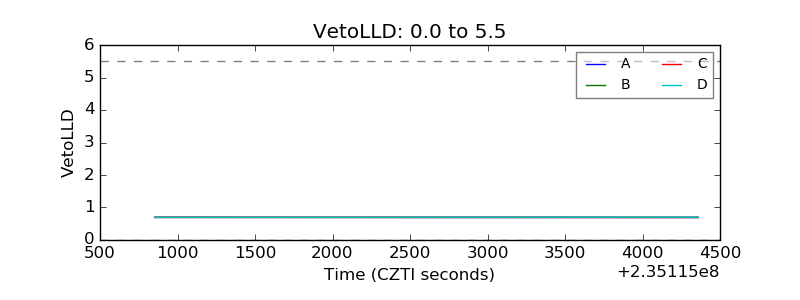 |
| Alpha Counter | 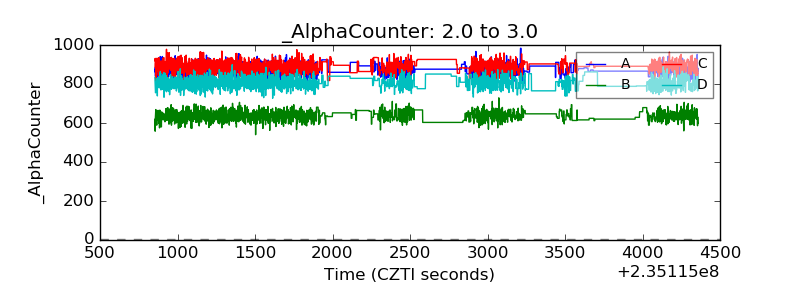 |
| _CPM_Rate | 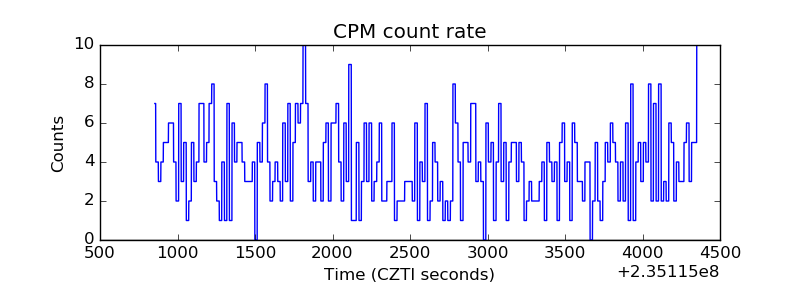 |
| CZT Counter | 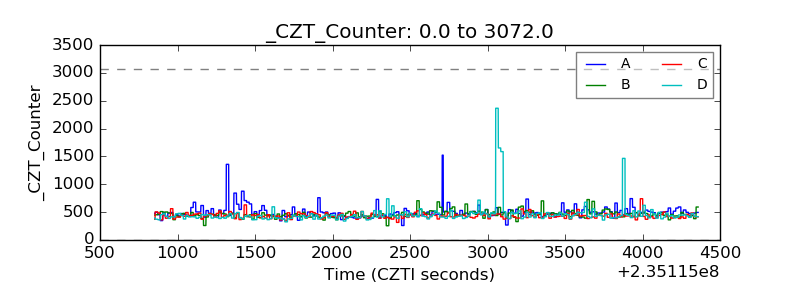 |
| +2.5 Volts monitor | 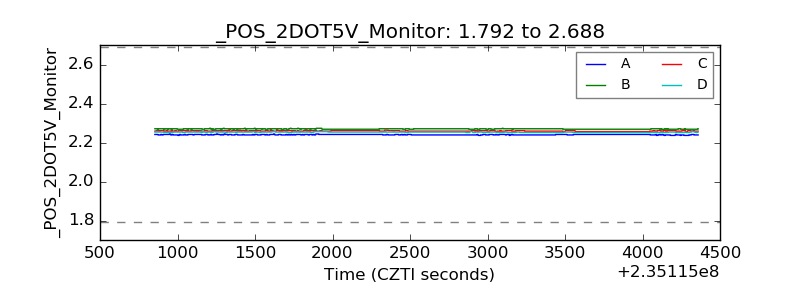 |
| +5 Volts monitor | 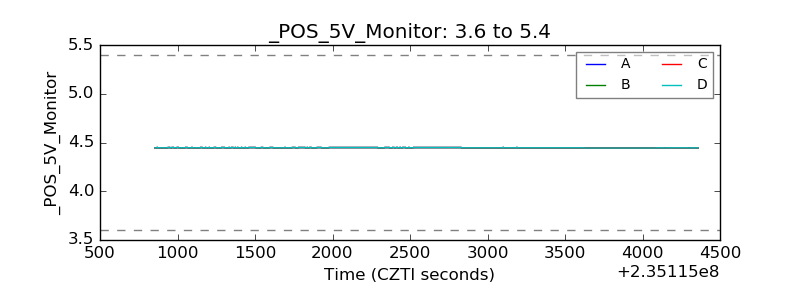 |
| _ROLL_ROT | 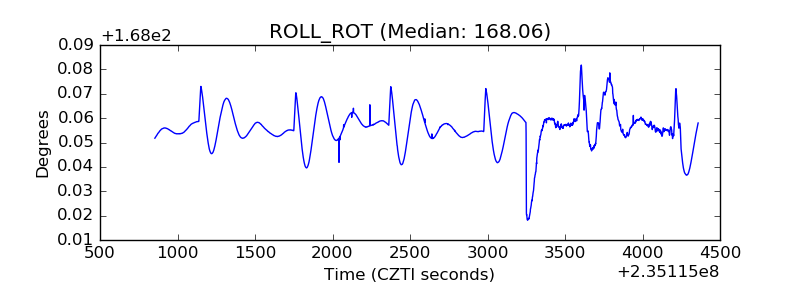 |
| _Roll_DEC | 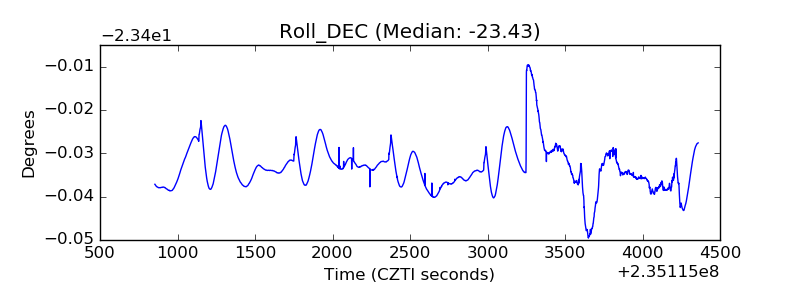 |
| _Roll_RA | 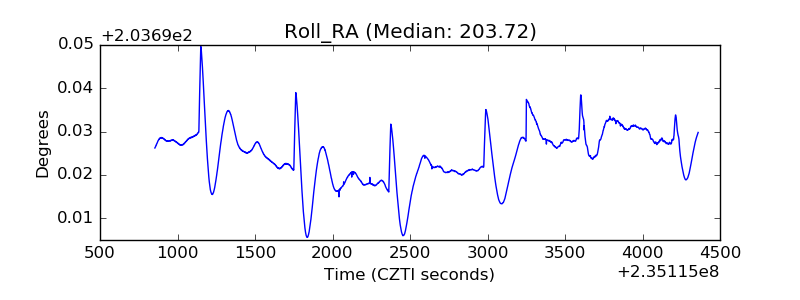 |
| Veto Counter | 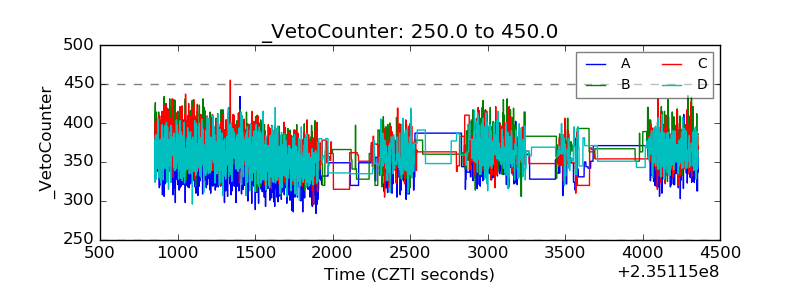 |