| Param | Original file | Final file |
|---|---|---|
| Filename | modeM0/AS1A03_091T02_9000001292_09258cztM0_level2.evt | modeM0/AS1A03_091T02_9000001292_09258cztM0_level2_quad_clean.evt |
| Size (bytes) | 222,010,560 | 45,169,920 |
| Size | 211.7 MB | 43.1 MB |
| Events in quadrant A | 1,735,744 | 282,634 |
| Events in quadrant B | 1,650,674 | 287,008 |
| Events in quadrant C | 1,518,559 | 277,601 |
| Events in quadrant D | 1,578,150 | 271,598 |
| Mode M0 | |||
|---|---|---|---|
| Quadrant | BADHDUFLAG | Total packets | Discarded packets |
| A | 0 | 7344 | 0 |
| B | 0 | 7195 | 0 |
| C | 0 | 7055 | 0 |
| D | 0 | 7223 | 0 |
| Mode SS | |||
|---|---|---|---|
| Quadrant | BADHDUFLAG | Total packets | Discarded packets |
| A | 0 | 70 | 0 |
| B | 0 | 70 | 0 |
| C | 0 | 70 | 0 |
| D | 0 | 70 | 0 |
| Quadrant | Total seconds | Saturated seconds | Saturation percentage |
|---|---|---|---|
| A | 3509 | 8 | 0.227985% |
| B | 3509 | 4 | 0.113993% |
| C | 3509 | 2 | 0.056996% |
| D | 3509 | 10 | 0.284981% |
Noise dominated data is calculated using 1-second bins in cleaned event files. If a bin has >2000 counts, and if more than 50% of those come from <1% of pixels, then it is considered to be noise-dominated and hence unusable.
| Quadrant | # 1 sec bins | Bins with >0 counts | Bins with >2000 counts | High rate bins dominated by noise | Noise dominated (total time) | Noise dominated (detector-on time) | Marked lightcurve |
|---|---|---|---|---|---|---|---|
| A | 3509 | 3509 | 2 | 2 | 0.06% | 0.06% |  |
| B | 3509 | 3509 | 3 | 3 | 0.09% | 0.09% | 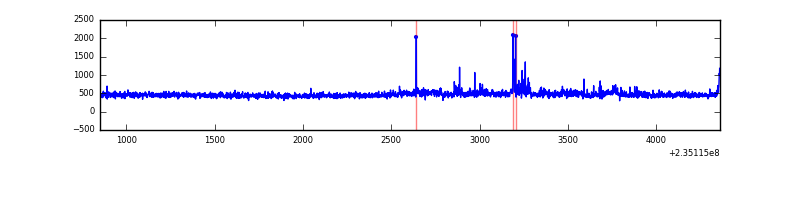 |
| C | 3509 | 3509 | 1 | 1 | 0.03% | 0.03% | 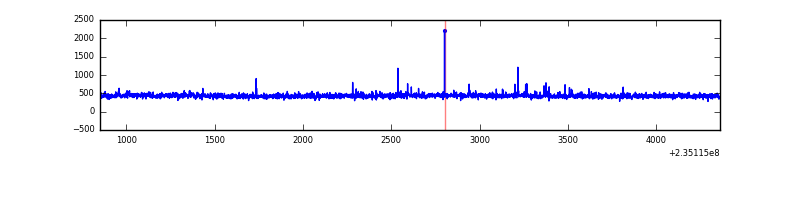 |
| D | 3509 | 3509 | 12 | 12 | 0.34% | 0.34% | 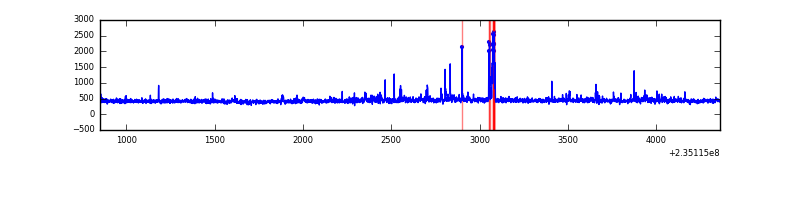 |
Top three noisy pixels from each quadrant. If the there are fewer than three noisy pixels in the level2.evt file, extra rows are filled as -1
| Pixel properties | Quadrant properties | ||||||
|---|---|---|---|---|---|---|---|
| Quadrant | DetID | PixID | Counts | Sigma | Mean | Median | Sigma |
| A | 8 | 5 | 160889 | 1892.16 | 400 | 392 | 84.8 |
| A | 1 | 162 | 19646 | 226.99 | 400 | 392 | 84.8 |
| A | 0 | 226 | 3757 | 39.67 | 400 | 392 | 84.8 |
| B | 0 | 214 | 46055 | 587.72 | 400 | 392 | 77.7 |
| B | 4 | 173 | 18684 | 235.43 | 400 | 392 | 77.7 |
| B | 0 | 187 | 18449 | 232.41 | 400 | 392 | 77.7 |
| C | 9 | 68 | 15327 | 165.19 | 384 | 385 | 90.5 |
| C | 13 | 61 | 2926 | 28.09 | 384 | 385 | 90.5 |
| C | 8 | 222 | 2053 | 18.44 | 384 | 385 | 90.5 |
| D | 10 | 199 | 39405 | 394.59 | 386 | 375 | 98.9 |
| D | 7 | 71 | 20640 | 204.88 | 386 | 375 | 98.9 |
| D | 2 | 136 | 20526 | 203.72 | 386 | 375 | 98.9 |
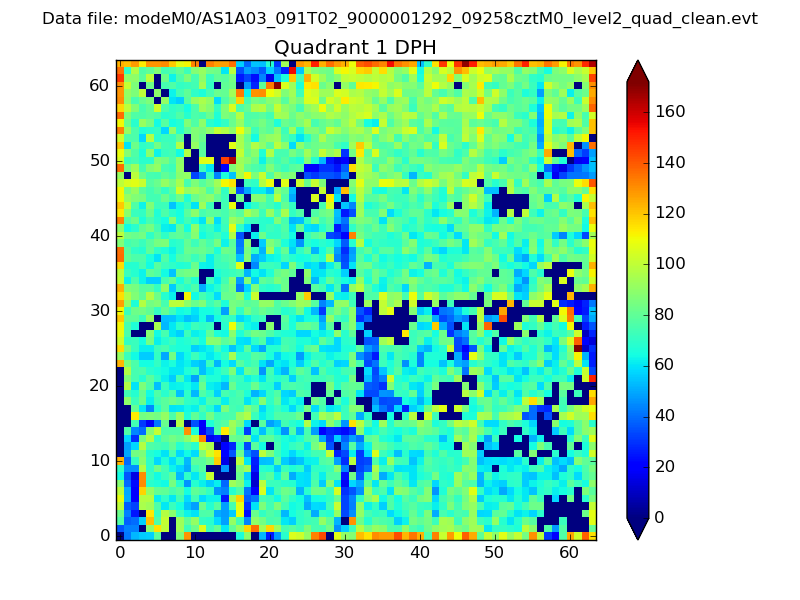
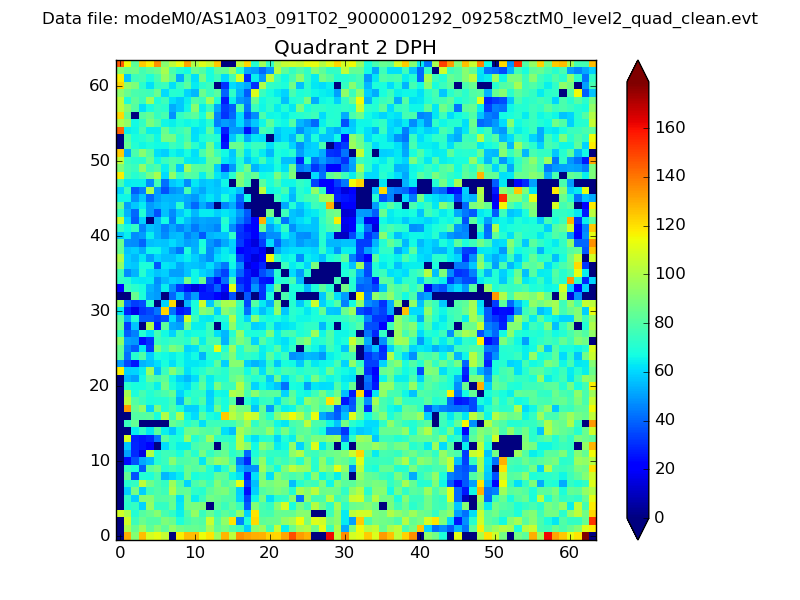
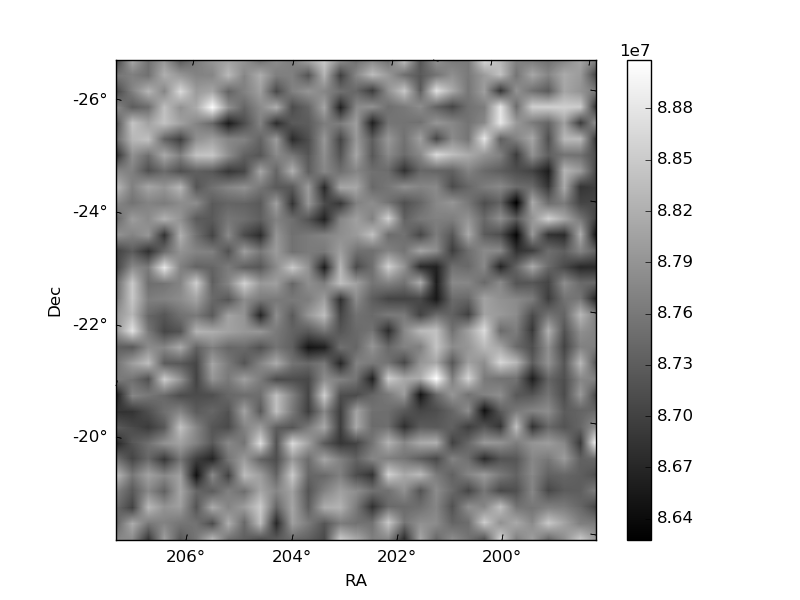
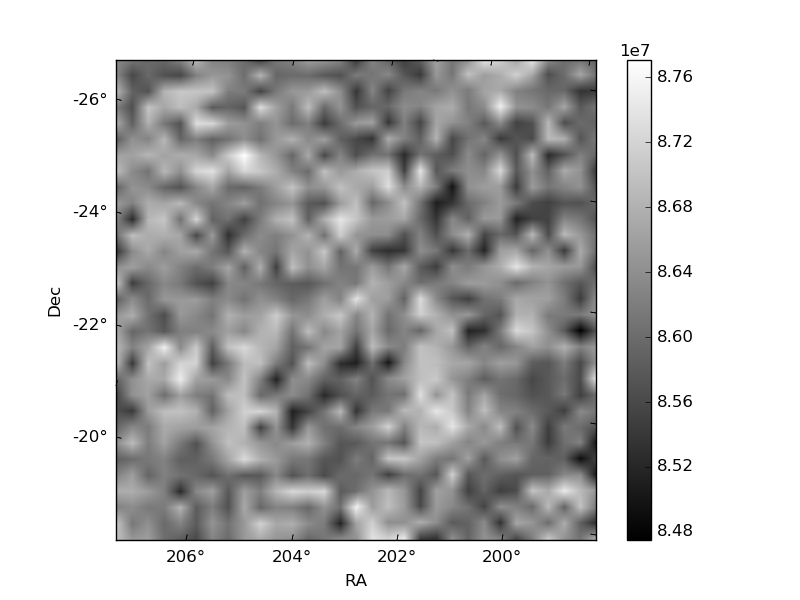
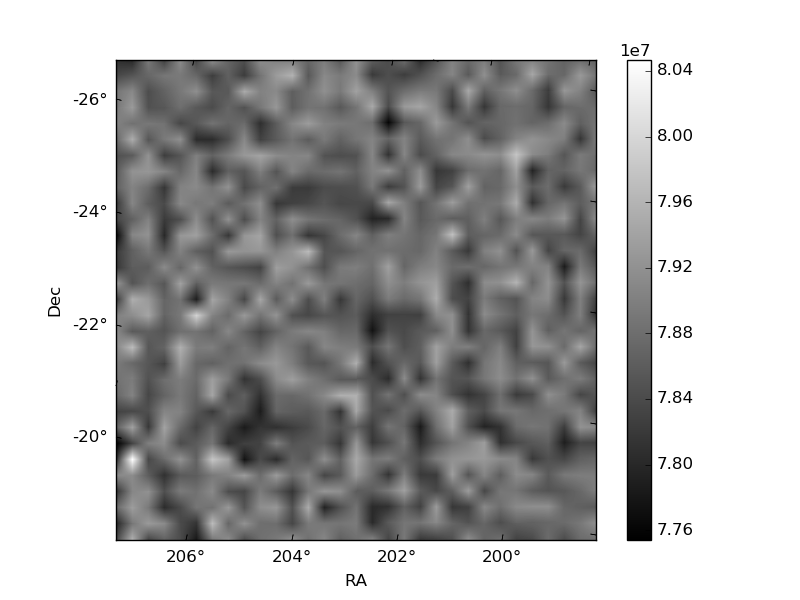
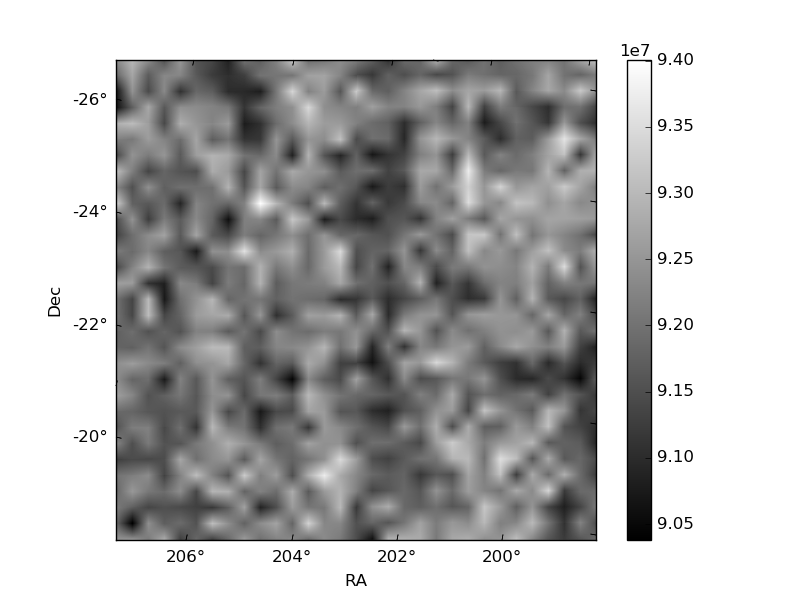
Histogram calculated using DETX and DETY for each event in the final _common_clean file
| Quadrant A |  |
 |
Quadrant B |
|---|---|---|---|
| Quadrant D | 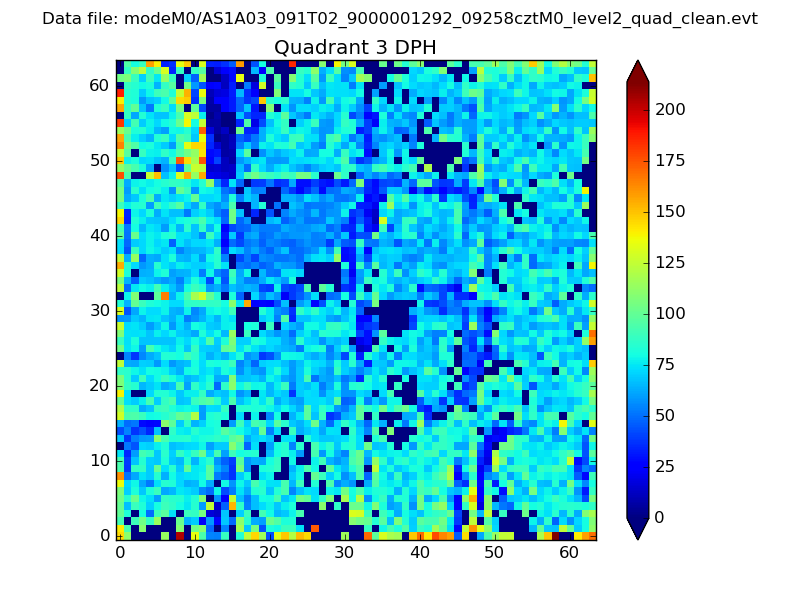 |
 |
Quadrant C |
| Plot type | Count rate plots | Images |
|---|---|---|
| Comparison with Poisson distribution Blue bars denote a histogram of data divided into 1 sec bins. Red curve is a Poisson curve with rate = median count rate of data. |
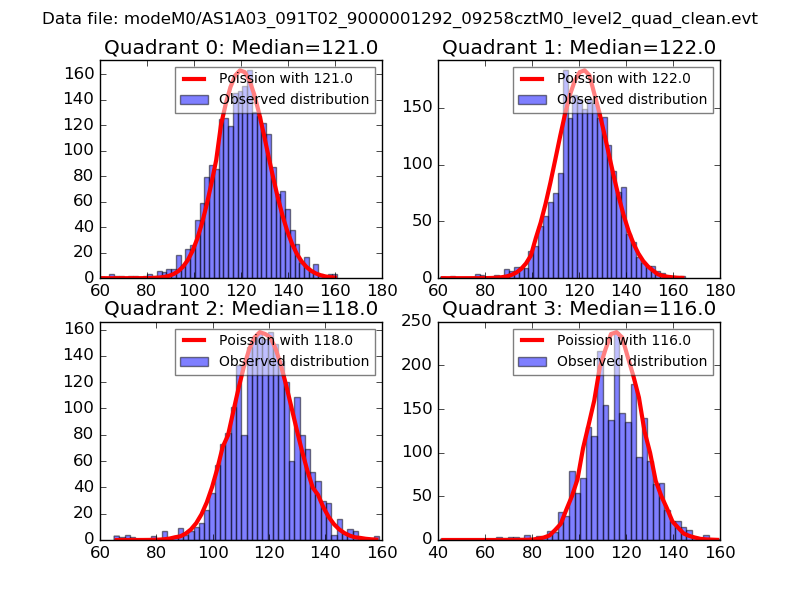 |
 |
| Quadrant-wise count rates Data is divided into 100 sec bins |
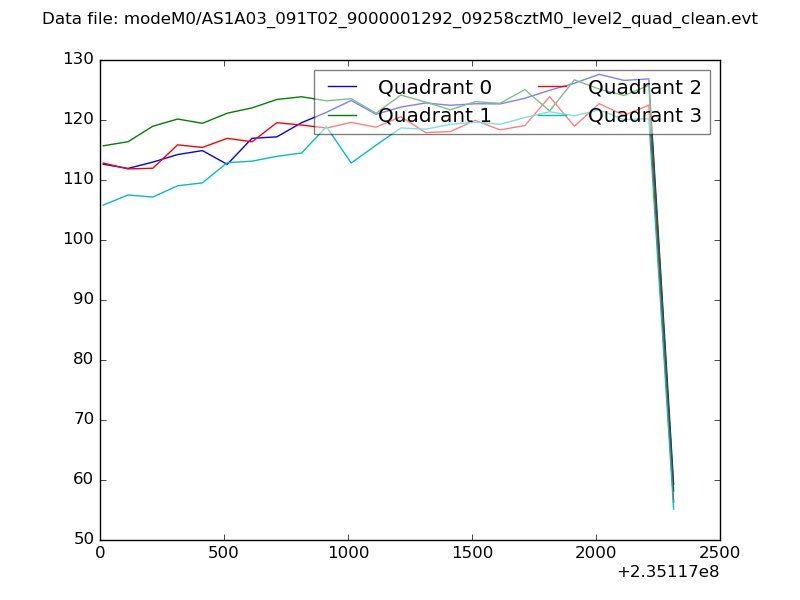 |
|
| Module-wise count rates for Quadrant A Data is divided into 100 sec bins |
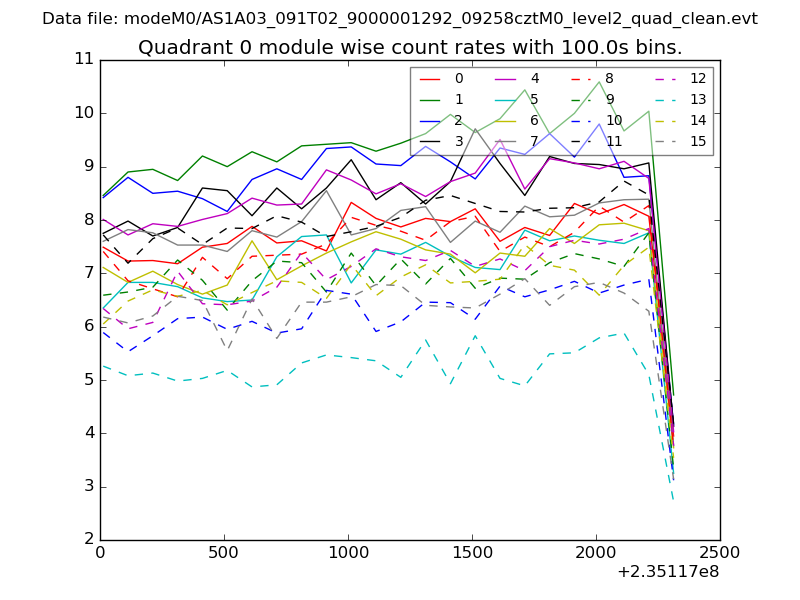 |
 |
| Module-wise count rates for Quadrant B Data is divided into 100 sec bins |
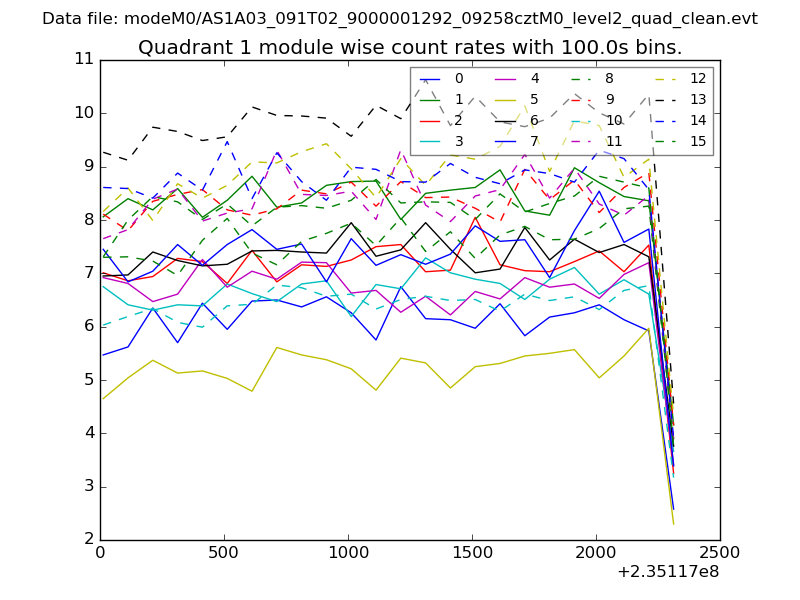 |
 |
| Module-wise count rates for Quadrant C Data is divided into 100 sec bins |
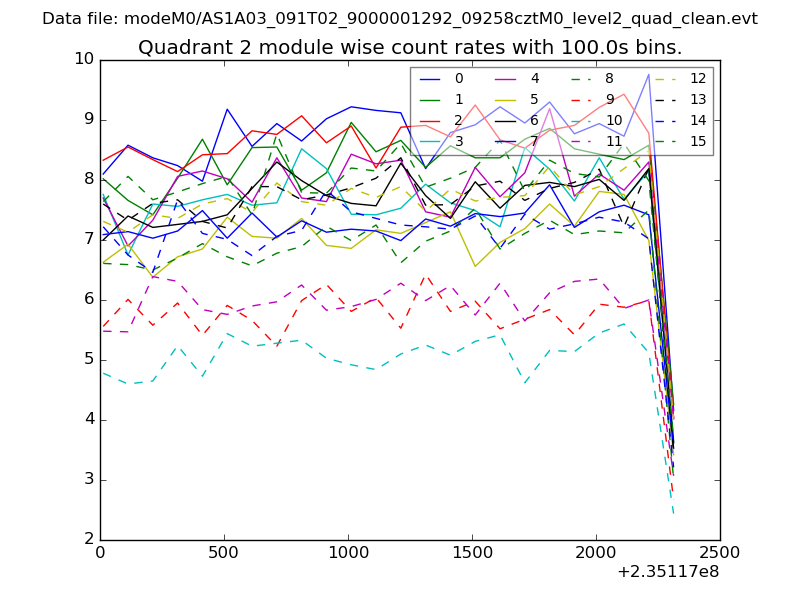 |
 |
| Module-wise count rates for Quadrant D Data is divided into 100 sec bins |
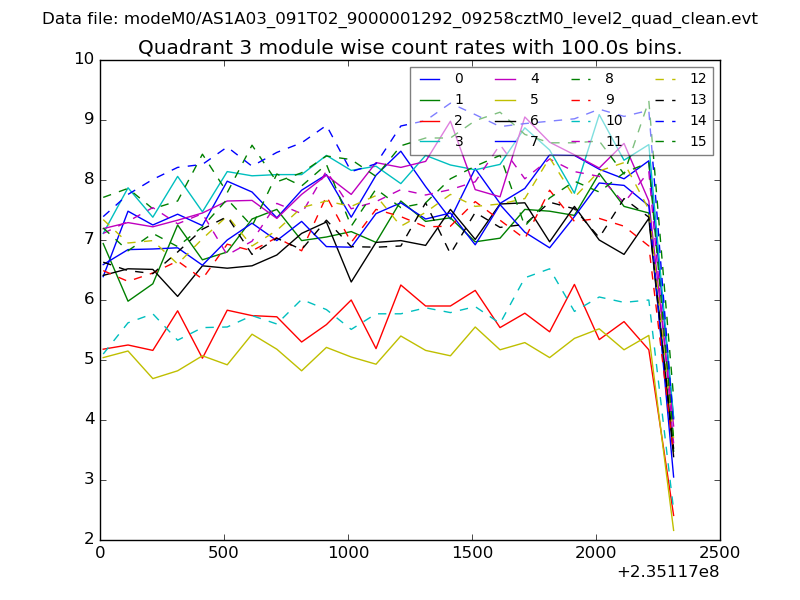 |
 |
| Parameter | Plot |
|---|---|
| CZT HV Monitor | 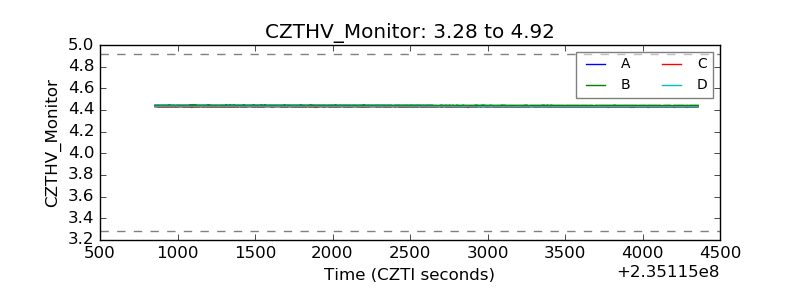 |
| D_VDD | 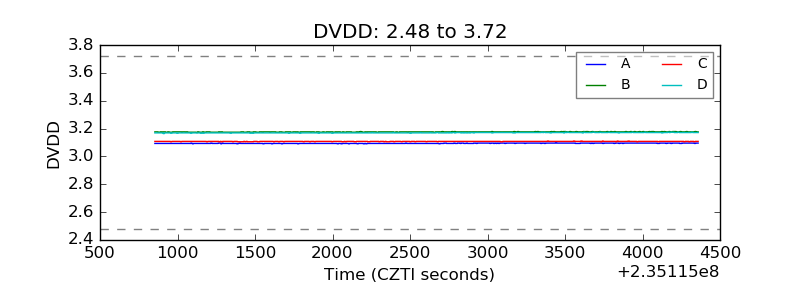 |
| Temperature 1 |  |
| Veto HV Monitor | 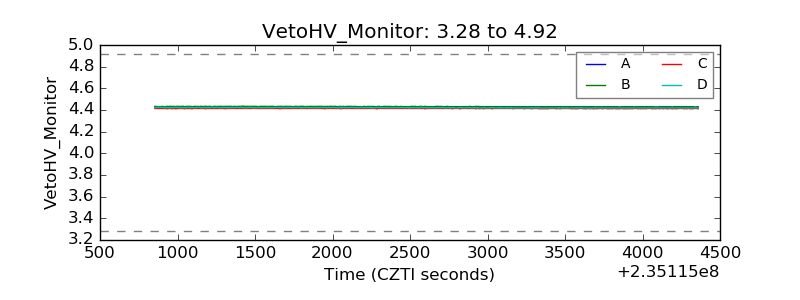 |
| Veto LLD | 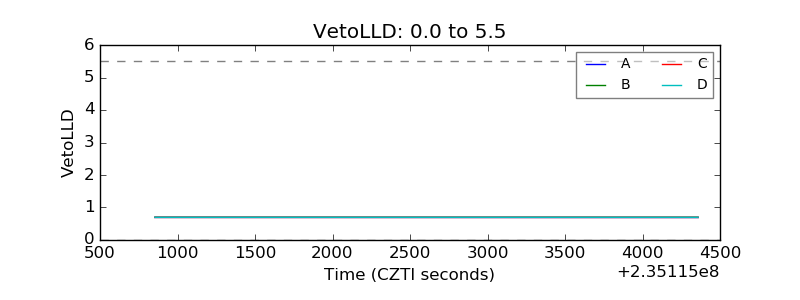 |
| Alpha Counter | 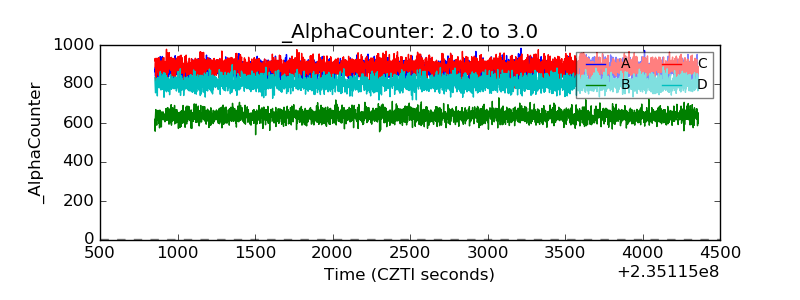 |
| _CPM_Rate | 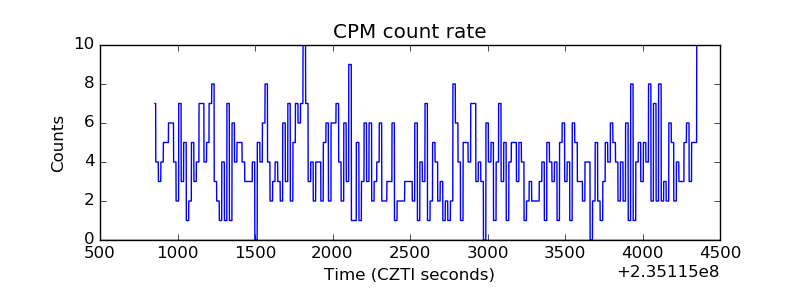 |
| CZT Counter | 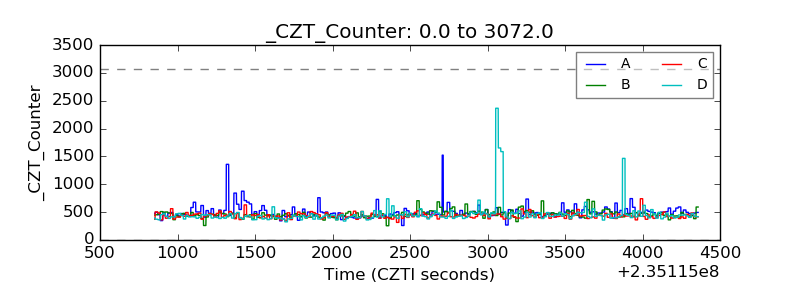 |
| +2.5 Volts monitor |  |
| +5 Volts monitor |  |
| _ROLL_ROT | 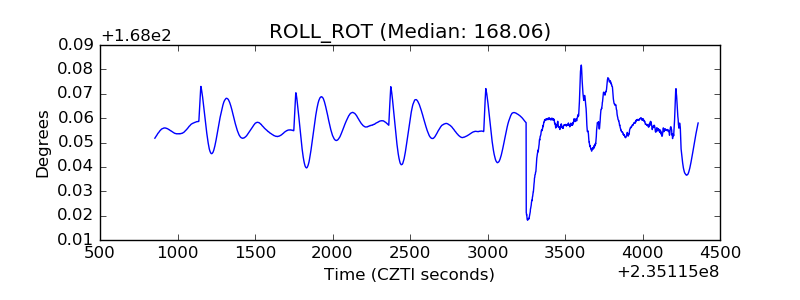 |
| _Roll_DEC | 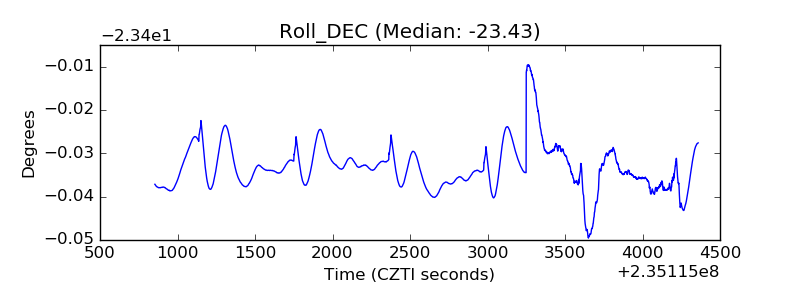 |
| _Roll_RA | 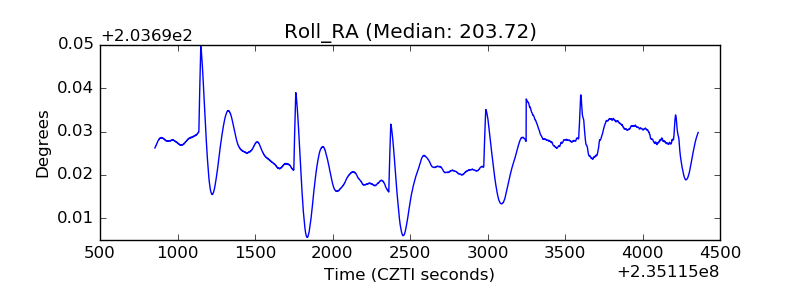 |
| Veto Counter | 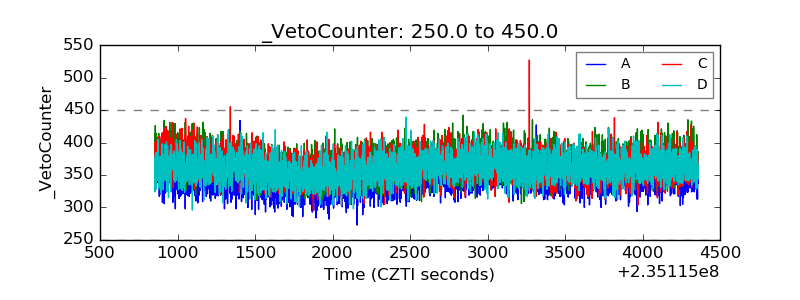 |