| Param | Original file | Final file |
|---|---|---|
| Filename | modeM0/AS1G07_003T01_9000001290cztM0_level2.fits | modeM0/AS1G07_003T01_9000001290cztM0_level2_quad_clean.evt |
| Size (bytes) | 262,592,640 | 222,085,440 |
| Size | 250.4 MB | 211.8 MB |
| Events in quadrant A | 1,539,222 | 1,246,714 |
| Events in quadrant B | 1,532,990 | 1,232,656 |
| Events in quadrant C | 1,564,566 | 1,177,913 |
| Events in quadrant D | 1,362,770 | 1,115,147 |
| Mode M0 | |||
|---|---|---|---|
| Quadrant | BADHDUFLAG | Total packets | Discarded packets |
| A | 0 | 77064 | 0 |
| B | 0 | 62131 | 0 |
| C | 0 | 58902 | 0 |
| D | 0 | 61376 | 0 |
| Mode M9 | |||
|---|---|---|---|
| Quadrant | BADHDUFLAG | Total packets | Discarded packets |
| A | 0 | 54 | 0 |
| B | 0 | 54 | 0 |
| C | 0 | 54 | 0 |
| D | 0 | 54 | 0 |
| Mode SS | |||
|---|---|---|---|
| Quadrant | BADHDUFLAG | Total packets | Discarded packets |
| A | 0 | 580 | 0 |
| B | 0 | 582 | 0 |
| C | 0 | 578 | 0 |
| D | 0 | 580 | 0 |
| Quadrant | Total seconds | Saturated seconds | Saturation percentage |
|---|---|---|---|
| A | 28351 | 1535 | 5.414271% |
| B | 28368 | 400 | 1.410039% |
| C | 28446 | 216 | 0.759333% |
| D | 28401 | 379 | 1.334460% |
Noise dominated data is calculated using 1-second bins in cleaned event files. If a bin has >2000 counts, and if more than 50% of those come from <1% of pixels, then it is considered to be noise-dominated and hence unusable.
| Quadrant | # 1 sec bins | Bins with >0 counts | Bins with >2000 counts | High rate bins dominated by noise | Noise dominated (total time) | Noise dominated (detector-on time) | Marked lightcurve |
|---|---|---|---|---|---|---|---|
| A | 34236 | 28566 | 0 | 0 | 0.00% | 0.00% |  |
| B | 34236 | 28587 | 0 | 0 | 0.00% | 0.00% |  |
| C | 34236 | 28651 | 0 | 0 | 0.00% | 0.00% |  |
| D | 34235 | 28594 | 0 | 0 | 0.00% | 0.00% |  |
Top three noisy pixels from each quadrant. If the there are fewer than three noisy pixels in the level2.evt file, extra rows are filled as -1
| Pixel properties | Quadrant properties | ||||||
|---|---|---|---|---|---|---|---|
| Quadrant | DetID | PixID | Counts | Sigma | Mean | Median | Sigma |
| A | 0 | 29 | 1489 | 10.76 | 401 | 374 | 103.6 |
| A | 7 | 110 | 1287 | 8.81 | 401 | 374 | 103.6 |
| A | 0 | 30 | 1137 | 7.36 | 401 | 374 | 103.6 |
| B | 2 | 9 | 1367 | 11.8 | 404 | 383 | 83.4 |
| B | 2 | 8 | 1034 | 7.8 | 404 | 383 | 83.4 |
| B | 14 | 254 | 1032 | 7.78 | 404 | 383 | 83.4 |
| C | 12 | 241 | 1121 | 6.7 | 413 | 381 | 110.4 |
| C | 3 | 158 | 1084 | 6.37 | 413 | 381 | 110.4 |
| C | 9 | 242 | 1046 | 6.02 | 413 | 381 | 110.4 |
| D | 3 | 14 | 1055 | 6.75 | 386 | 350 | 104.5 |
| D | 6 | 231 | 1033 | 6.54 | 386 | 350 | 104.5 |
| D | 7 | 3 | 1023 | 6.44 | 386 | 350 | 104.5 |
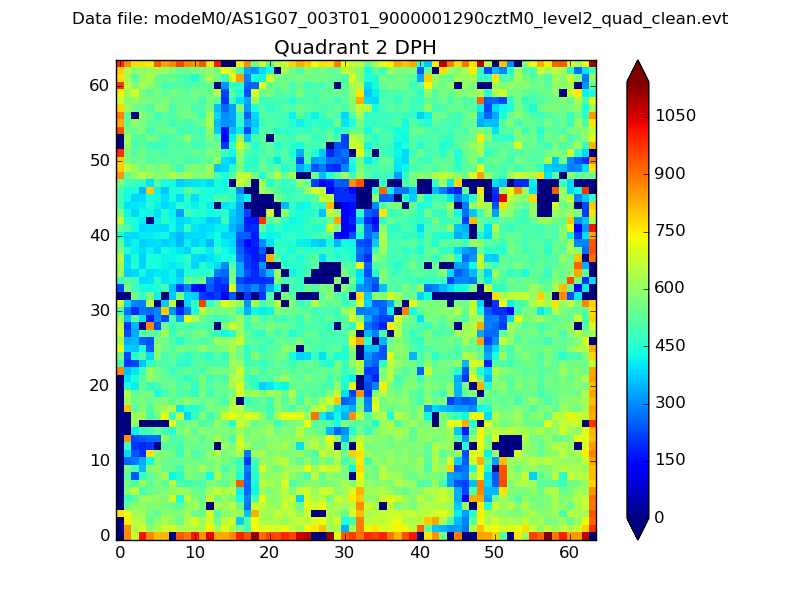
Histogram calculated using DETX and DETY for each event in the final _common_clean file
| Quadrant A |  |
 |
Quadrant B |
|---|---|---|---|
| Quadrant D | 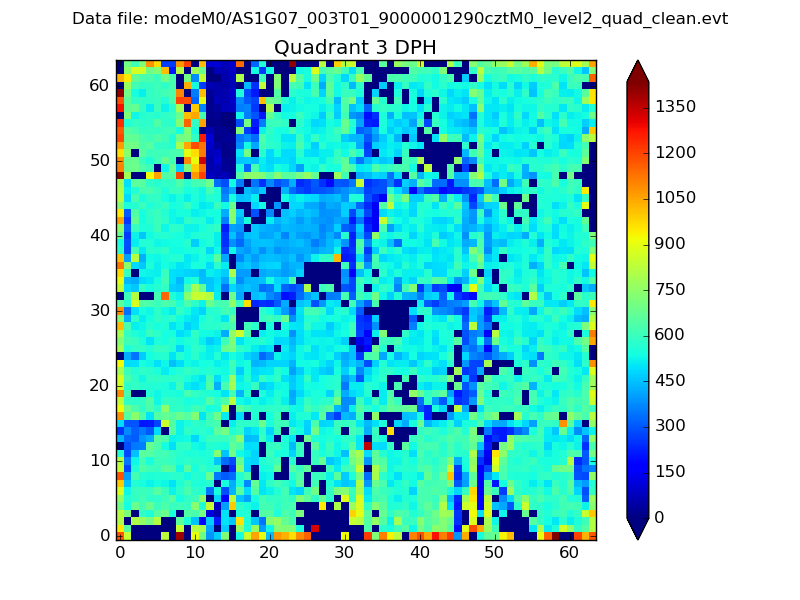 |
 |
Quadrant C |
| Plot type | Count rate plots | Images |
|---|---|---|
| Comparison with Poisson distribution Blue bars denote a histogram of data divided into 1 sec bins. Red curve is a Poisson curve with rate = median count rate of data. |
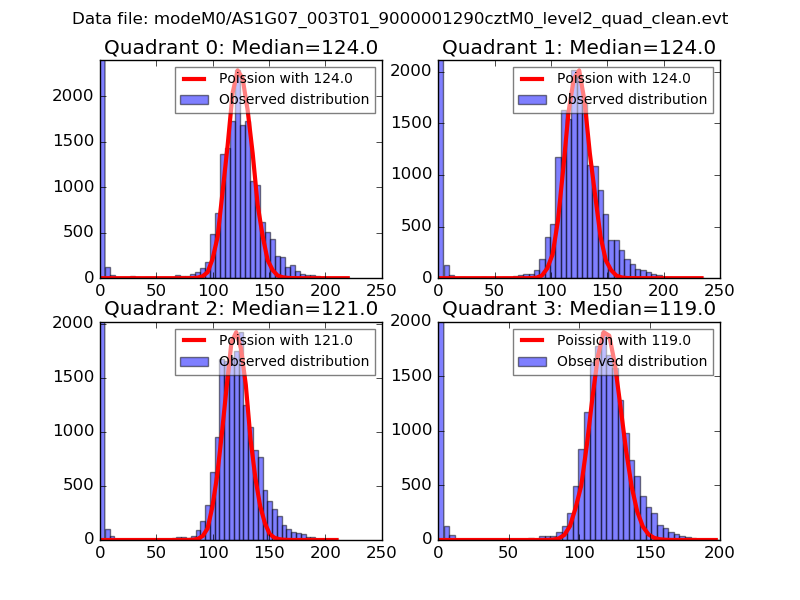 |
 |
| Quadrant-wise count rates Data is divided into 100 sec bins |
 |
|
| Module-wise count rates for Quadrant A Data is divided into 100 sec bins |
 |
 |
| Module-wise count rates for Quadrant B Data is divided into 100 sec bins |
 |
 |
| Module-wise count rates for Quadrant C Data is divided into 100 sec bins |
 |
 |
| Module-wise count rates for Quadrant D Data is divided into 100 sec bins |
 |
 |
| Parameter | Plot |
|---|---|
| CZT HV Monitor |  |
| D_VDD |  |
| Temperature 1 |  |
| Veto HV Monitor |  |
| Veto LLD |  |
| Alpha Counter |  |
| _CPM_Rate |  |
| CZT Counter |  |
| +2.5 Volts monitor |  |
| +5 Volts monitor |  |
| _ROLL_ROT |  |
| _Roll_DEC |  |
| _Roll_RA | 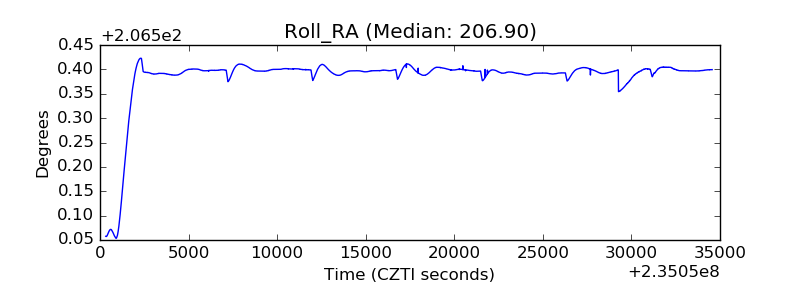 |
| Veto Counter |  |