| Param | Original file | Final file |
|---|---|---|
| Filename | modeM0/AS1G07_003T01_9000001290_09242cztM0_level2.evt | modeM0/AS1G07_003T01_9000001290_09242cztM0_level2_quad_clean.evt |
| Size (bytes) | 226,261,440 | 29,295,360 |
| Size | 215.8 MB | 27.9 MB |
| Events in quadrant A | 1,837,984 | 166,521 |
| Events in quadrant B | 1,729,216 | 165,466 |
| Events in quadrant C | 1,498,091 | 169,890 |
| Events in quadrant D | 1,574,898 | 164,651 |
| Mode M0 | |||
|---|---|---|---|
| Quadrant | BADHDUFLAG | Total packets | Discarded packets |
| A | 0 | 8191 | 804 |
| B | 0 | 7898 | 933 |
| C | 0 | 6957 | 532 |
| D | 0 | 7311 | 608 |
| Mode M9 | |||
|---|---|---|---|
| Quadrant | BADHDUFLAG | Total packets | Discarded packets |
| A | 0 | 4 | 0 |
| B | 0 | 4 | 0 |
| C | 0 | 4 | 0 |
| D | 0 | 4 | 0 |
| Mode SS | |||
|---|---|---|---|
| Quadrant | BADHDUFLAG | Total packets | Discarded packets |
| A | 0 | 70 | 6 |
| B | 0 | 70 | 4 |
| C | 0 | 70 | 4 |
| D | 0 | 70 | 8 |
| Quadrant | Total seconds | Saturated seconds | Saturation percentage |
|---|---|---|---|
| A | 3062 | 102 | 3.331156% |
| B | 3058 | 125 | 4.087639% |
| C | 3119 | 51 | 1.635139% |
| D | 3099 | 78 | 2.516941% |
Noise dominated data is calculated using 1-second bins in cleaned event files. If a bin has >2000 counts, and if more than 50% of those come from <1% of pixels, then it is considered to be noise-dominated and hence unusable.
| Quadrant | # 1 sec bins | Bins with >0 counts | Bins with >2000 counts | High rate bins dominated by noise | Noise dominated (total time) | Noise dominated (detector-on time) | Marked lightcurve |
|---|---|---|---|---|---|---|---|
| A | 3856 | 3262 | 2 | 2 | 0.05% | 0.06% | 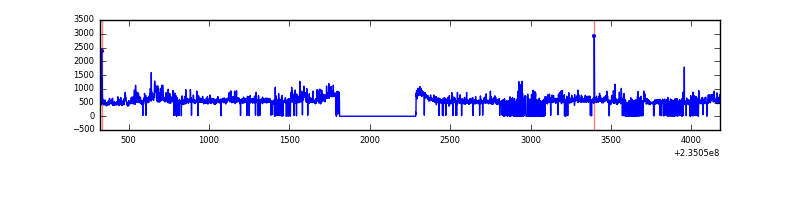 |
| B | 3856 | 3254 | 40 | 40 | 1.04% | 1.23% | 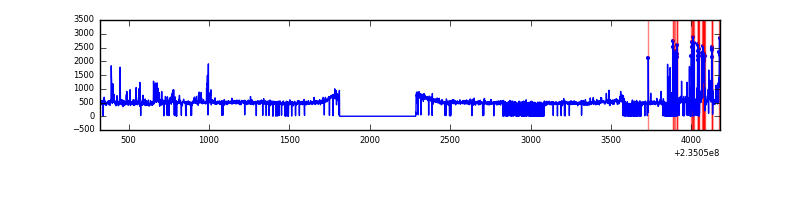 |
| C | 3856 | 3302 | 1 | 1 | 0.03% | 0.03% | 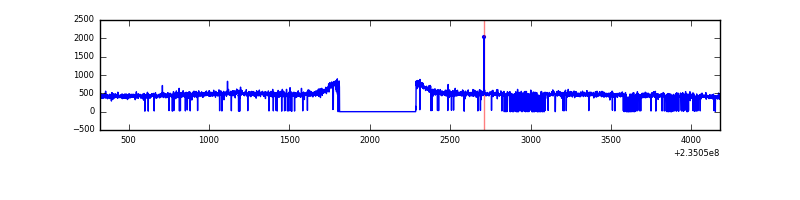 |
| D | 3856 | 3293 | 18 | 18 | 0.47% | 0.55% | 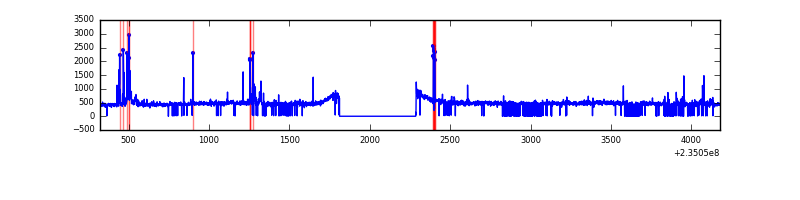 |
Top three noisy pixels from each quadrant. If the there are fewer than three noisy pixels in the level2.evt file, extra rows are filled as -1
| Pixel properties | Quadrant properties | ||||||
|---|---|---|---|---|---|---|---|
| Quadrant | DetID | PixID | Counts | Sigma | Mean | Median | Sigma |
| A | 8 | 5 | 233280 | 2891.48 | 383 | 375 | 80.5 |
| A | 1 | 162 | 50590 | 623.41 | 383 | 375 | 80.5 |
| A | 1 | 178 | 18322 | 222.81 | 383 | 375 | 80.5 |
| B | 6 | 51 | 118524 | 1566.34 | 383 | 371 | 75.4 |
| B | 4 | 48 | 56293 | 741.35 | 383 | 371 | 75.4 |
| B | 0 | 214 | 22248 | 290.02 | 383 | 371 | 75.4 |
| C | 13 | 61 | 2937 | 28.32 | 382 | 382 | 90.2 |
| C | 12 | 4 | 2748 | 26.22 | 382 | 382 | 90.2 |
| C | 8 | 222 | 2410 | 22.48 | 382 | 382 | 90.2 |
| D | 7 | 71 | 63814 | 632.31 | 376 | 365 | 100.3 |
| D | 12 | 233 | 29144 | 286.8 | 376 | 365 | 100.3 |
| D | 2 | 14 | 20487 | 200.53 | 376 | 365 | 100.3 |
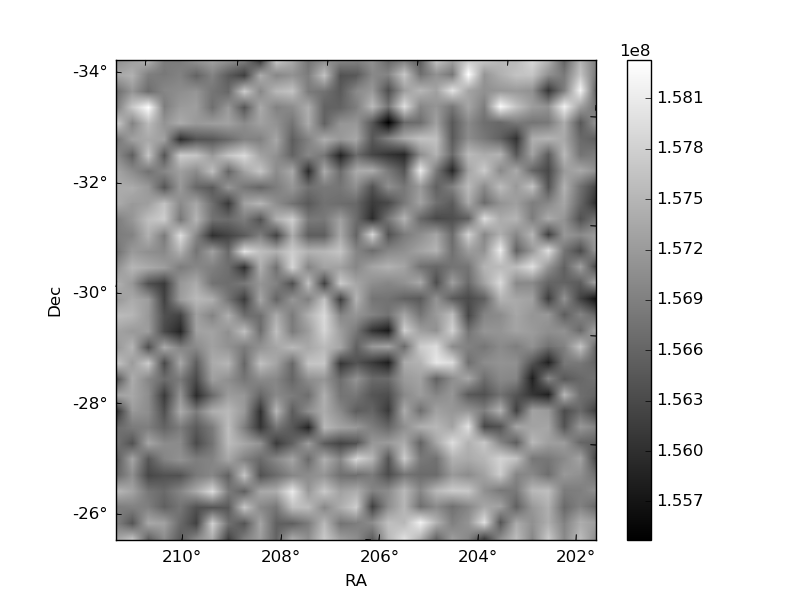
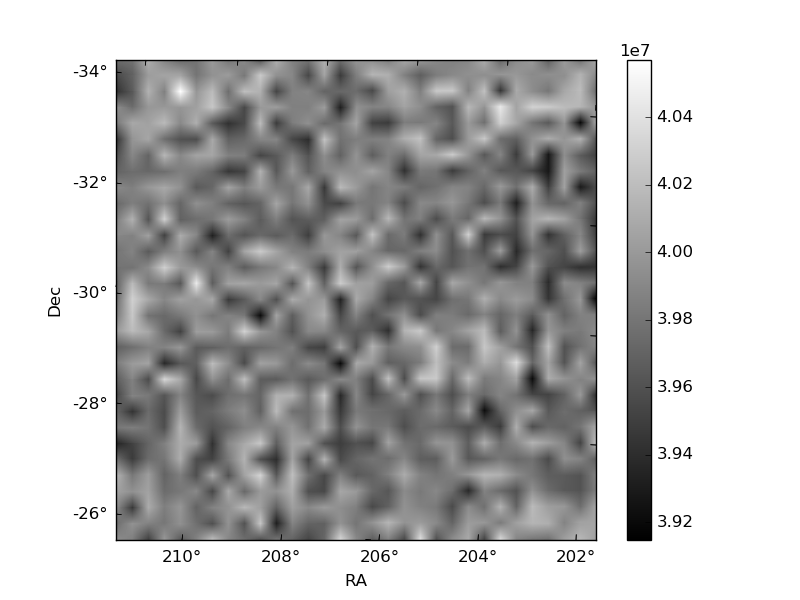
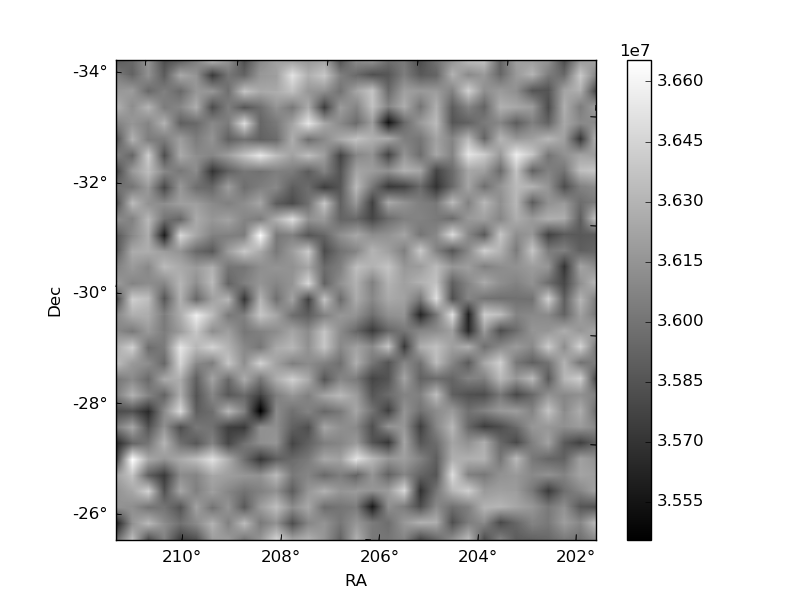
Histogram calculated using DETX and DETY for each event in the final _common_clean file
| Quadrant A | 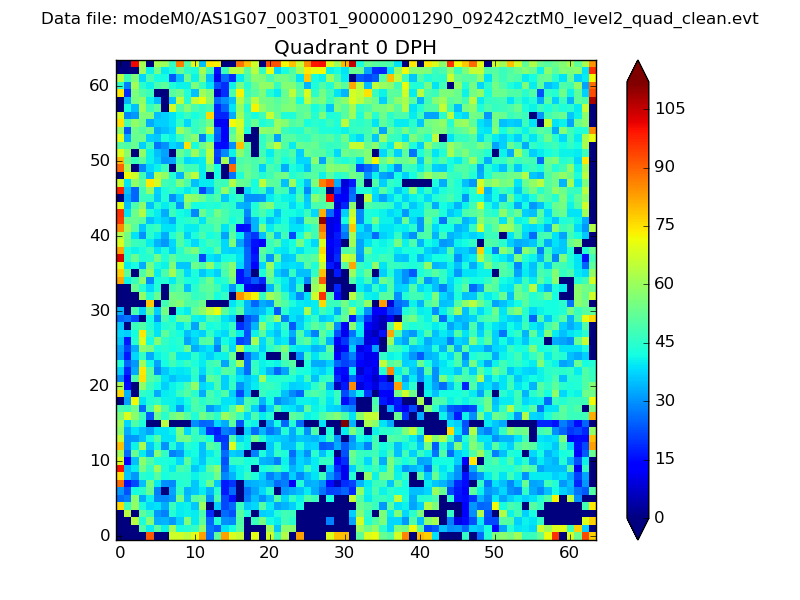 |
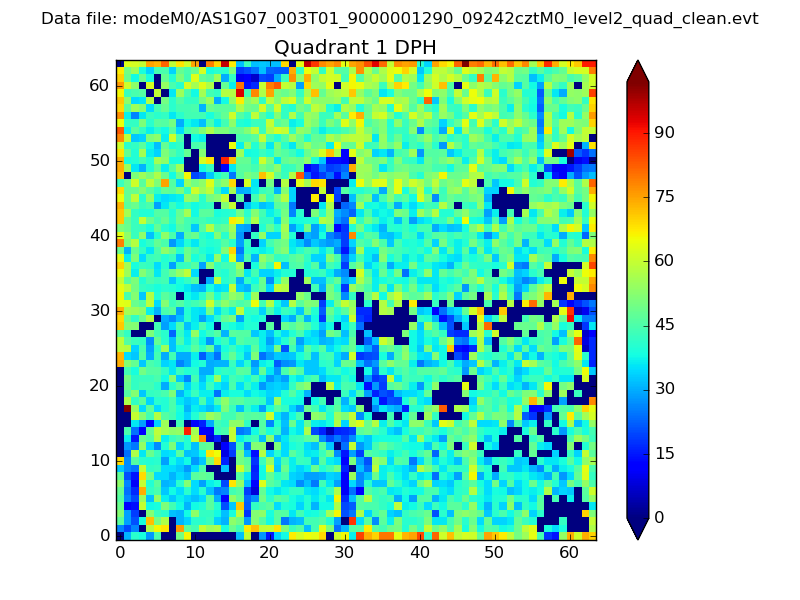 |
Quadrant B |
|---|---|---|---|
| Quadrant D |  |
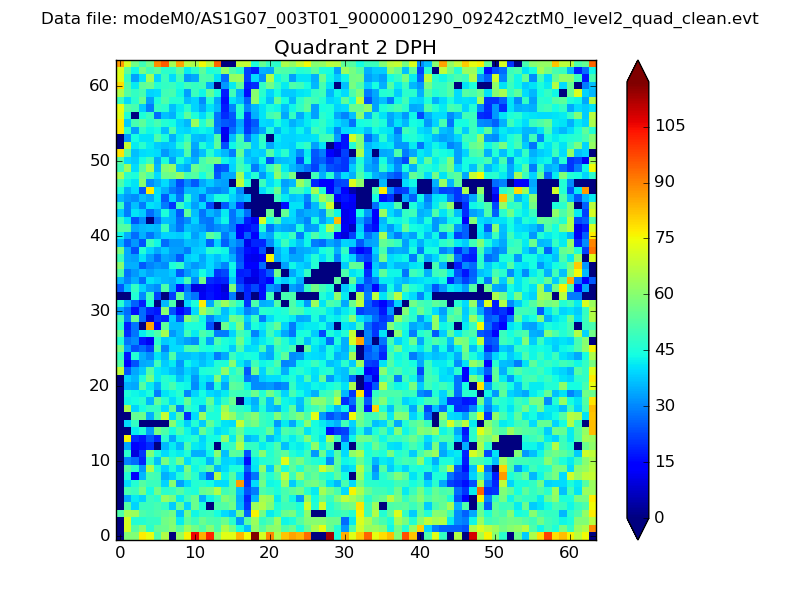 |
Quadrant C |
| Plot type | Count rate plots | Images |
|---|---|---|
| Comparison with Poisson distribution Blue bars denote a histogram of data divided into 1 sec bins. Red curve is a Poisson curve with rate = median count rate of data. |
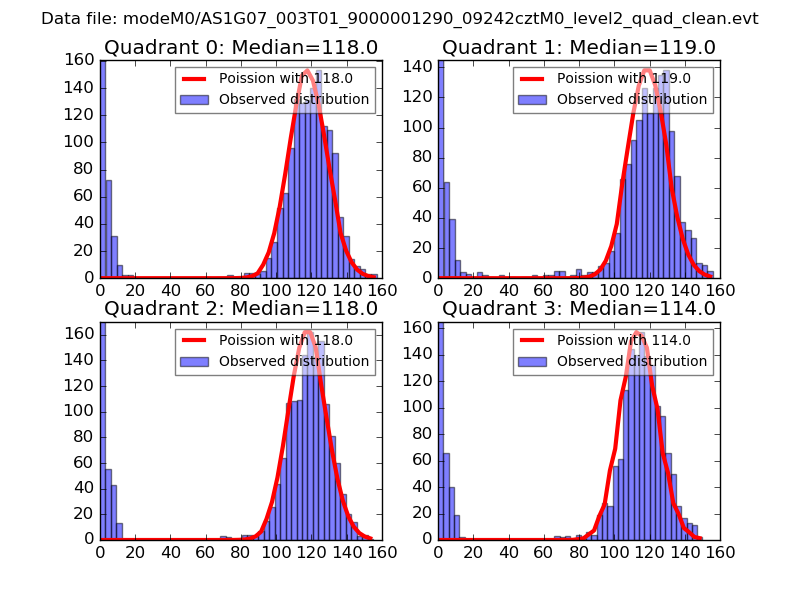 |
 |
| Quadrant-wise count rates Data is divided into 100 sec bins |
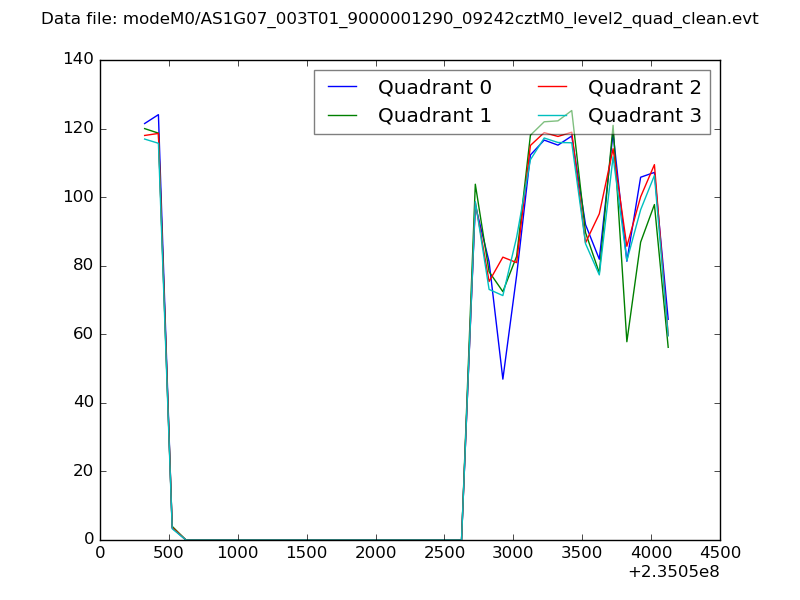 |
|
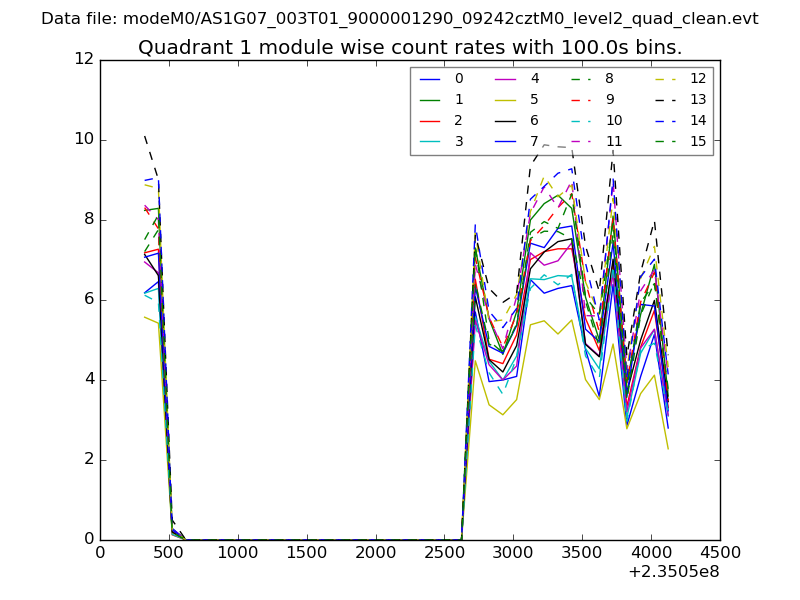
| Module-wise count rates for Quadrant A Data is divided into 100 sec bins |
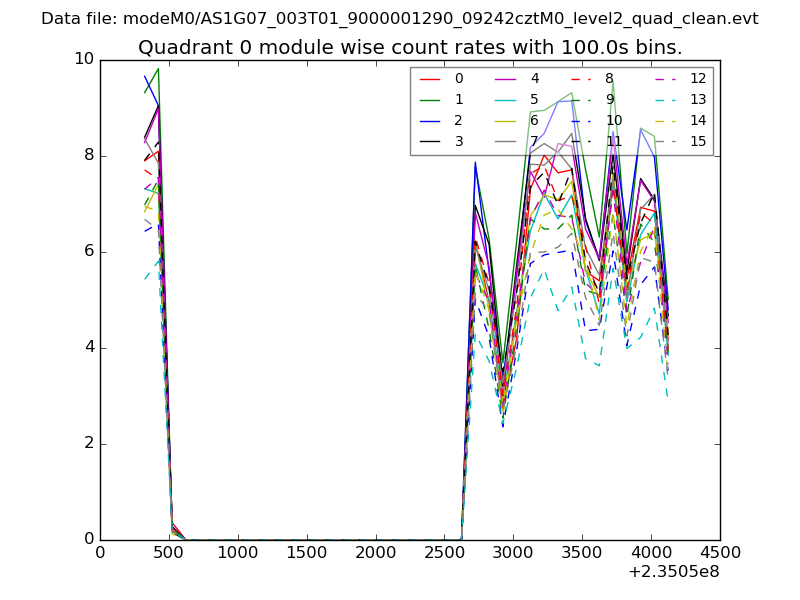 |
 |
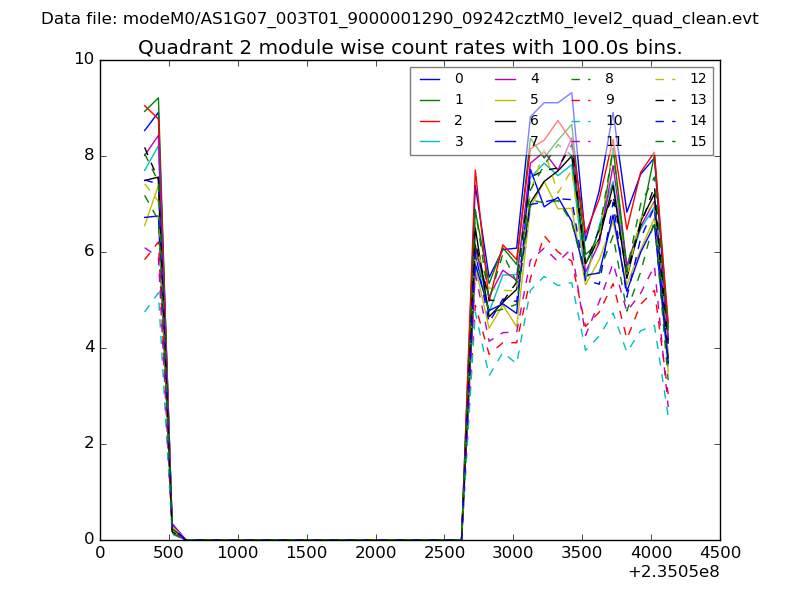
| Module-wise count rates for Quadrant B Data is divided into 100 sec bins |
 |
 |
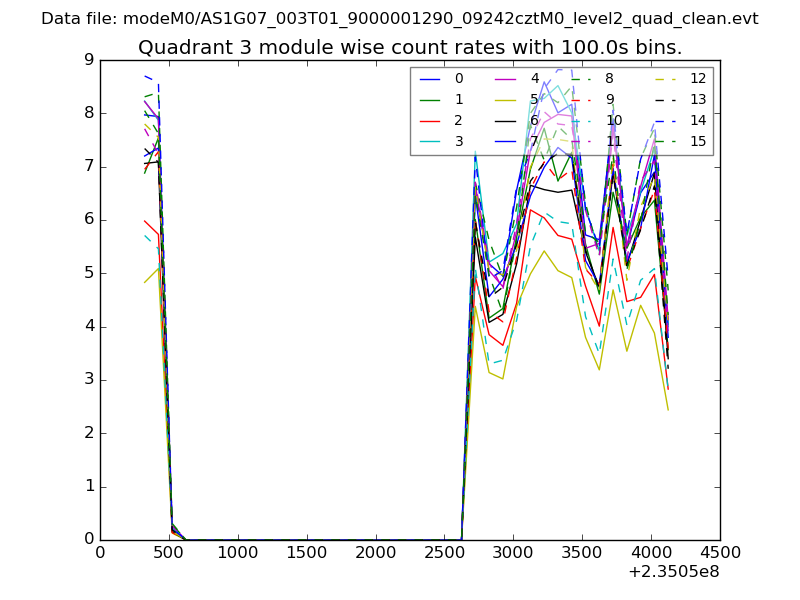
| Module-wise count rates for Quadrant C Data is divided into 100 sec bins |
 |
 |
| Module-wise count rates for Quadrant D Data is divided into 100 sec bins |
 |
 |
| Parameter | Plot |
|---|---|
| CZT HV Monitor | 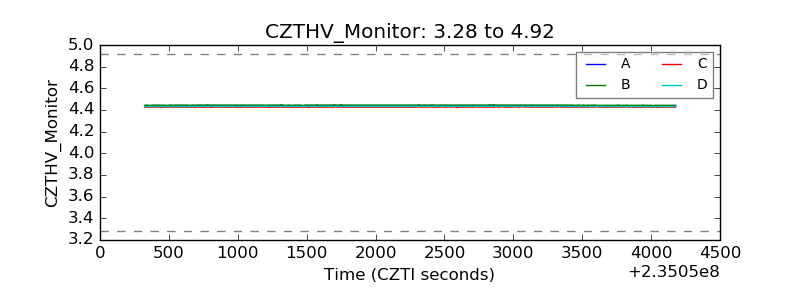 |
| D_VDD | 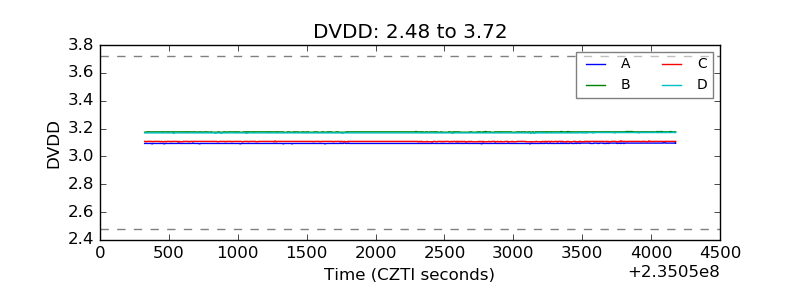 |
| Temperature 1 | 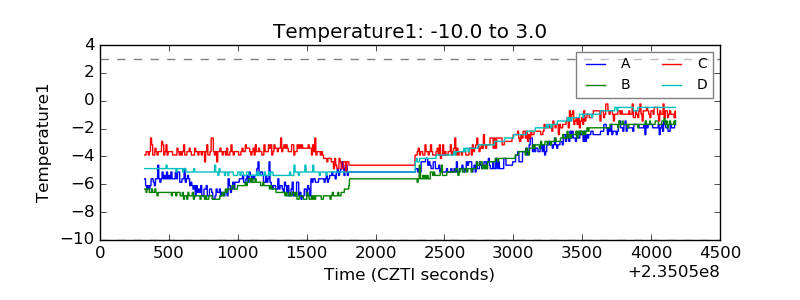 |
| Veto HV Monitor | 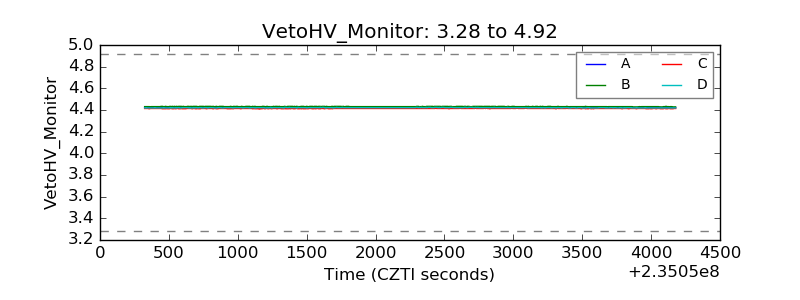 |
| Veto LLD | 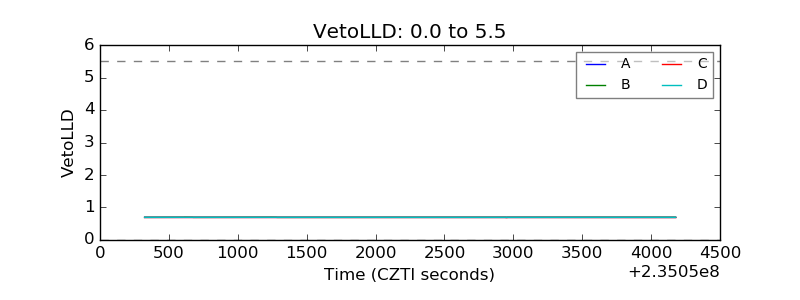 |
| Alpha Counter | 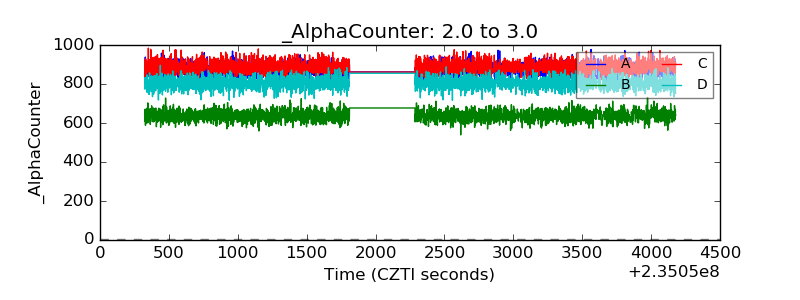 |
| _CPM_Rate | 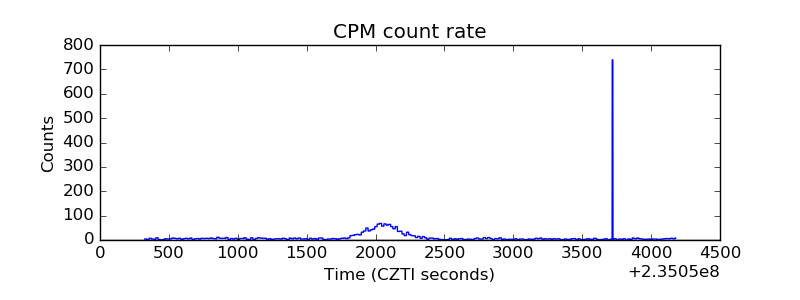 |
| CZT Counter | 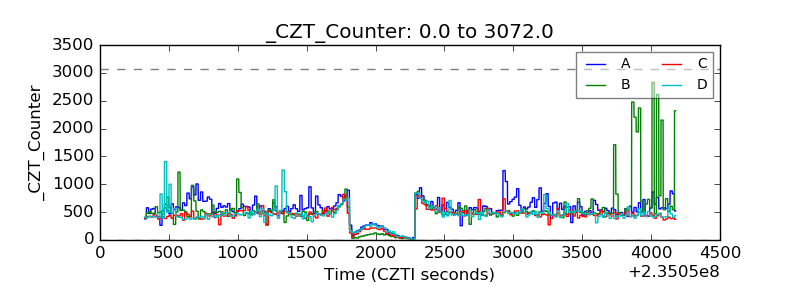 |
| +2.5 Volts monitor |  |
| +5 Volts monitor |  |
| _ROLL_ROT | 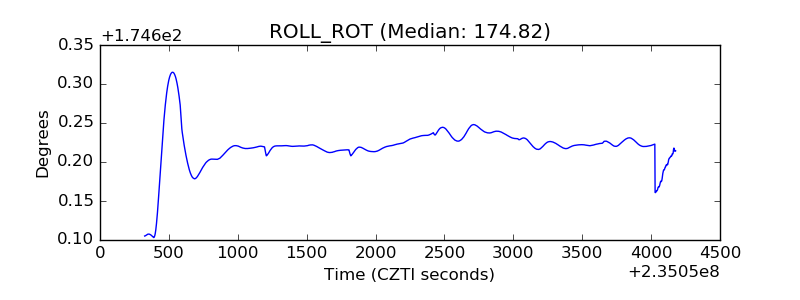 |
| _Roll_DEC | 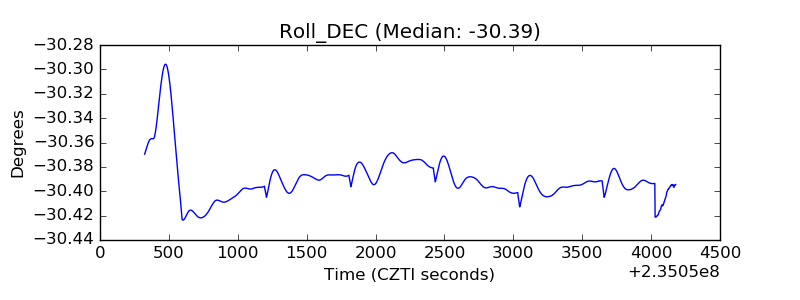 |
| _Roll_RA | 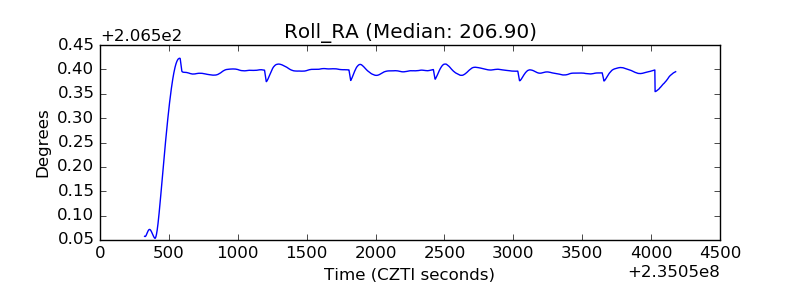 |
| Veto Counter | 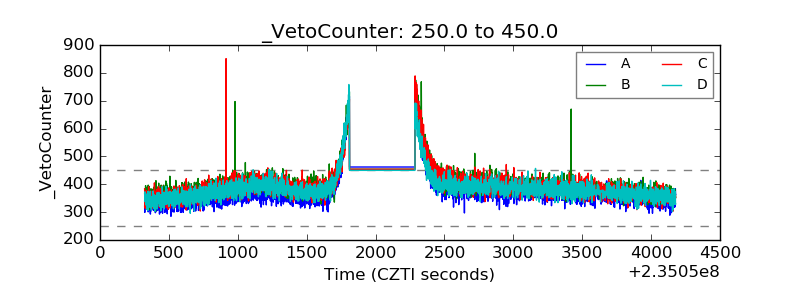 |