| Param | Original file | Final file |
|---|---|---|
| Filename | modeM0/AS1G07_003T01_9000001290_09243cztM0_level2.evt | modeM0/AS1G07_003T01_9000001290_09243cztM0_level2_quad_clean.evt |
| Size (bytes) | 998,844,480 | 162,604,800 |
| Size | 952.6 MB | 155.1 MB |
| Events in quadrant A | 10,297,582 | 1,011,418 |
| Events in quadrant B | 6,994,937 | 1,024,731 |
| Events in quadrant C | 5,765,915 | 1,011,183 |
| Events in quadrant D | 6,321,251 | 988,709 |
| Mode M0 | |||
|---|---|---|---|
| Quadrant | BADHDUFLAG | Total packets | Discarded packets |
| A | 0 | 42474 | 3431 |
| B | 0 | 31675 | 2708 |
| C | 0 | 28788 | 2554 |
| D | 0 | 30781 | 2905 |
| Mode M9 | |||
|---|---|---|---|
| Quadrant | BADHDUFLAG | Total packets | Discarded packets |
| A | 0 | 20 | 0 |
| B | 0 | 20 | 0 |
| C | 0 | 20 | 1 |
| D | 0 | 20 | 0 |
| Mode SS | |||
|---|---|---|---|
| Quadrant | BADHDUFLAG | Total packets | Discarded packets |
| A | 0 | 290 | 22 |
| B | 0 | 290 | 20 |
| C | 0 | 290 | 28 |
| D | 0 | 289 | 27 |
| Quadrant | Total seconds | Saturated seconds | Saturation percentage |
|---|---|---|---|
| A | 12771 | 1329 | 10.406389% |
| B | 12878 | 275 | 2.135425% |
| C | 12909 | 74 | 0.573243% |
| D | 12825 | 242 | 1.886940% |
Noise dominated data is calculated using 1-second bins in cleaned event files. If a bin has >2000 counts, and if more than 50% of those come from <1% of pixels, then it is considered to be noise-dominated and hence unusable.
| Quadrant | # 1 sec bins | Bins with >0 counts | Bins with >2000 counts | High rate bins dominated by noise | Noise dominated (total time) | Noise dominated (detector-on time) | Marked lightcurve |
|---|---|---|---|---|---|---|---|
| A | 16206 | 13216 | 1032 | 1032 | 6.37% | 7.81% |  |
| B | 16206 | 13310 | 146 | 146 | 0.90% | 1.10% | 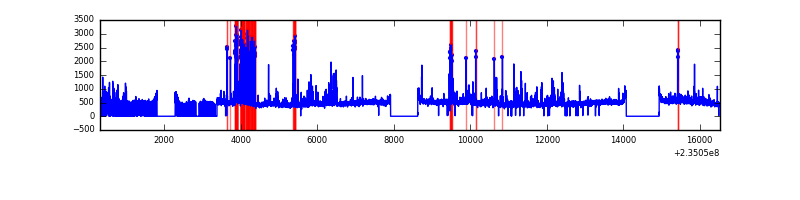 |
| C | 16207 | 13314 | 0 | 0 | 0.00% | 0.00% | 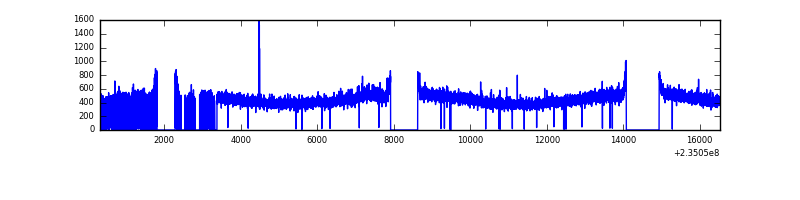 |
| D | 16207 | 13249 | 143 | 143 | 0.88% | 1.08% | 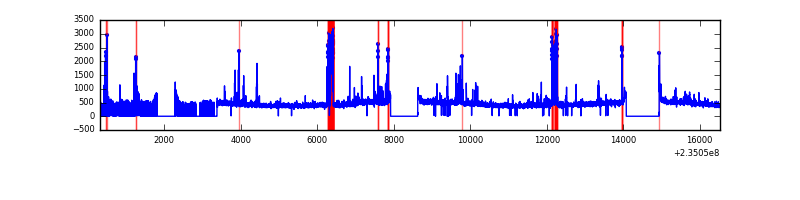 |
Top three noisy pixels from each quadrant. If the there are fewer than three noisy pixels in the level2.evt file, extra rows are filled as -1
| Pixel properties | Quadrant properties | ||||||
|---|---|---|---|---|---|---|---|
| Quadrant | DetID | PixID | Counts | Sigma | Mean | Median | Sigma |
| A | 8 | 5 | 2070107 | 7055.76 | 1440 | 1412 | 293.2 |
| A | 15 | 223 | 1132568 | 3858.07 | 1440 | 1412 | 293.2 |
| A | 15 | 174 | 806256 | 2745.1 | 1440 | 1412 | 293.2 |
| B | 6 | 51 | 464106 | 1594.66 | 1522 | 1485 | 290.1 |
| B | 4 | 48 | 265927 | 911.54 | 1522 | 1485 | 290.1 |
| B | 0 | 214 | 137408 | 468.53 | 1522 | 1485 | 290.1 |
| C | 13 | 61 | 11368 | 29.05 | 1472 | 1476 | 340.5 |
| C | 8 | 222 | 10245 | 25.75 | 1472 | 1476 | 340.5 |
| C | 3 | 254 | 8242 | 19.87 | 1472 | 1476 | 340.5 |
| D | 7 | 71 | 451019 | 1136.8 | 1455 | 1421 | 395.5 |
| D | 1 | 52 | 161452 | 404.64 | 1455 | 1421 | 395.5 |
| D | 12 | 233 | 80121 | 198.99 | 1455 | 1421 | 395.5 |
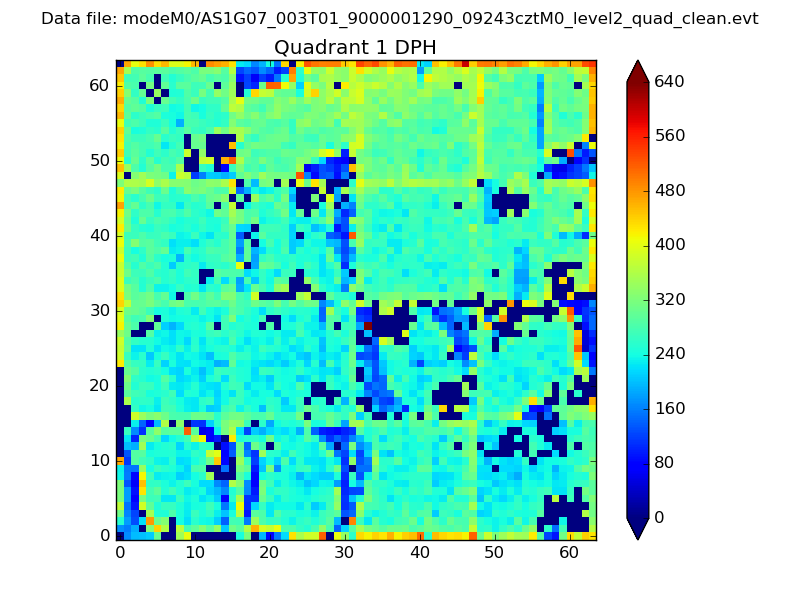
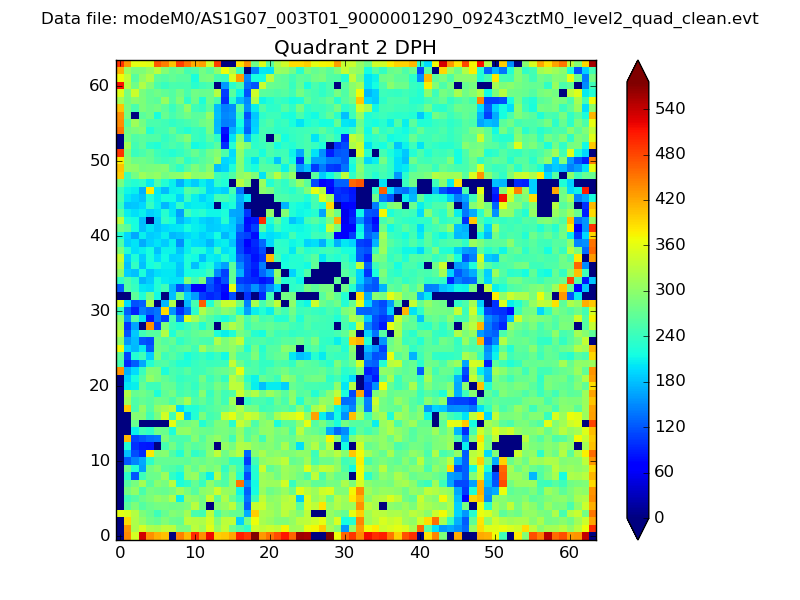
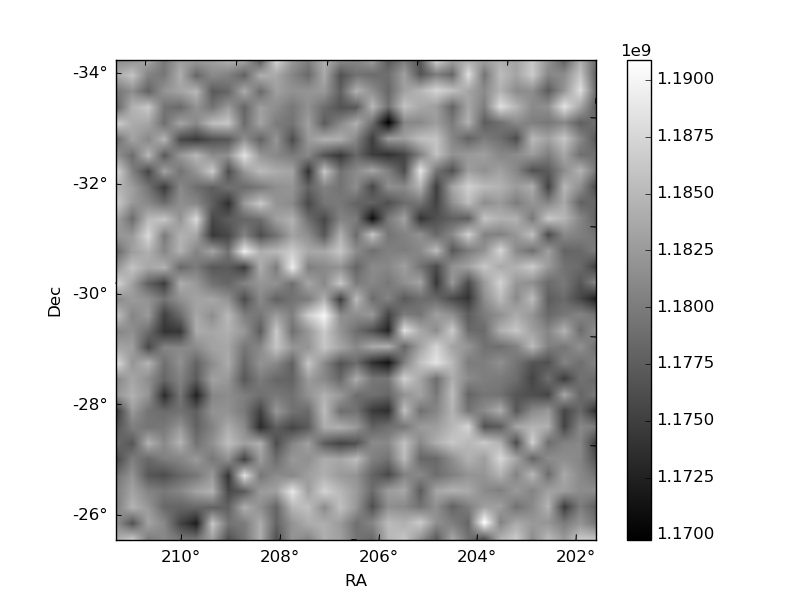
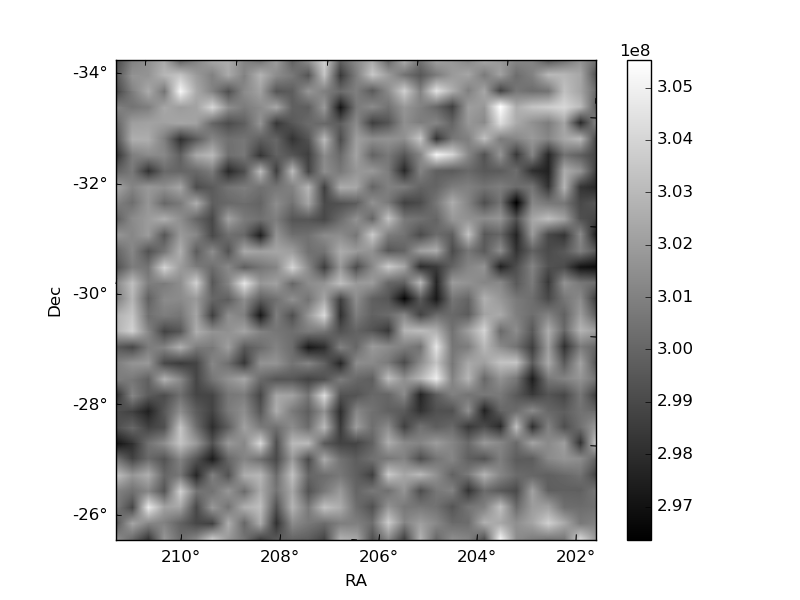
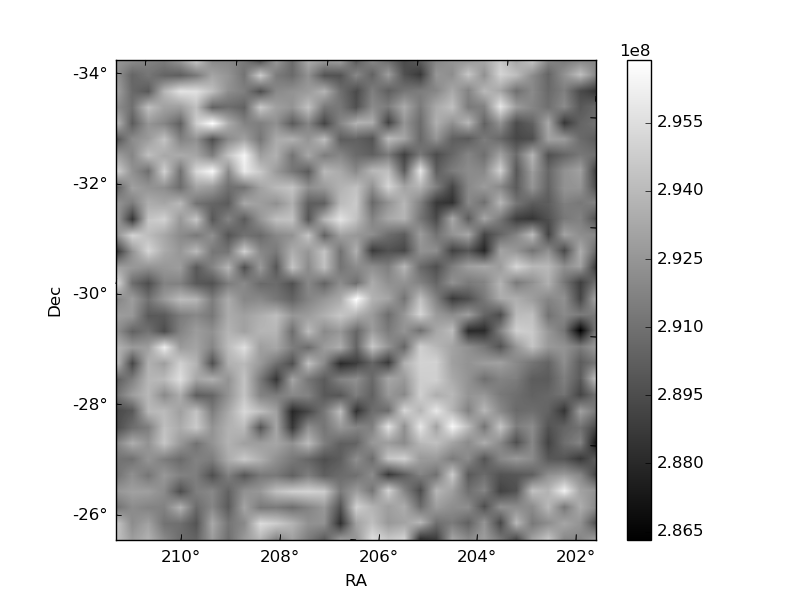
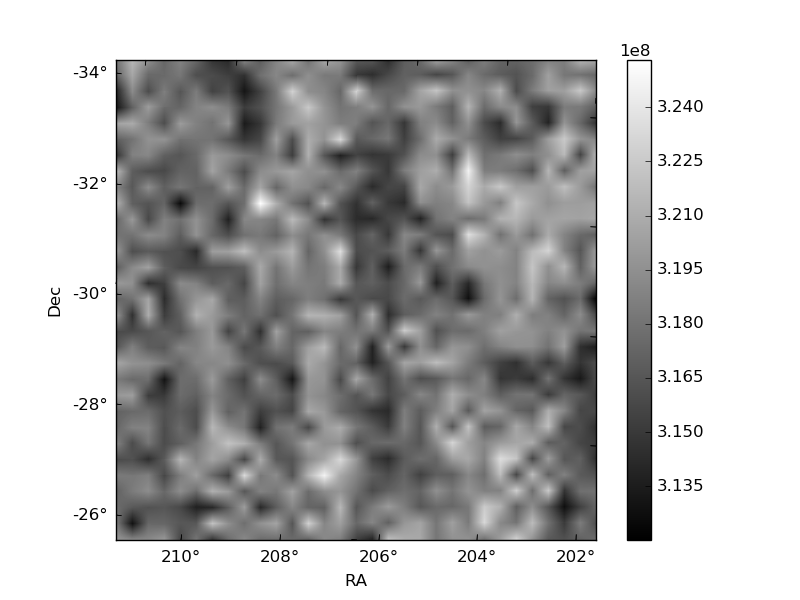
Histogram calculated using DETX and DETY for each event in the final _common_clean file
| Quadrant A | 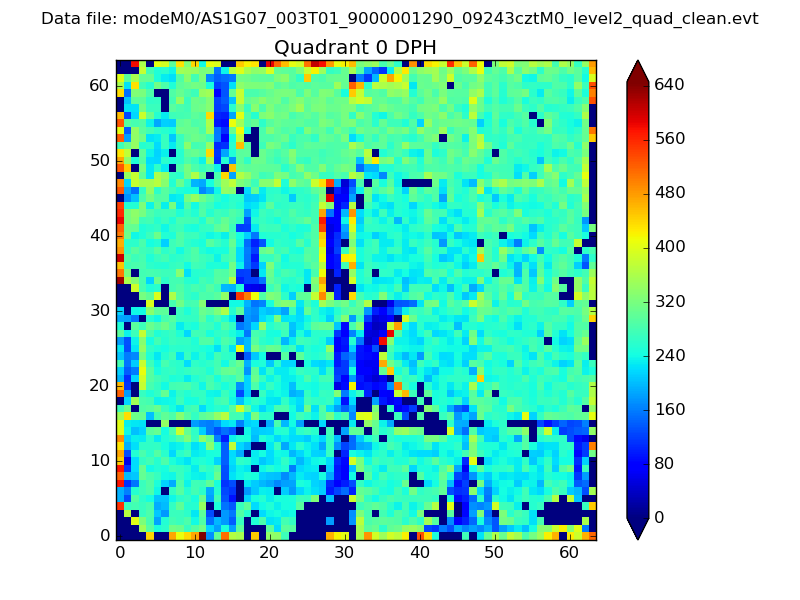 |
 |
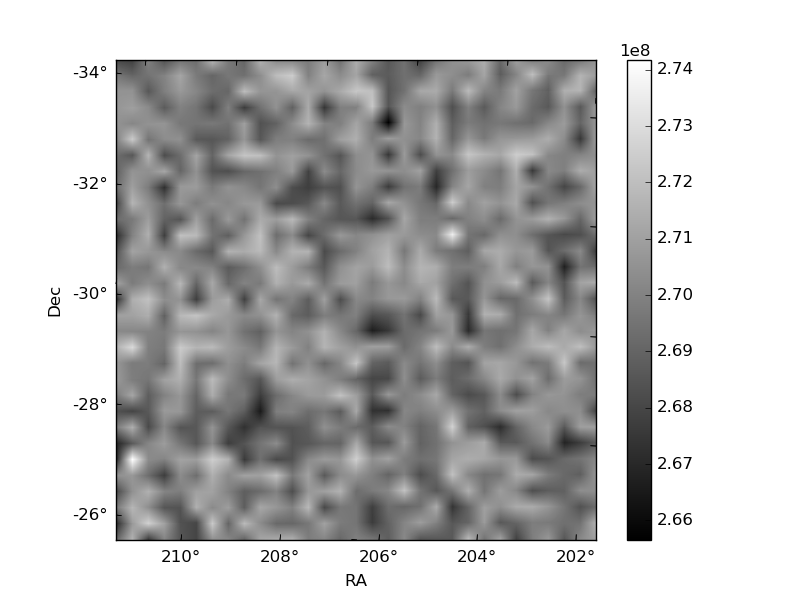
Quadrant B |
|---|---|---|---|
| Quadrant D | 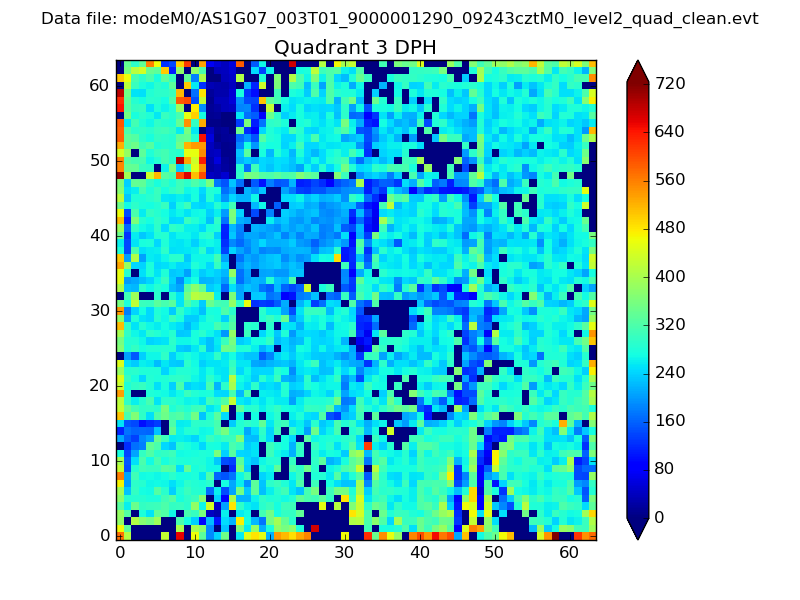 |
 |
Quadrant C |
| Plot type | Count rate plots | Images |
|---|---|---|
| Comparison with Poisson distribution Blue bars denote a histogram of data divided into 1 sec bins. Red curve is a Poisson curve with rate = median count rate of data. |
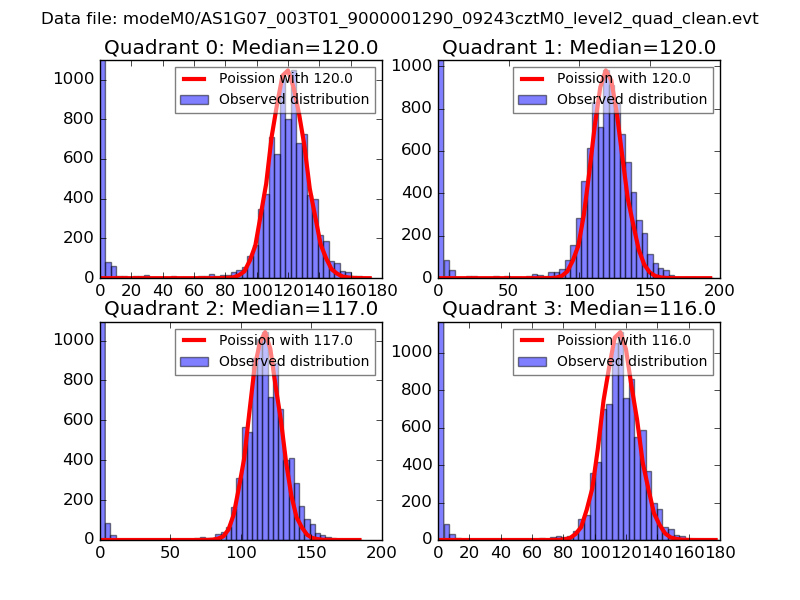 |
 |
| Quadrant-wise count rates Data is divided into 100 sec bins |
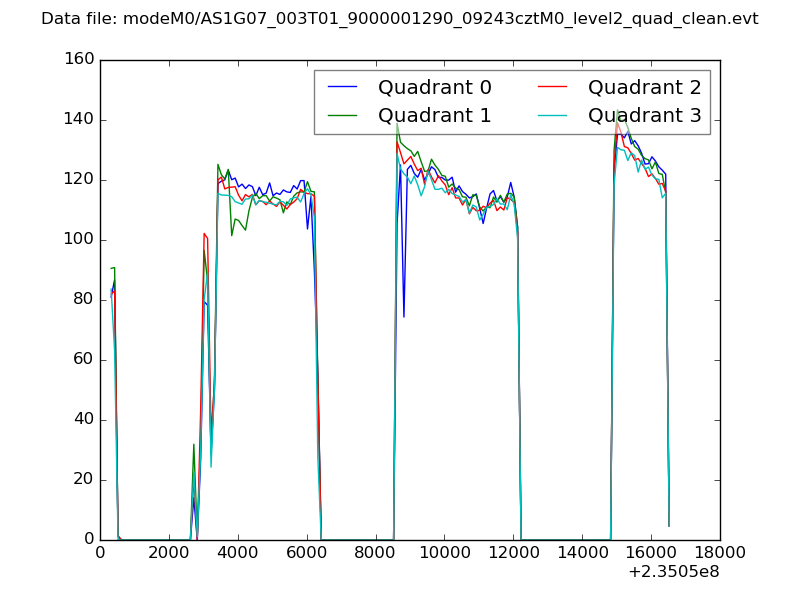 |
|
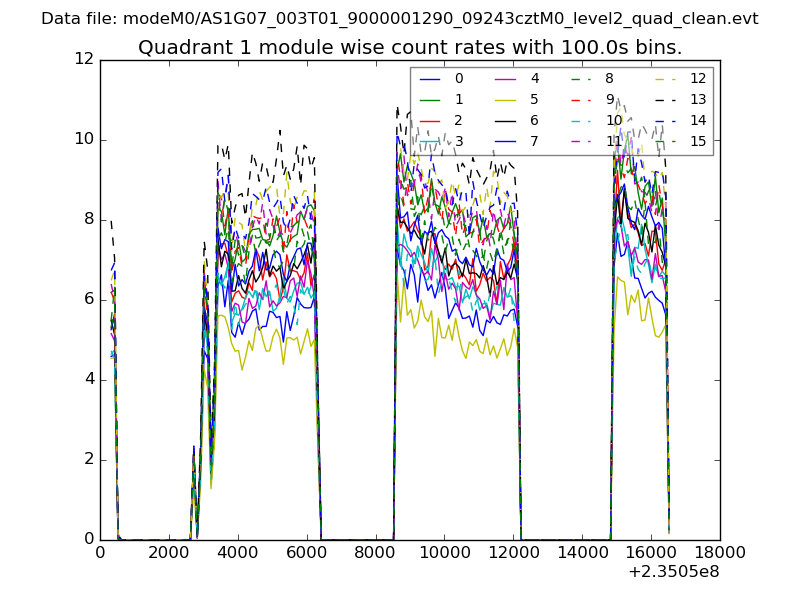
| Module-wise count rates for Quadrant A Data is divided into 100 sec bins |
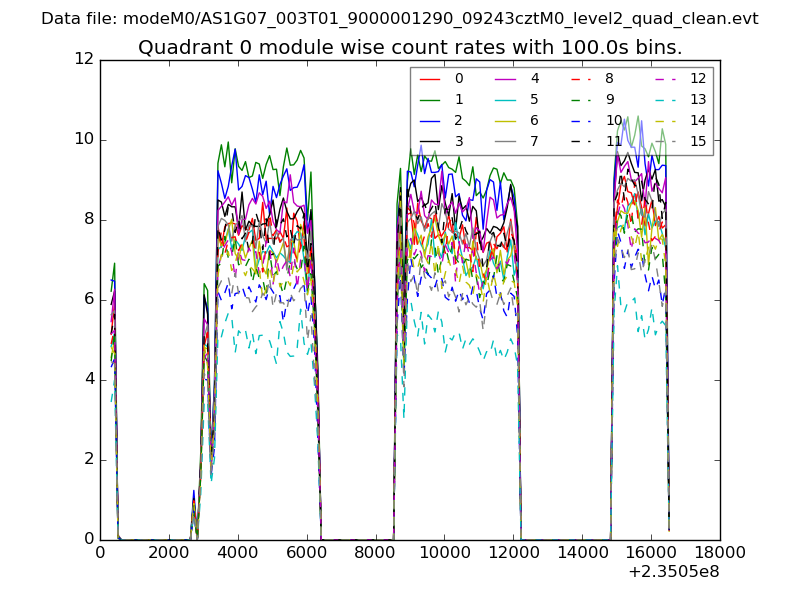 |
 |
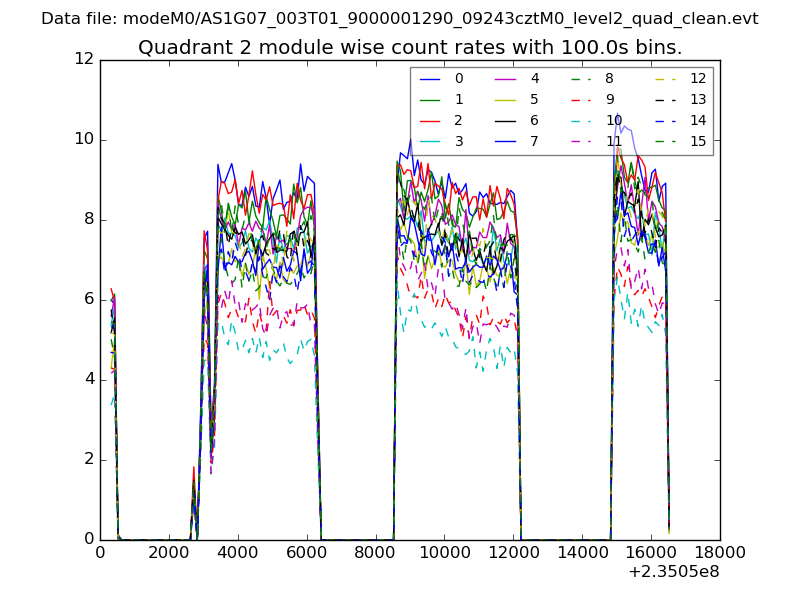
| Module-wise count rates for Quadrant B Data is divided into 100 sec bins |
 |
 |
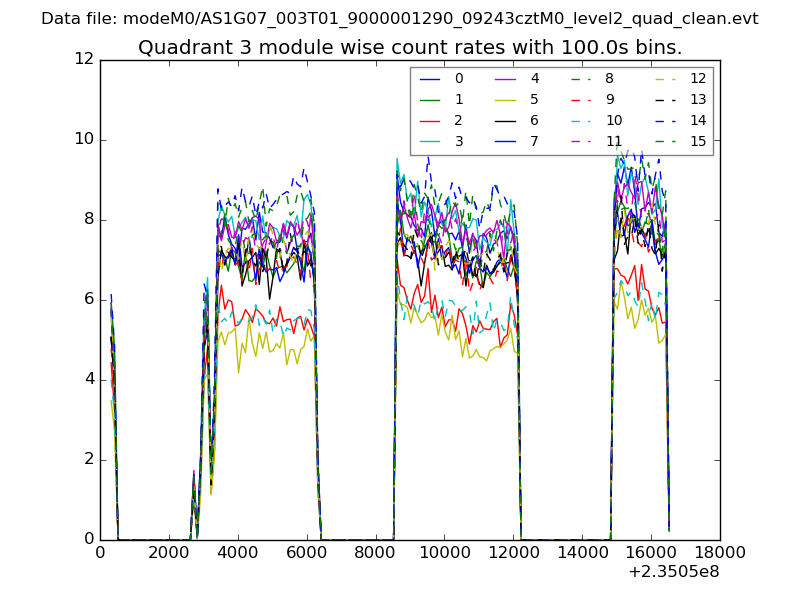
| Module-wise count rates for Quadrant C Data is divided into 100 sec bins |
 |
 |
| Module-wise count rates for Quadrant D Data is divided into 100 sec bins |
 |
 |
| Parameter | Plot |
|---|---|
| CZT HV Monitor | 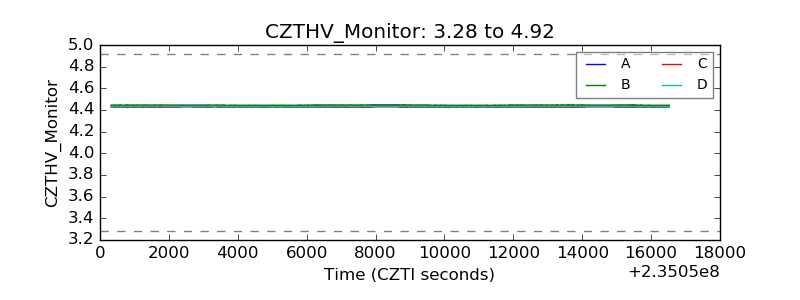 |
| D_VDD |  |
| Temperature 1 | 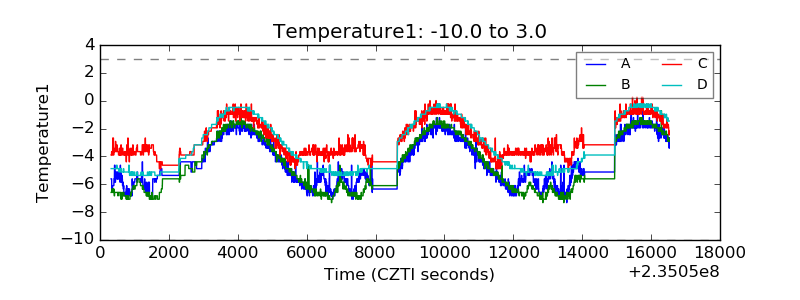 |
| Veto HV Monitor | 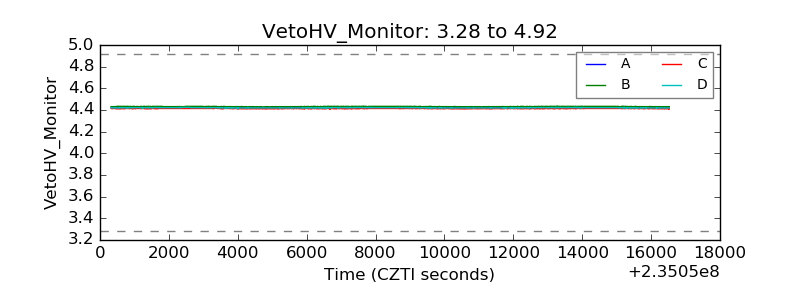 |
| Veto LLD | 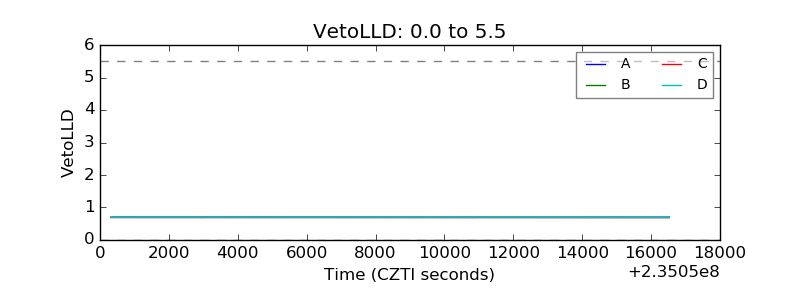 |
| Alpha Counter | 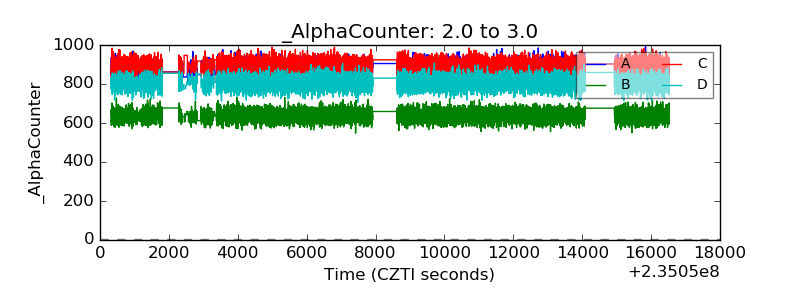 |
| _CPM_Rate | 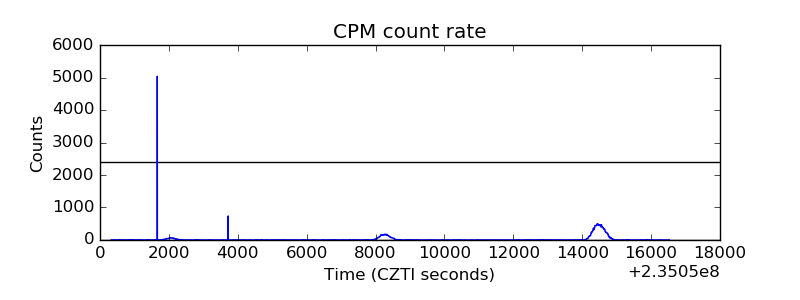 |
| CZT Counter | 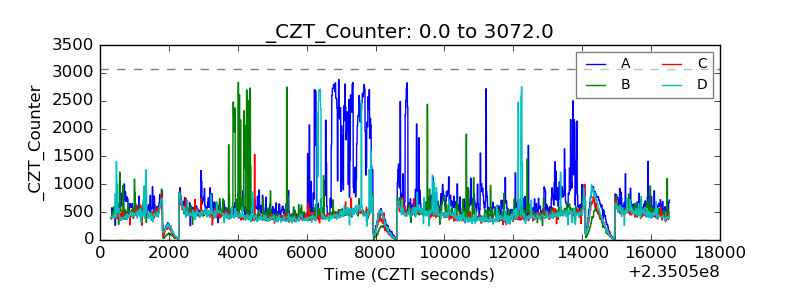 |
| +2.5 Volts monitor |  |
| +5 Volts monitor |  |
| _ROLL_ROT | 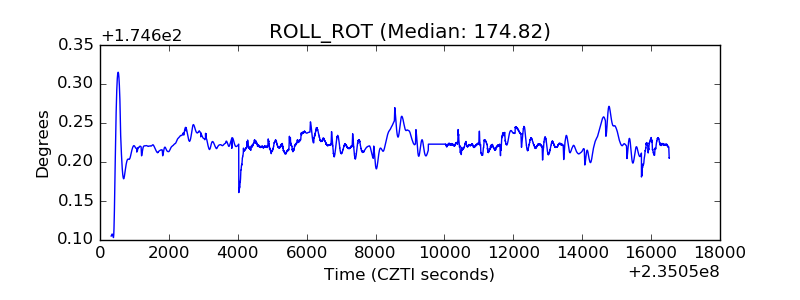 |
| _Roll_DEC | 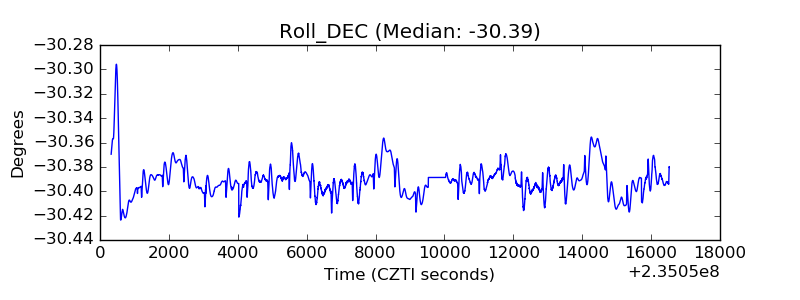 |
| _Roll_RA | 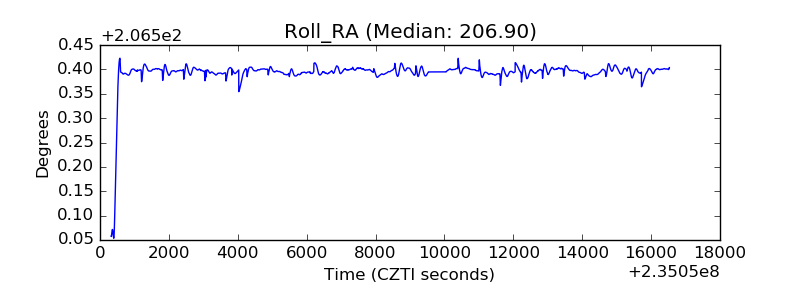 |
| Veto Counter | 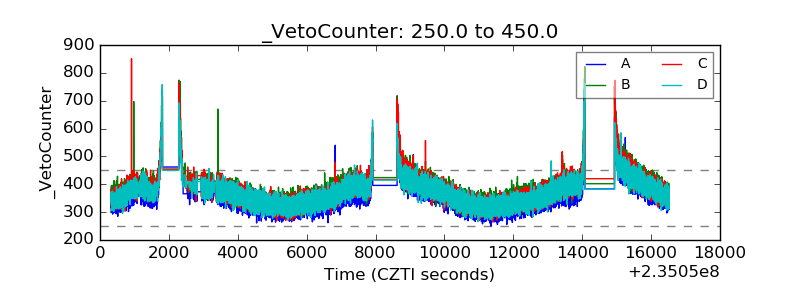 |