| Param | Original file | Final file |
|---|---|---|
| Filename | modeM0/AS1G07_003T01_9000001290_09246cztM0_level2.evt | modeM0/AS1G07_003T01_9000001290_09246cztM0_level2_quad_clean.evt |
| Size (bytes) | 443,989,440 | 87,456,960 |
| Size | 423.4 MB | 83.4 MB |
| Events in quadrant A | 3,776,121 | 560,028 |
| Events in quadrant B | 3,268,365 | 564,757 |
| Events in quadrant C | 2,940,484 | 545,660 |
| Events in quadrant D | 3,027,190 | 532,482 |
| Mode M0 | |||
|---|---|---|---|
| Quadrant | BADHDUFLAG | Total packets | Discarded packets |
| A | 0 | 15552 | 177 |
| B | 0 | 14021 | 113 |
| C | 0 | 13243 | 93 |
| D | 0 | 13610 | 97 |
| Mode M9 | |||
|---|---|---|---|
| Quadrant | BADHDUFLAG | Total packets | Discarded packets |
| A | 0 | 15 | 1 |
| B | 0 | 15 | 0 |
| C | 0 | 15 | 0 |
| D | 0 | 16 | 0 |
| Mode SS | |||
|---|---|---|---|
| Quadrant | BADHDUFLAG | Total packets | Discarded packets |
| A | 0 | 130 | 2 |
| B | 0 | 130 | 0 |
| C | 0 | 130 | 2 |
| D | 0 | 130 | 0 |
| Quadrant | Total seconds | Saturated seconds | Saturation percentage |
|---|---|---|---|
| A | 6378 | 63 | 0.987770% |
| B | 6387 | 47 | 0.735870% |
| C | 6394 | 20 | 0.312793% |
| D | 6394 | 21 | 0.328433% |
Noise dominated data is calculated using 1-second bins in cleaned event files. If a bin has >2000 counts, and if more than 50% of those come from <1% of pixels, then it is considered to be noise-dominated and hence unusable.
| Quadrant | # 1 sec bins | Bins with >0 counts | Bins with >2000 counts | High rate bins dominated by noise | Noise dominated (total time) | Noise dominated (detector-on time) | Marked lightcurve |
|---|---|---|---|---|---|---|---|
| A | 7588 | 6434 | 27 | 27 | 0.36% | 0.42% | 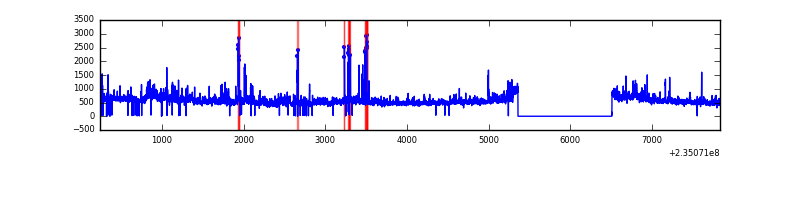 |
| B | 7588 | 6439 | 15 | 15 | 0.20% | 0.23% | 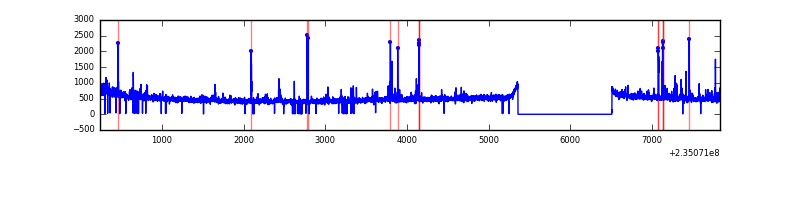 |
| C | 7588 | 6439 | 8 | 8 | 0.11% | 0.12% | 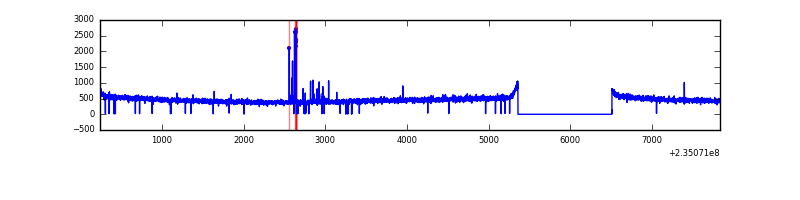 |
| D | 7588 | 6437 | 8 | 8 | 0.11% | 0.12% | 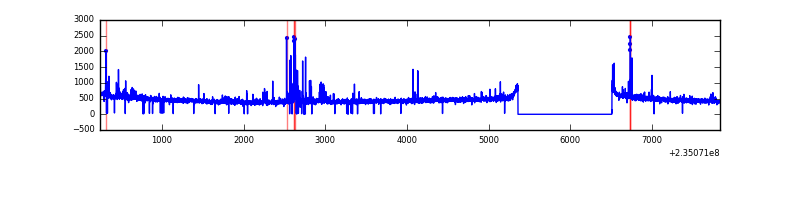 |
Top three noisy pixels from each quadrant. If the there are fewer than three noisy pixels in the level2.evt file, extra rows are filled as -1
| Pixel properties | Quadrant properties | ||||||
|---|---|---|---|---|---|---|---|
| Quadrant | DetID | PixID | Counts | Sigma | Mean | Median | Sigma |
| A | 8 | 5 | 677548 | 4275.04 | 777 | 762 | 158.3 |
| A | 15 | 174 | 67768 | 423.26 | 777 | 762 | 158.3 |
| A | 13 | 251 | 27553 | 169.23 | 777 | 762 | 158.3 |
| B | 0 | 214 | 77071 | 505.3 | 780 | 762 | 151.0 |
| B | 4 | 173 | 53172 | 347.05 | 780 | 762 | 151.0 |
| B | 4 | 48 | 41049 | 266.77 | 780 | 762 | 151.0 |
| C | 14 | 234 | 40031 | 228.29 | 742 | 744 | 172.1 |
| C | 13 | 61 | 5709 | 28.85 | 742 | 744 | 172.1 |
| C | 8 | 222 | 3799 | 17.75 | 742 | 744 | 172.1 |
| D | 7 | 71 | 83641 | 428.83 | 746 | 724 | 193.4 |
| D | 12 | 233 | 44044 | 224.04 | 746 | 724 | 193.4 |
| D | 2 | 234 | 38770 | 196.77 | 746 | 724 | 193.4 |
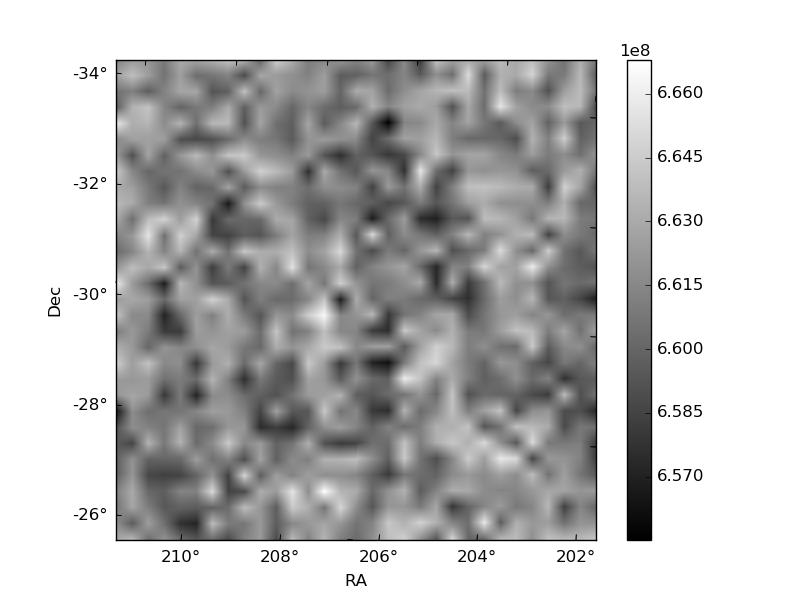
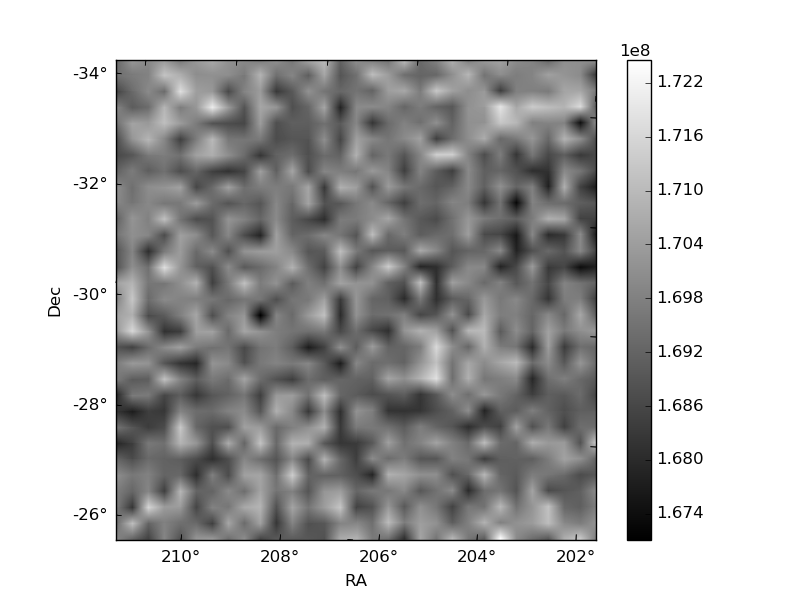
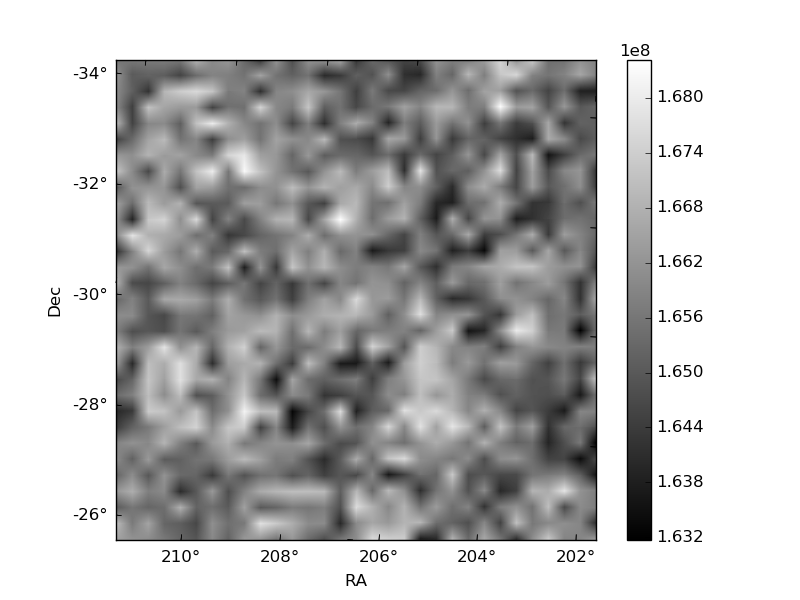
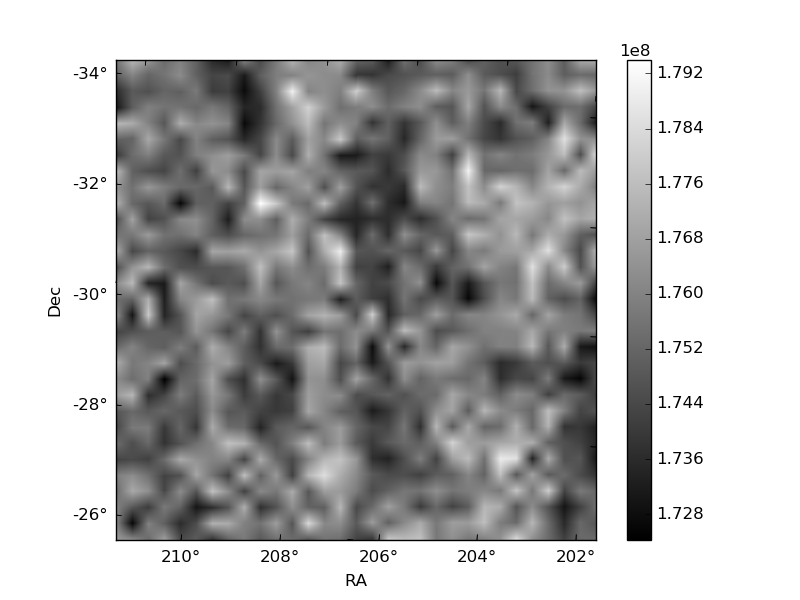
Histogram calculated using DETX and DETY for each event in the final _common_clean file
| Quadrant A | 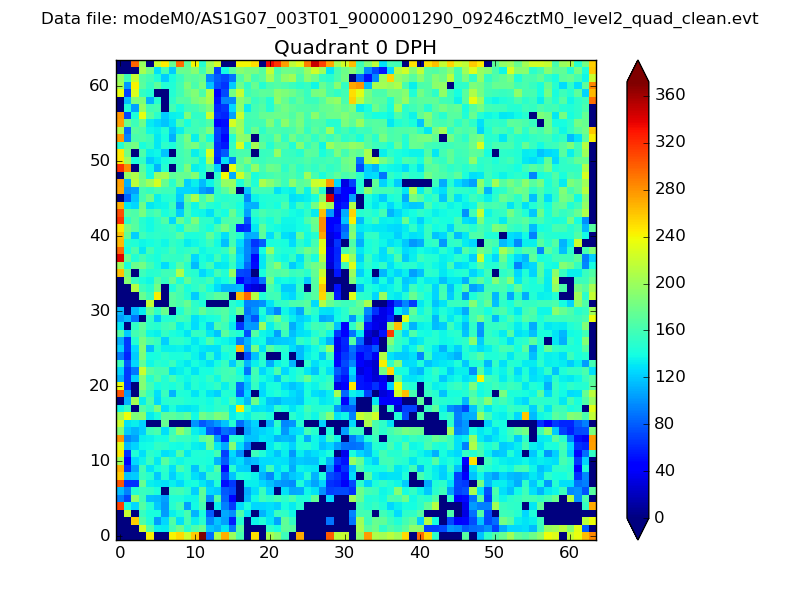 |
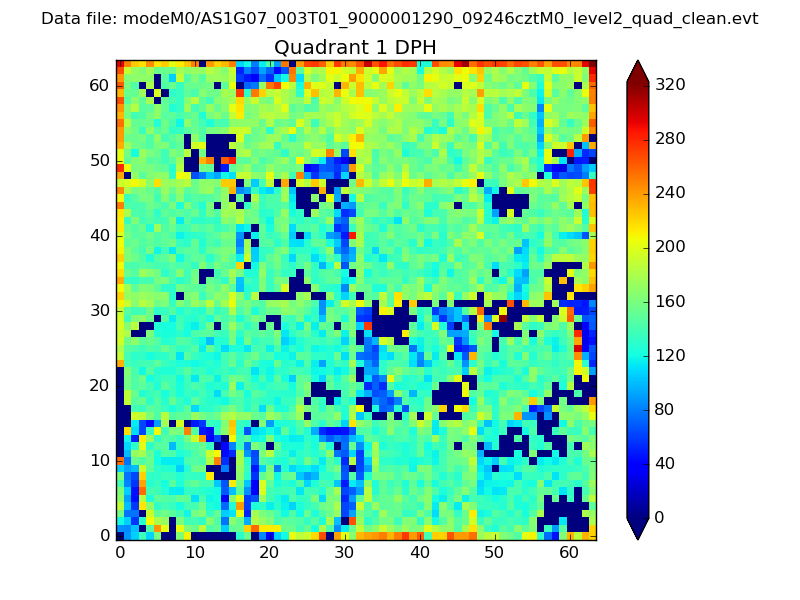 |
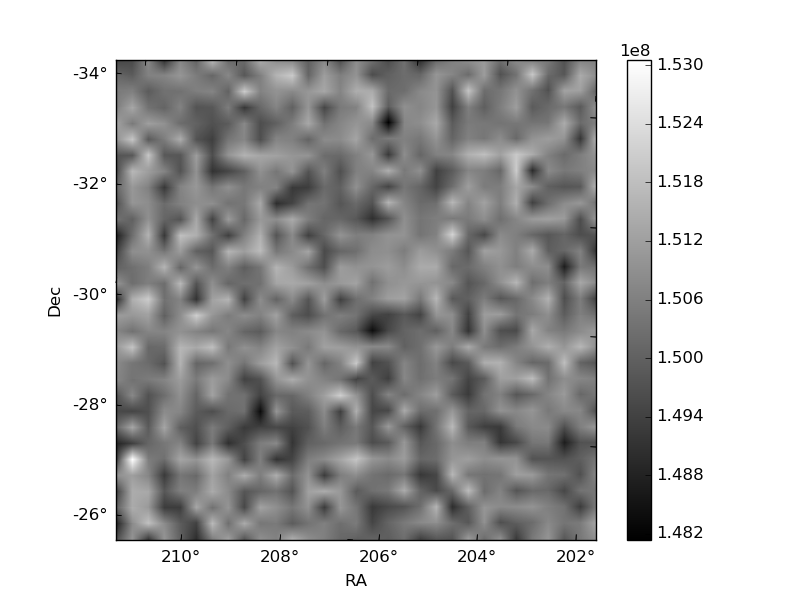
Quadrant B |
|---|---|---|---|
| Quadrant D | 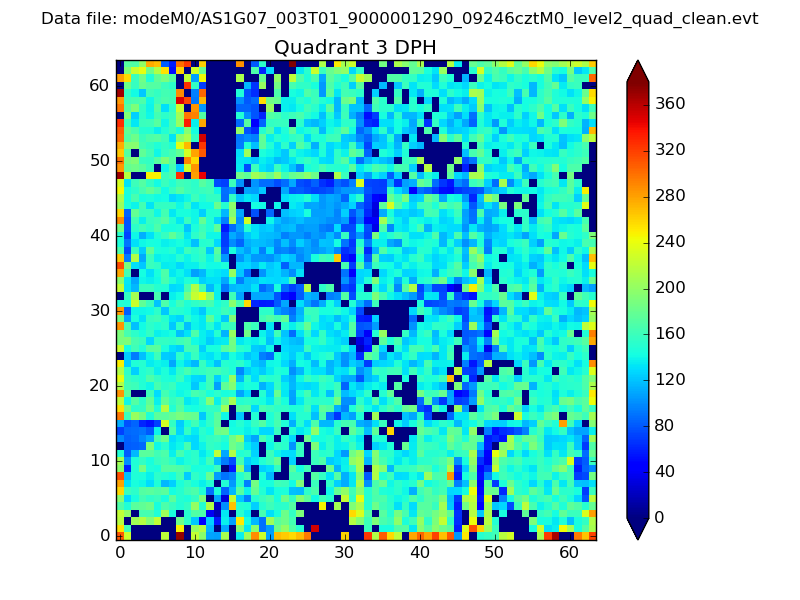 |
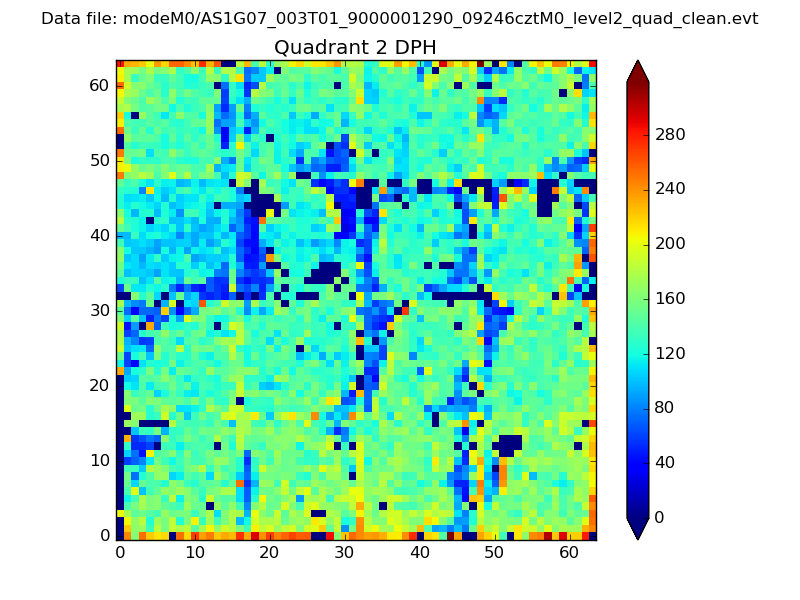 |
Quadrant C |
| Plot type | Count rate plots | Images |
|---|---|---|
| Comparison with Poisson distribution Blue bars denote a histogram of data divided into 1 sec bins. Red curve is a Poisson curve with rate = median count rate of data. |
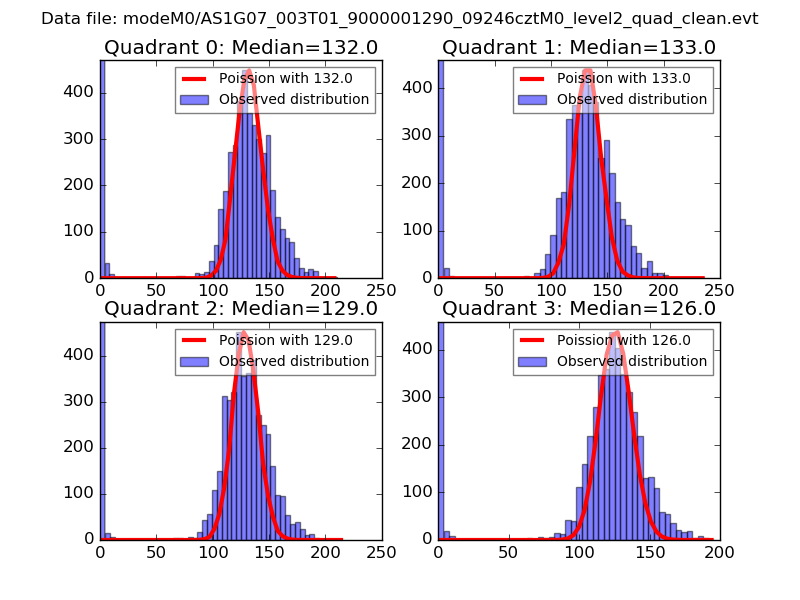 |
 |
| Quadrant-wise count rates Data is divided into 100 sec bins |
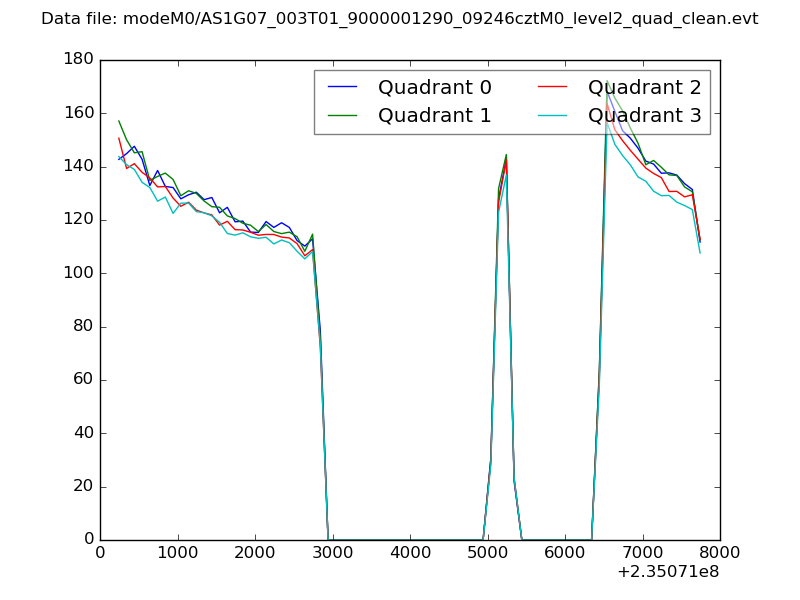 |
|
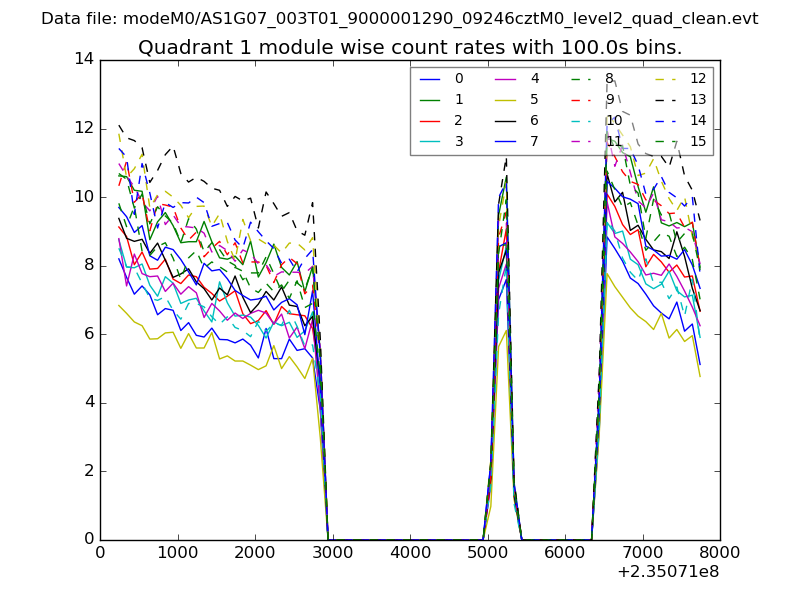
| Module-wise count rates for Quadrant A Data is divided into 100 sec bins |
 |
 |
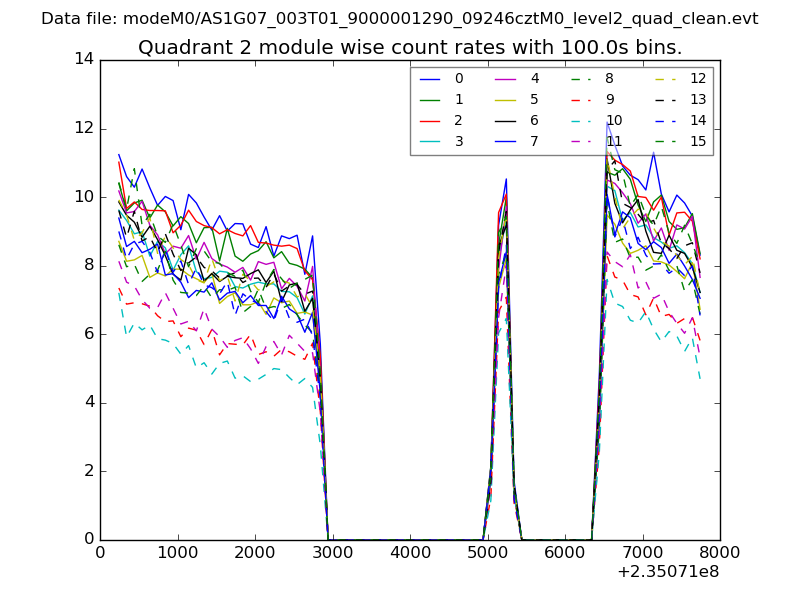
| Module-wise count rates for Quadrant B Data is divided into 100 sec bins |
 |
 |
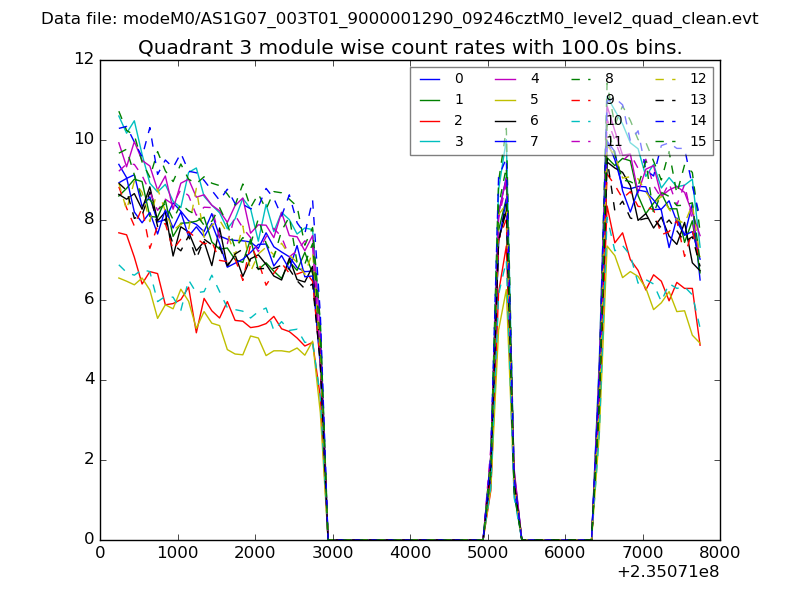
| Module-wise count rates for Quadrant C Data is divided into 100 sec bins |
 |
 |
| Module-wise count rates for Quadrant D Data is divided into 100 sec bins |
 |
 |
| Parameter | Plot |
|---|---|
| CZT HV Monitor | 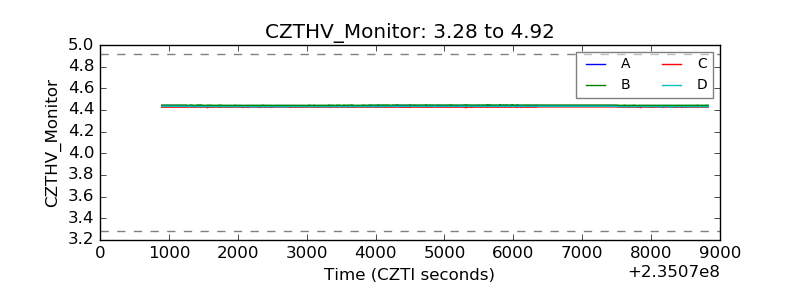 |
| D_VDD | 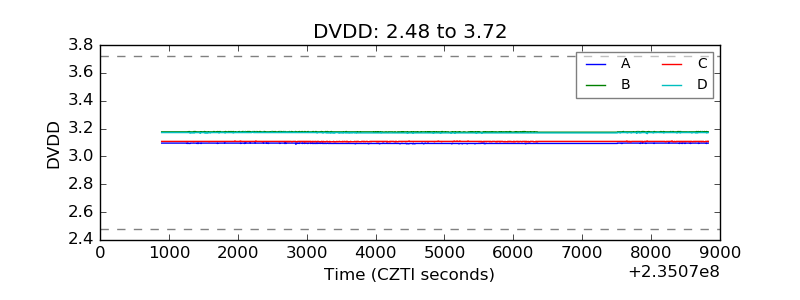 |
| Temperature 1 | 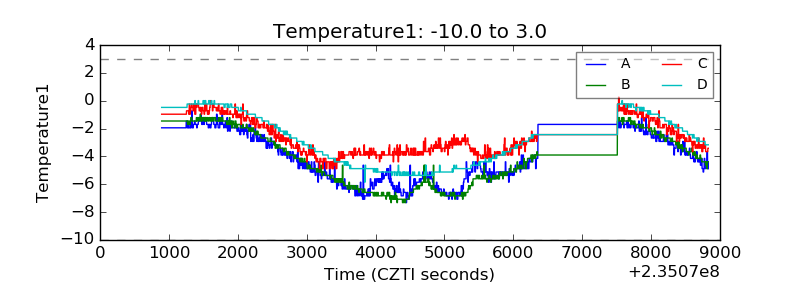 |
| Veto HV Monitor | 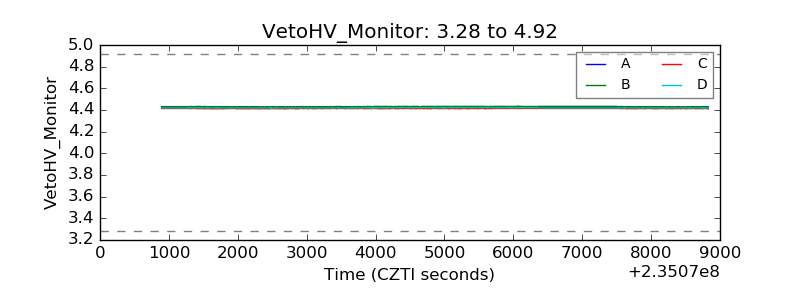 |
| Veto LLD | 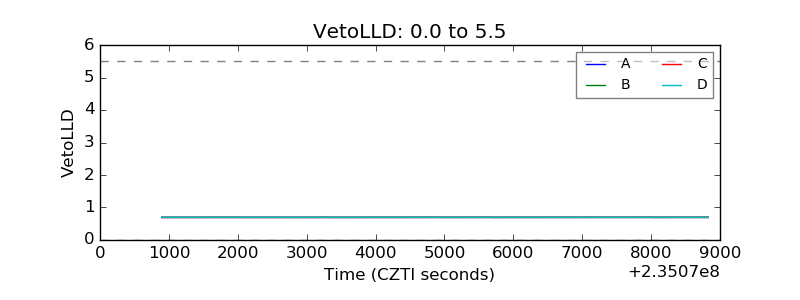 |
| Alpha Counter | 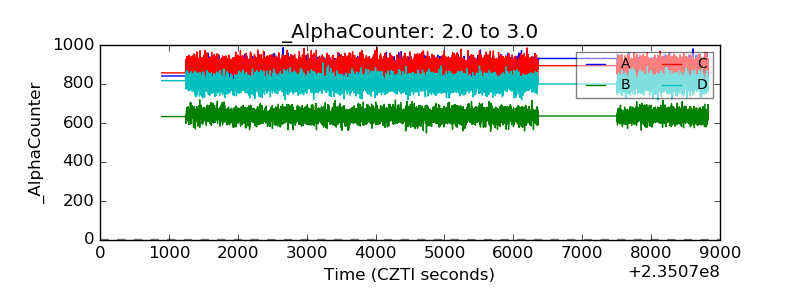 |
| _CPM_Rate | 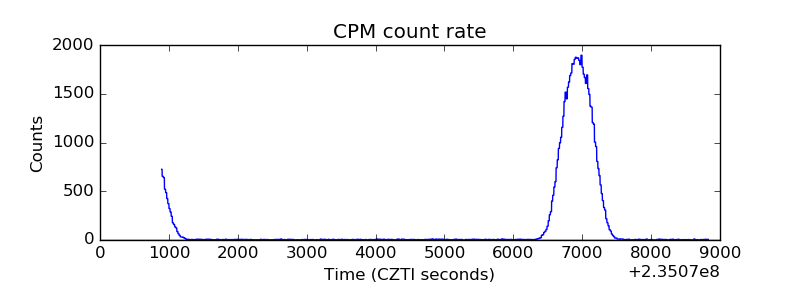 |
| CZT Counter | 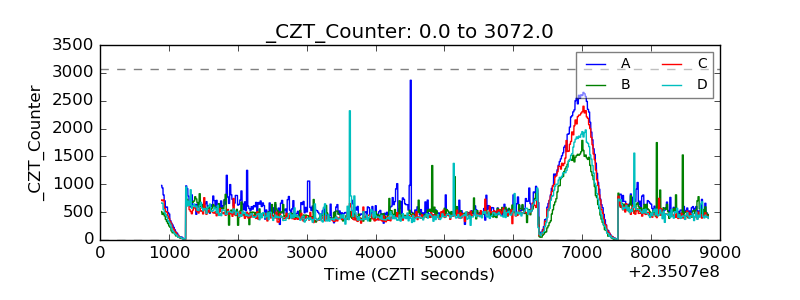 |
| +2.5 Volts monitor |  |
| +5 Volts monitor |  |
| _ROLL_ROT | 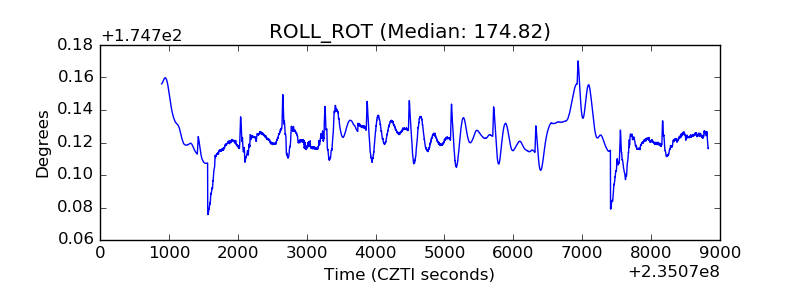 |
| _Roll_DEC | 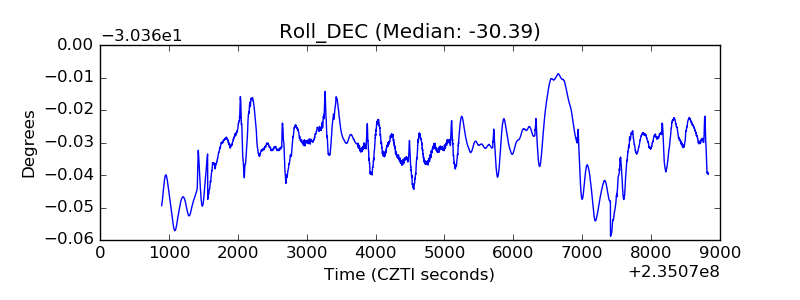 |
| _Roll_RA | 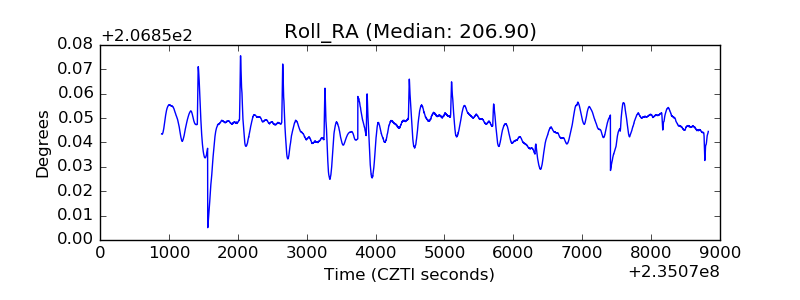 |
| Veto Counter | 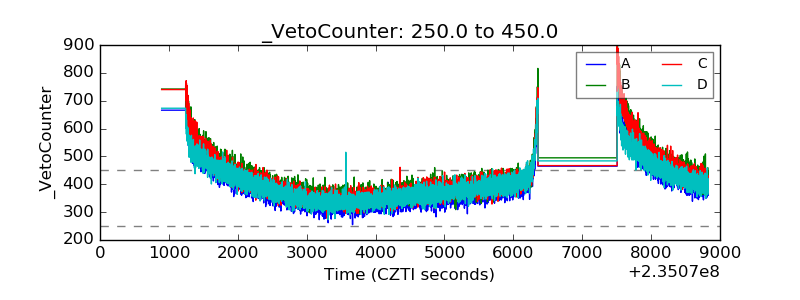 |