| Param | Original file | Final file |
|---|---|---|
| Filename | modeM0/AS1G07_003T01_9000001290_09248cztM0_level2.evt | modeM0/AS1G07_003T01_9000001290_09248cztM0_level2_quad_clean.evt |
| Size (bytes) | 74,309,760 | 17,645,760 |
| Size | 70.9 MB | 16.8 MB |
| Events in quadrant A | 751,838 | 117,876 |
| Events in quadrant B | 492,905 | 122,722 |
| Events in quadrant C | 400,726 | 119,915 |
| Events in quadrant D | 549,437 | 111,717 |
| Mode M0 | |||
|---|---|---|---|
| Quadrant | BADHDUFLAG | Total packets | Discarded packets |
| A | 0 | 2916 | 140 |
| B | 0 | 2044 | 67 |
| C | 0 | 1685 | 27 |
| D | 0 | 2170 | 45 |
| Mode M9 | |||
|---|---|---|---|
| Quadrant | BADHDUFLAG | Total packets | Discarded packets |
| A | 0 | 8 | 0 |
| B | 0 | 8 | 0 |
| C | 0 | 8 | 0 |
| D | 0 | 9 | 0 |
| Mode SS | |||
|---|---|---|---|
| Quadrant | BADHDUFLAG | Total packets | Discarded packets |
| A | 0 | 16 | 0 |
| B | 0 | 16 | 0 |
| C | 0 | 16 | 0 |
| D | 0 | 16 | 0 |
| Quadrant | Total seconds | Saturated seconds | Saturation percentage |
|---|---|---|---|
| A | 760 | 16 | 2.105263% |
| B | 769 | 11 | 1.430429% |
| C | 783 | 3 | 0.383142% |
| D | 779 | 40 | 5.134788% |
Noise dominated data is calculated using 1-second bins in cleaned event files. If a bin has >2000 counts, and if more than 50% of those come from <1% of pixels, then it is considered to be noise-dominated and hence unusable.
| Quadrant | # 1 sec bins | Bins with >0 counts | Bins with >2000 counts | High rate bins dominated by noise | Noise dominated (total time) | Noise dominated (detector-on time) | Marked lightcurve |
|---|---|---|---|---|---|---|---|
| A | 795 | 793 | 2 | 2 | 0.25% | 0.25% | 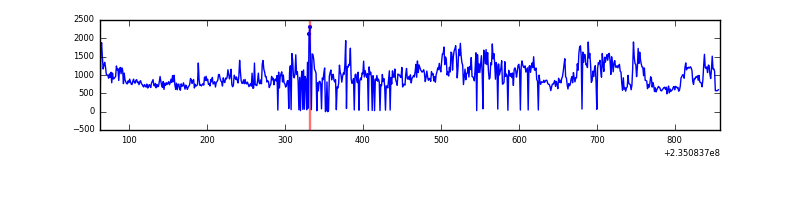 |
| B | 795 | 792 | 2 | 2 | 0.25% | 0.25% | 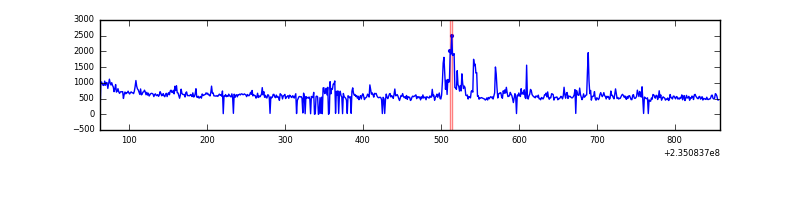 |
| C | 795 | 795 | 0 | 0 | 0.00% | 0.00% | 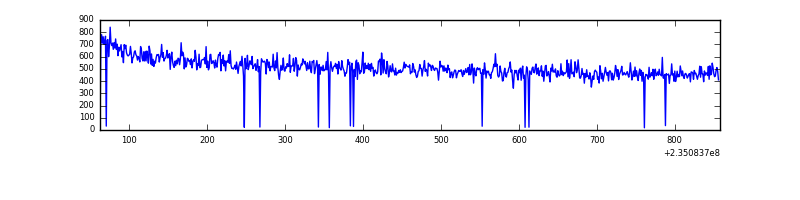 |
| D | 795 | 794 | 27 | 27 | 3.40% | 3.40% | 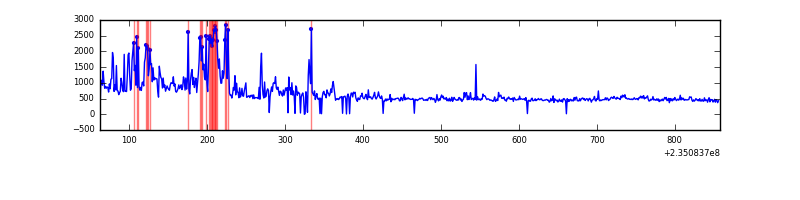 |
Top three noisy pixels from each quadrant. If the there are fewer than three noisy pixels in the level2.evt file, extra rows are filled as -1
| Pixel properties | Quadrant properties | ||||||
|---|---|---|---|---|---|---|---|
| Quadrant | DetID | PixID | Counts | Sigma | Mean | Median | Sigma |
| A | 8 | 5 | 307829 | 13128.73 | 105 | 103 | 23.4 |
| A | 13 | 251 | 21839 | 927.34 | 105 | 103 | 23.4 |
| A | 5 | 16 | 11717 | 495.5 | 105 | 103 | 23.4 |
| B | 4 | 48 | 37829 | 1671.34 | 107 | 105 | 22.6 |
| B | 4 | 173 | 16840 | 741.44 | 107 | 105 | 22.6 |
| B | 0 | 219 | 16155 | 711.09 | 107 | 105 | 22.6 |
| C | 13 | 61 | 767 | 26.13 | 102 | 103 | 25.4 |
| C | 7 | 159 | 575 | 18.57 | 102 | 103 | 25.4 |
| C | 8 | 222 | 430 | 12.87 | 102 | 103 | 25.4 |
| D | 12 | 233 | 138518 | 5297.24 | 100 | 96 | 26.1 |
| D | 7 | 71 | 23391 | 891.47 | 100 | 96 | 26.1 |
| D | 2 | 152 | 3100 | 114.96 | 100 | 96 | 26.1 |
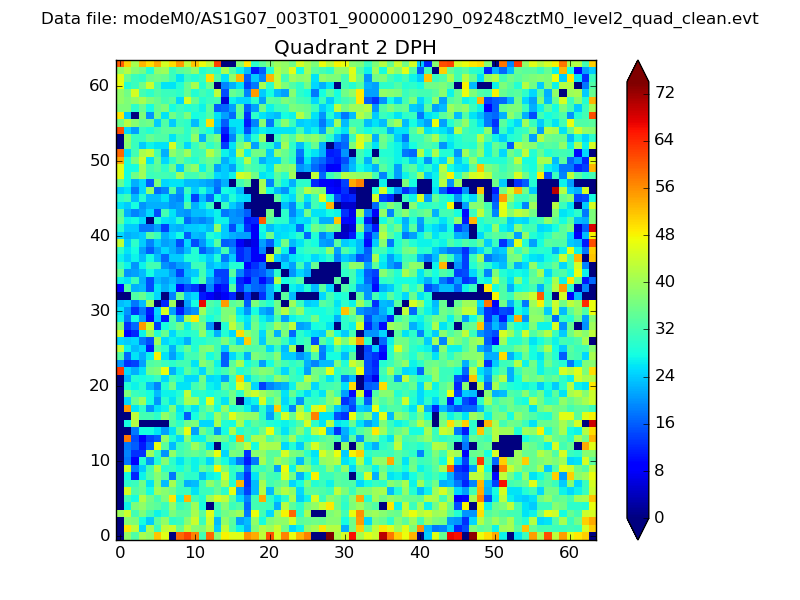
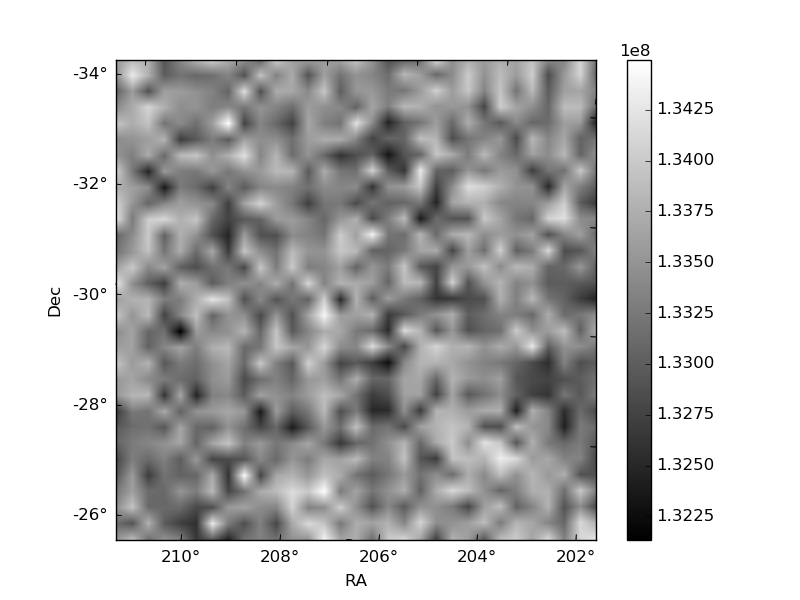
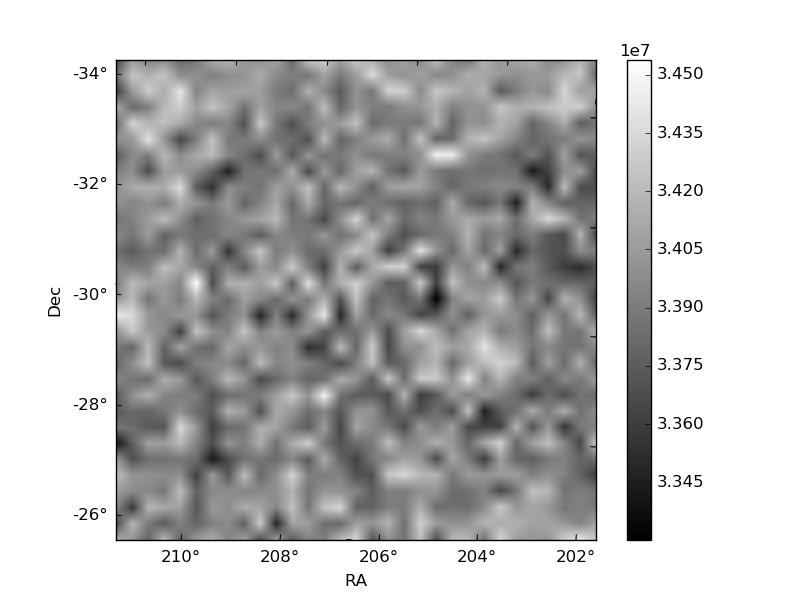
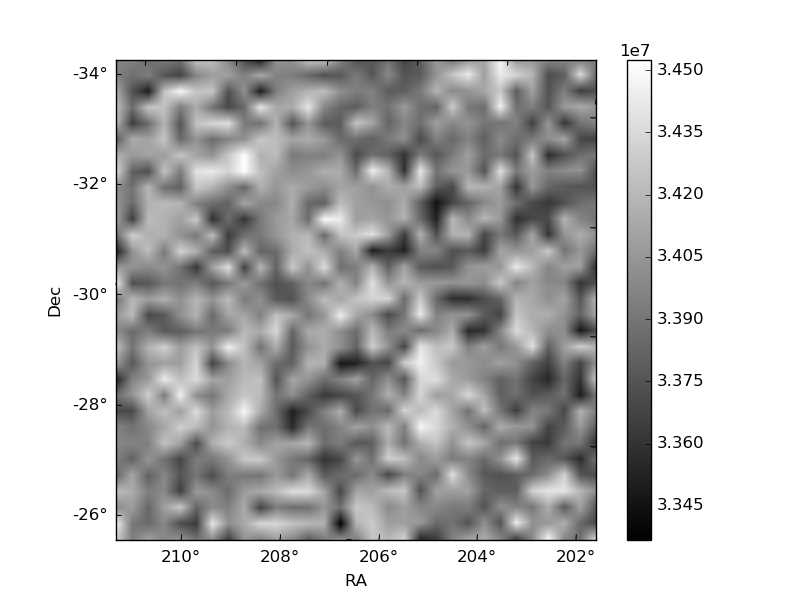
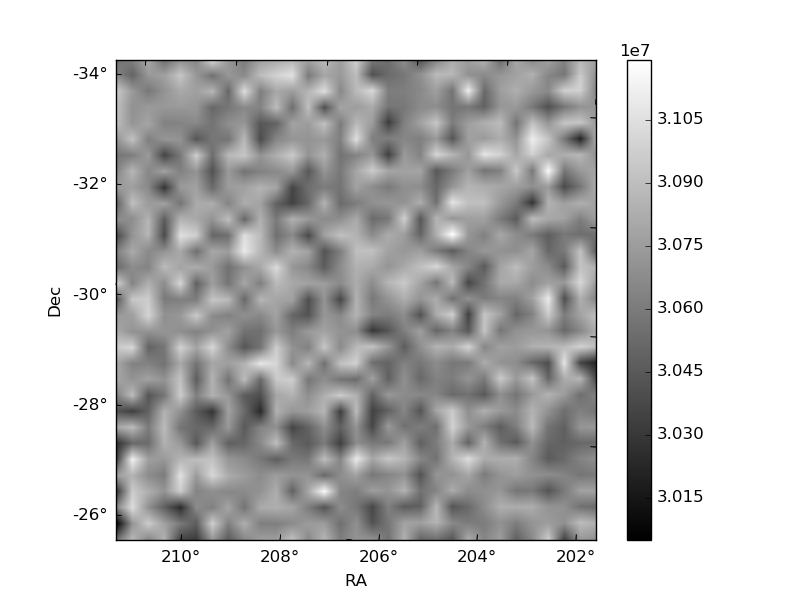
Histogram calculated using DETX and DETY for each event in the final _common_clean file
| Quadrant A | 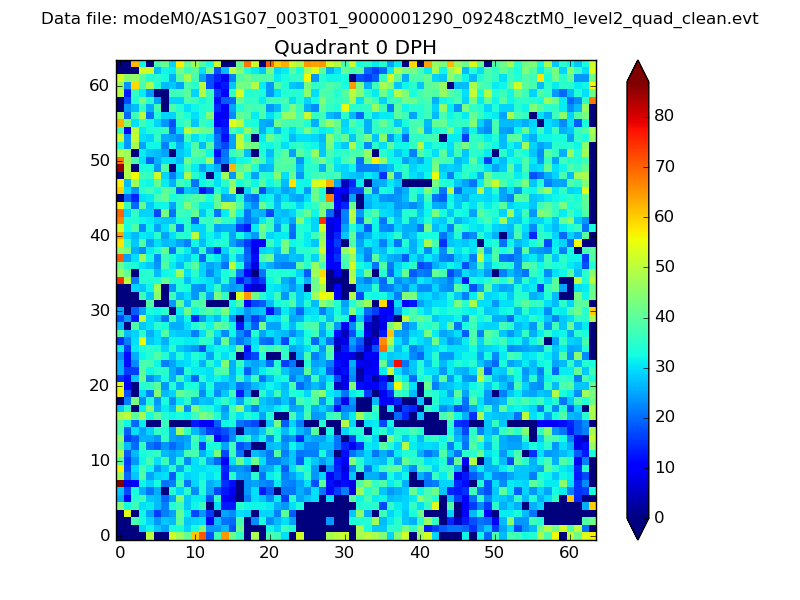 |
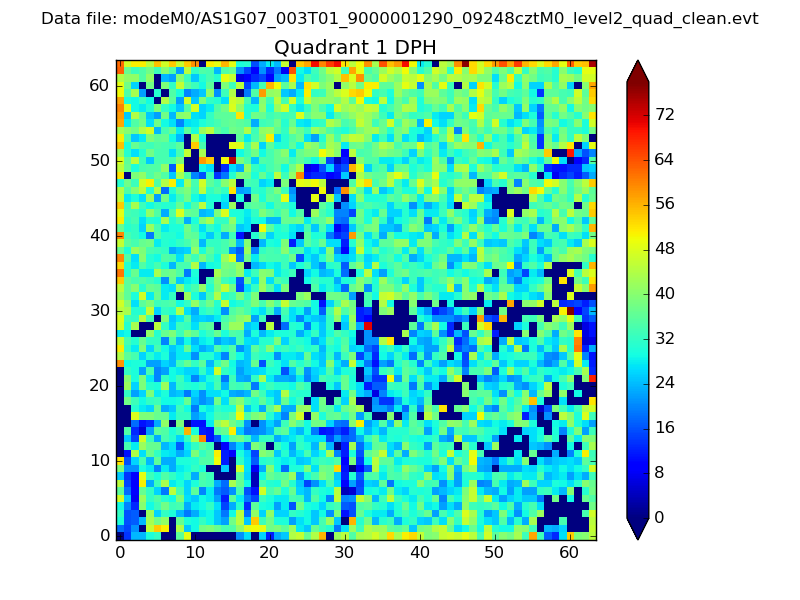 |
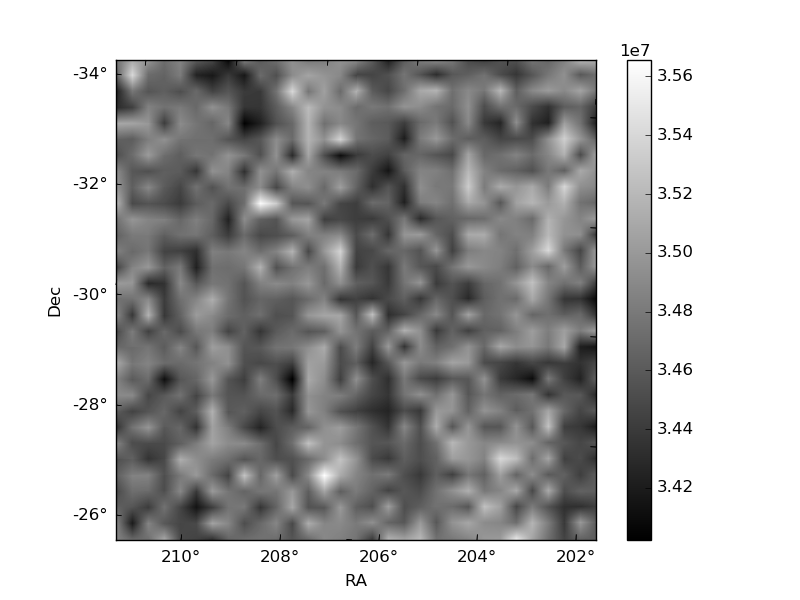
Quadrant B |
|---|---|---|---|
| Quadrant D | 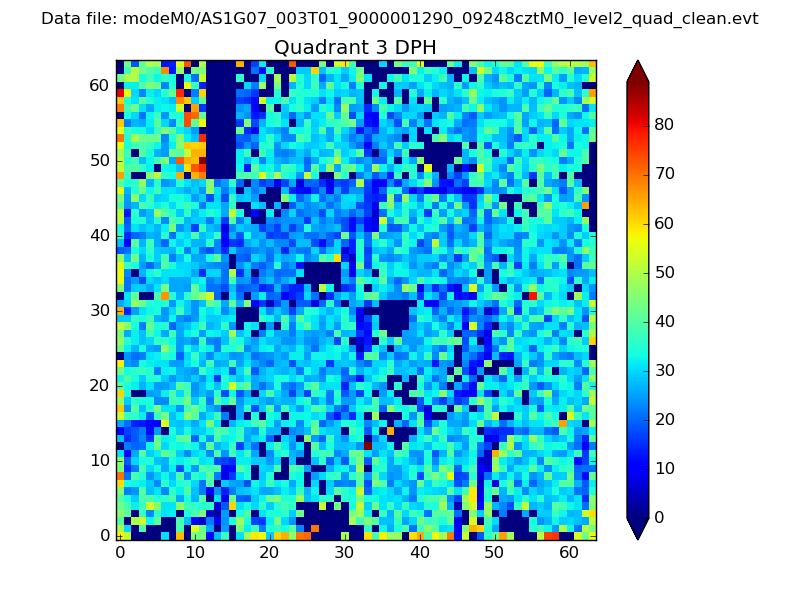 |
 |
Quadrant C |
| Plot type | Count rate plots | Images |
|---|---|---|
| Comparison with Poisson distribution Blue bars denote a histogram of data divided into 1 sec bins. Red curve is a Poisson curve with rate = median count rate of data. |
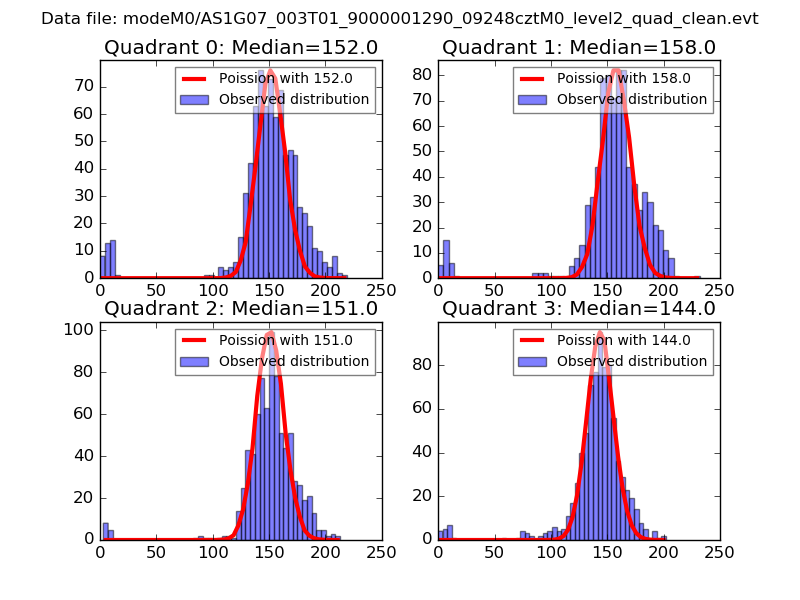 |
 |
| Quadrant-wise count rates Data is divided into 100 sec bins |
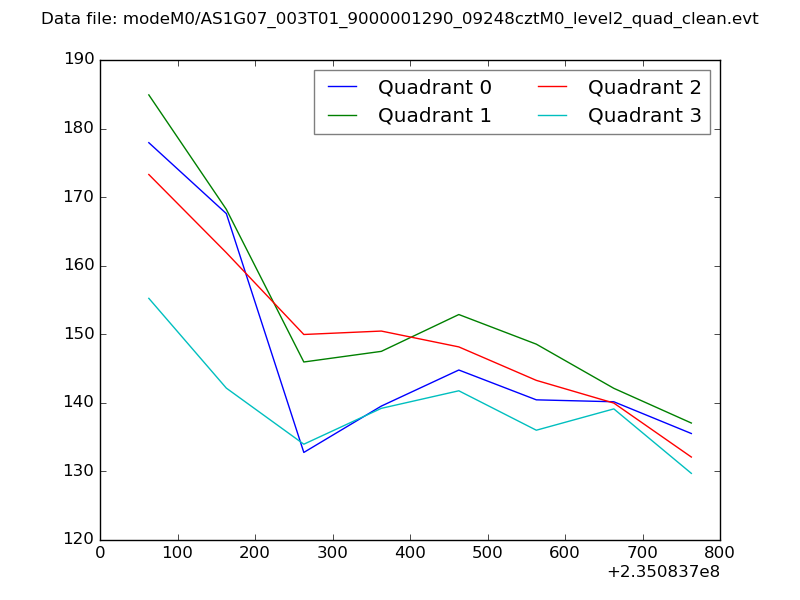 |
|
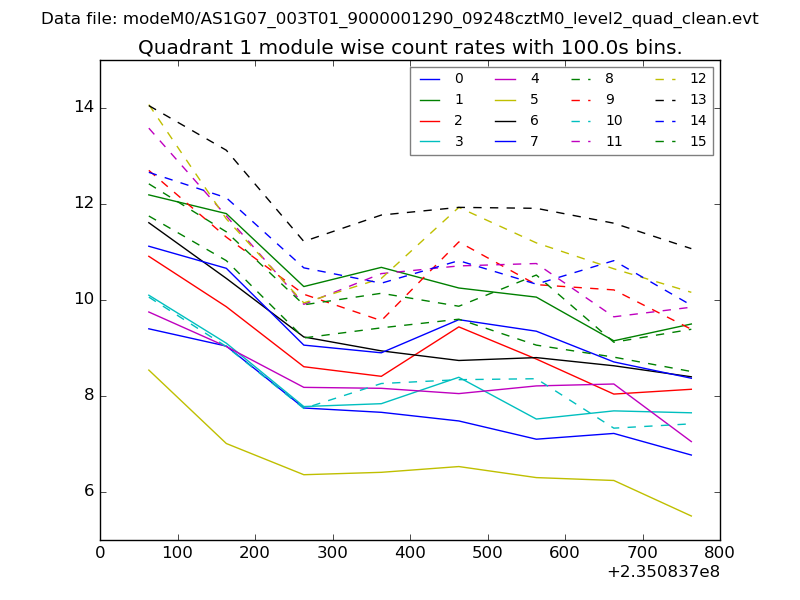
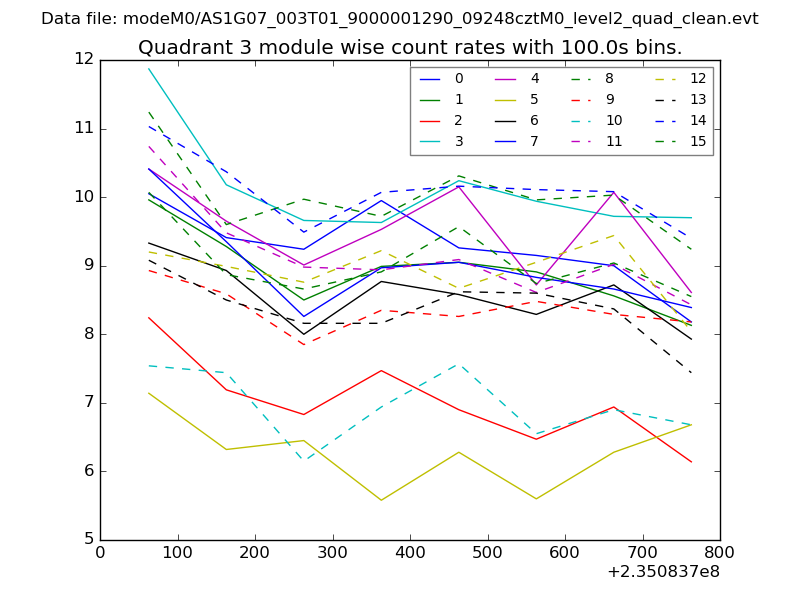
| Module-wise count rates for Quadrant A Data is divided into 100 sec bins |
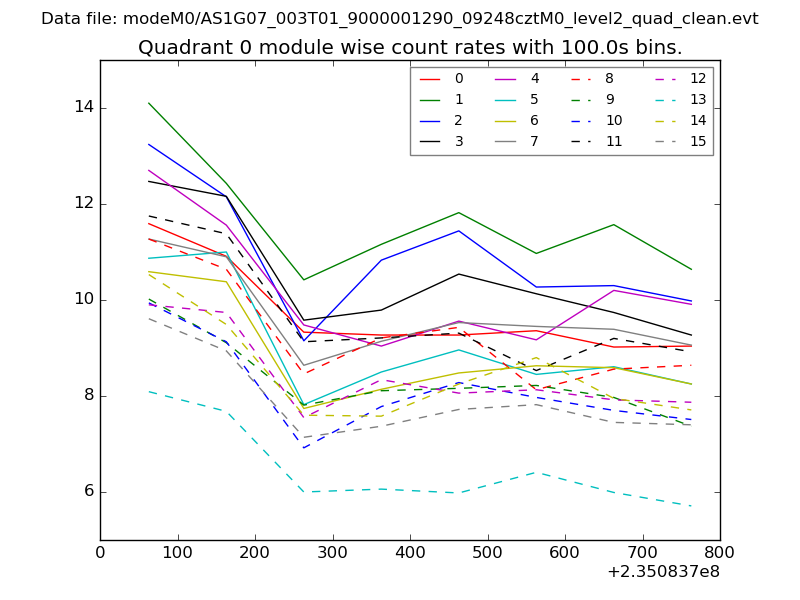 |
 |
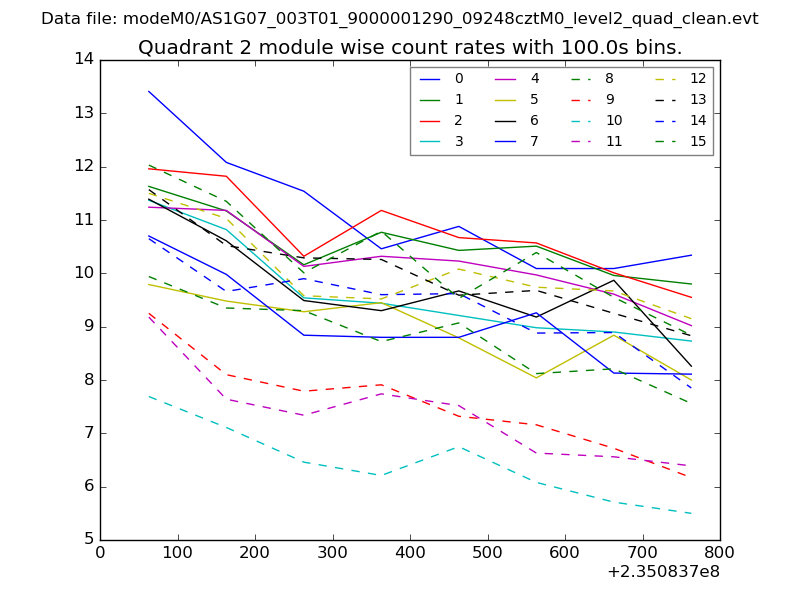
| Module-wise count rates for Quadrant B Data is divided into 100 sec bins |
 |
 |
| Module-wise count rates for Quadrant C Data is divided into 100 sec bins |
 |
 |
| Module-wise count rates for Quadrant D Data is divided into 100 sec bins |
 |
 |
| Parameter | Plot |
|---|---|
| CZT HV Monitor | 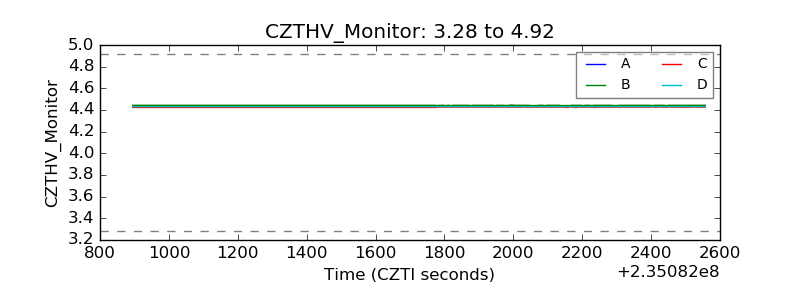 |
| D_VDD | 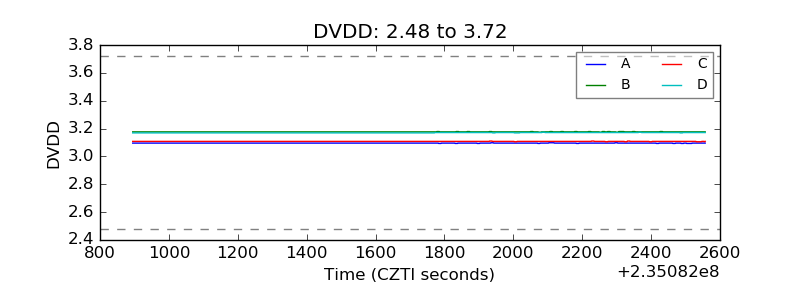 |
| Temperature 1 | 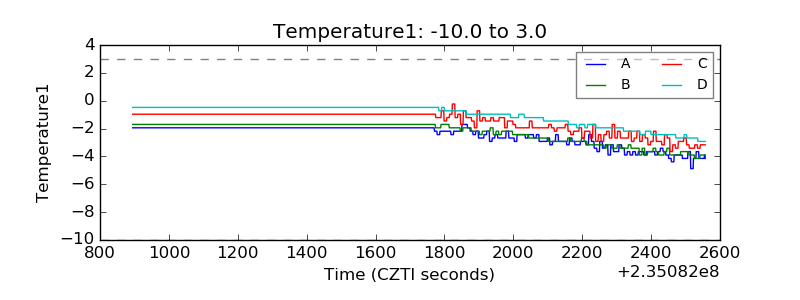 |
| Veto HV Monitor | 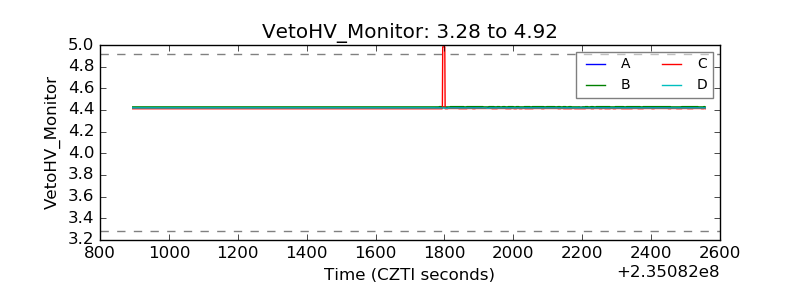 |
| Veto LLD | 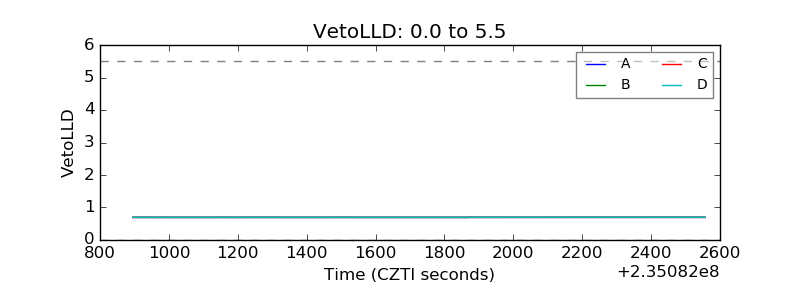 |
| Alpha Counter | 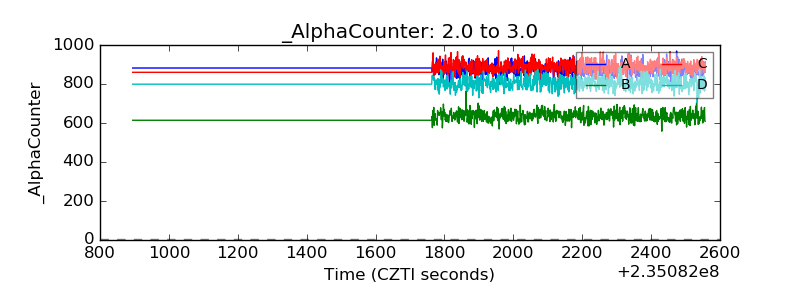 |
| _CPM_Rate | 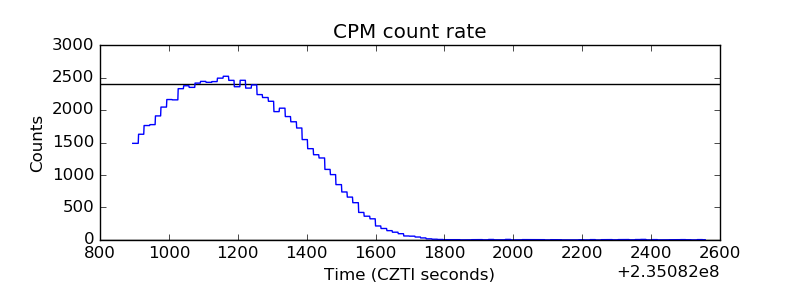 |
| CZT Counter | 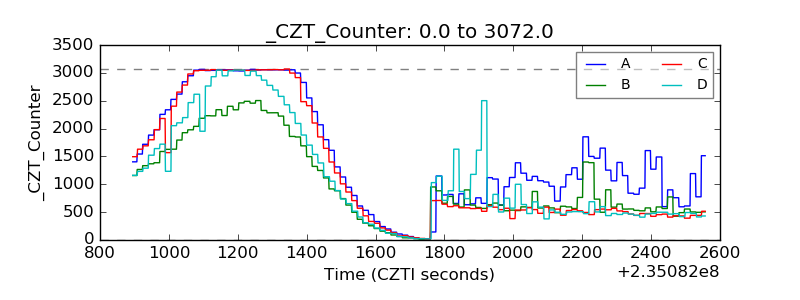 |
| +2.5 Volts monitor | 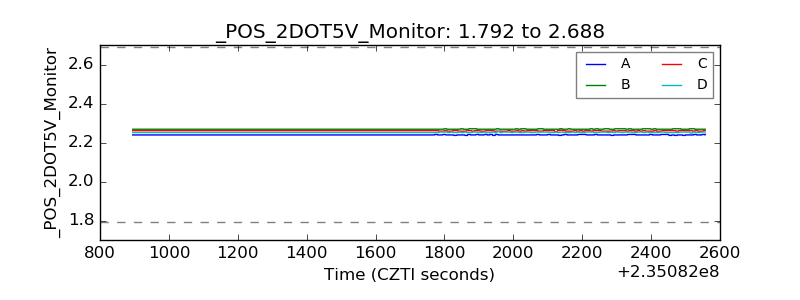 |
| +5 Volts monitor | 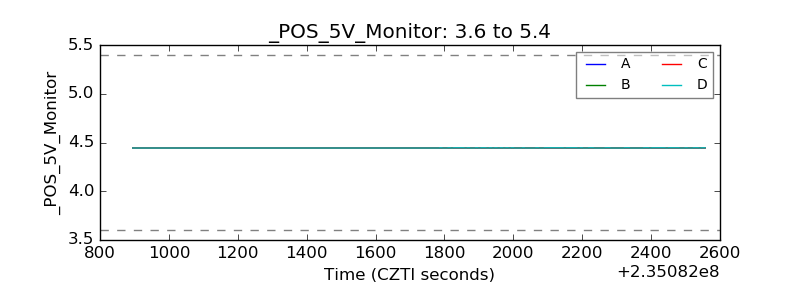 |
| _ROLL_ROT | 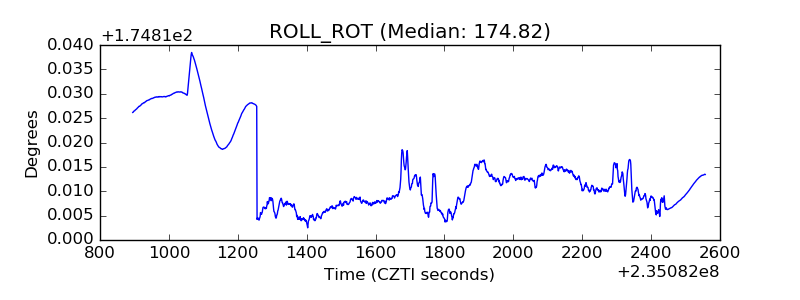 |
| _Roll_DEC | 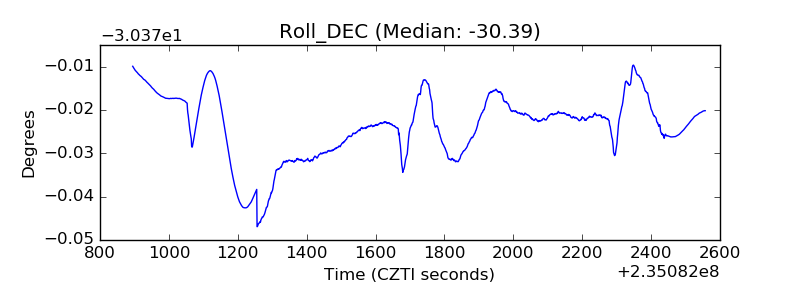 |
| _Roll_RA | 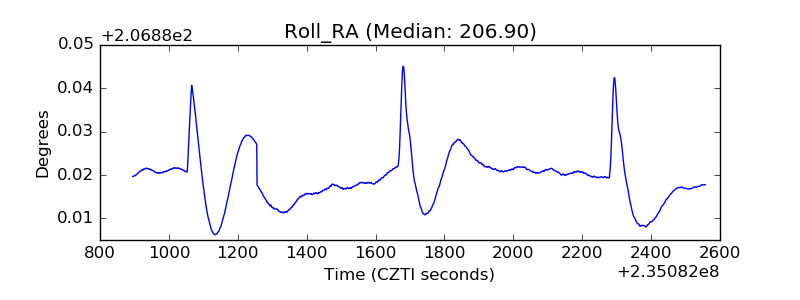 |
| Veto Counter | 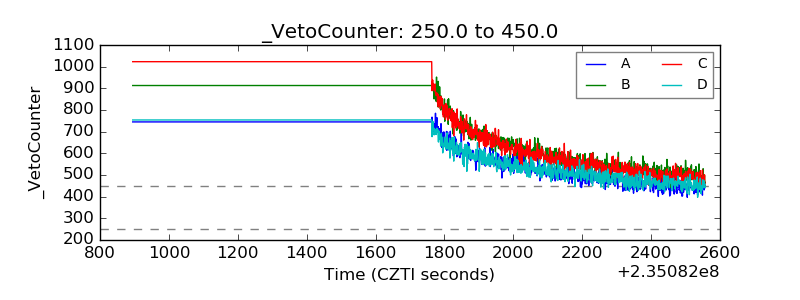 |