| Param | Original file | Final file |
|---|---|---|
| Filename | modeM0/AS1G07_003T01_9000001290_09249cztM0_level2.evt | modeM0/AS1G07_003T01_9000001290_09249cztM0_level2_quad_clean.evt |
| Size (bytes) | 412,971,840 | 77,253,120 |
| Size | 393.8 MB | 73.7 MB |
| Events in quadrant A | 3,413,063 | 492,106 |
| Events in quadrant B | 2,997,901 | 499,406 |
| Events in quadrant C | 2,709,562 | 481,653 |
| Events in quadrant D | 2,995,555 | 464,459 |
| Mode M0 | |||
|---|---|---|---|
| Quadrant | BADHDUFLAG | Total packets | Discarded packets |
| A | 0 | 13944 | 2 |
| B | 0 | 12614 | 2 |
| C | 0 | 11902 | 2 |
| D | 0 | 12872 | 2 |
| Mode M9 | |||
|---|---|---|---|
| Quadrant | BADHDUFLAG | Total packets | Discarded packets |
| A | 0 | 12 | 0 |
| B | 0 | 12 | 0 |
| C | 0 | 12 | 0 |
| D | 0 | 12 | 0 |
| Mode SS | |||
|---|---|---|---|
| Quadrant | BADHDUFLAG | Total packets | Discarded packets |
| A | 0 | 118 | 0 |
| B | 0 | 118 | 0 |
| C | 0 | 118 | 0 |
| D | 0 | 118 | 0 |
| Quadrant | Total seconds | Saturated seconds | Saturation percentage |
|---|---|---|---|
| A | 5743 | 56 | 0.975100% |
| B | 5743 | 41 | 0.713913% |
| C | 5743 | 27 | 0.470138% |
| D | 5743 | 61 | 1.062163% |
Noise dominated data is calculated using 1-second bins in cleaned event files. If a bin has >2000 counts, and if more than 50% of those come from <1% of pixels, then it is considered to be noise-dominated and hence unusable.
| Quadrant | # 1 sec bins | Bins with >0 counts | Bins with >2000 counts | High rate bins dominated by noise | Noise dominated (total time) | Noise dominated (detector-on time) | Marked lightcurve |
|---|---|---|---|---|---|---|---|
| A | 6983 | 5744 | 14 | 14 | 0.20% | 0.24% |  |
| B | 6983 | 5744 | 8 | 8 | 0.11% | 0.14% | 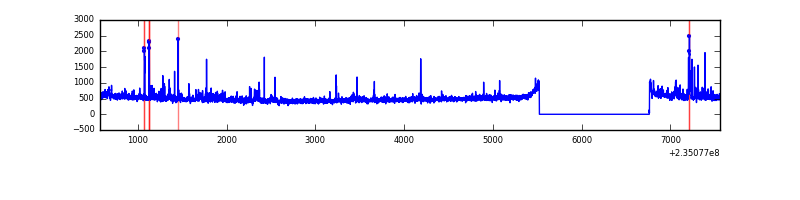 |
| C | 6983 | 5744 | 9 | 9 | 0.13% | 0.16% | 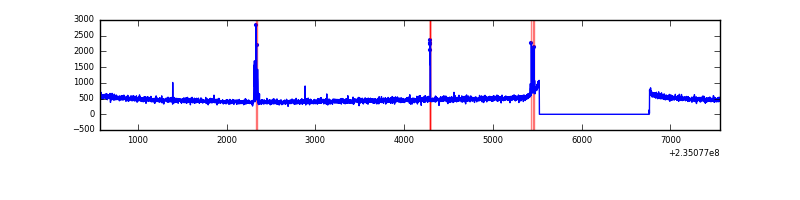 |
| D | 6983 | 5744 | 40 | 40 | 0.57% | 0.70% | 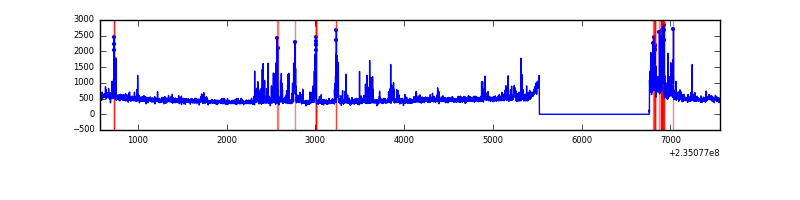 |
Top three noisy pixels from each quadrant. If the there are fewer than three noisy pixels in the level2.evt file, extra rows are filled as -1
| Pixel properties | Quadrant properties | ||||||
|---|---|---|---|---|---|---|---|
| Quadrant | DetID | PixID | Counts | Sigma | Mean | Median | Sigma |
| A | 8 | 5 | 606842 | 4189.27 | 708 | 695 | 144.7 |
| A | 13 | 251 | 46915 | 319.44 | 708 | 695 | 144.7 |
| A | 5 | 16 | 15548 | 102.65 | 708 | 695 | 144.7 |
| B | 4 | 173 | 90894 | 663.53 | 712 | 698 | 135.9 |
| B | 4 | 48 | 59163 | 430.1 | 712 | 698 | 135.9 |
| B | 0 | 219 | 30904 | 222.21 | 712 | 698 | 135.9 |
| C | 14 | 234 | 56169 | 351.69 | 679 | 684 | 157.8 |
| C | 13 | 61 | 5125 | 28.15 | 679 | 684 | 157.8 |
| C | 8 | 222 | 4496 | 24.16 | 679 | 684 | 157.8 |
| D | 12 | 233 | 205889 | 1159.95 | 670 | 653 | 176.9 |
| D | 1 | 52 | 126281 | 710.02 | 670 | 653 | 176.9 |
| D | 7 | 71 | 84442 | 473.56 | 670 | 653 | 176.9 |
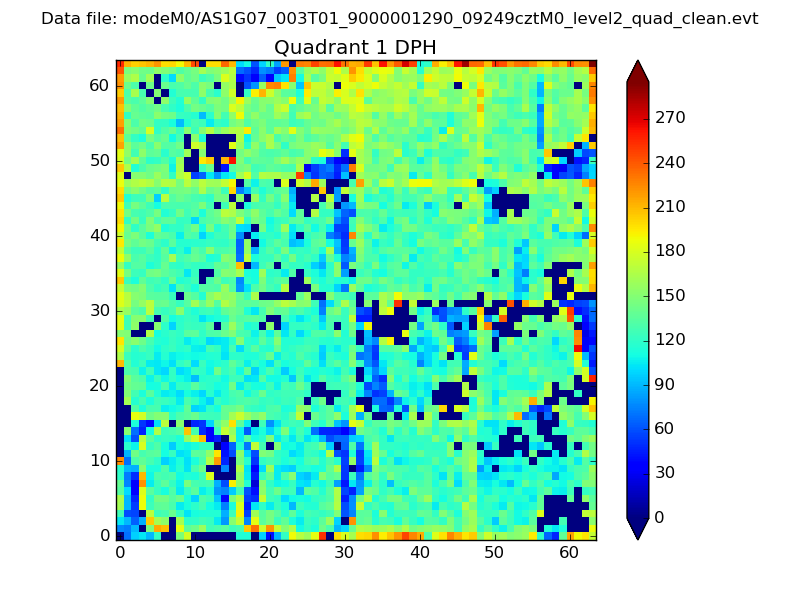
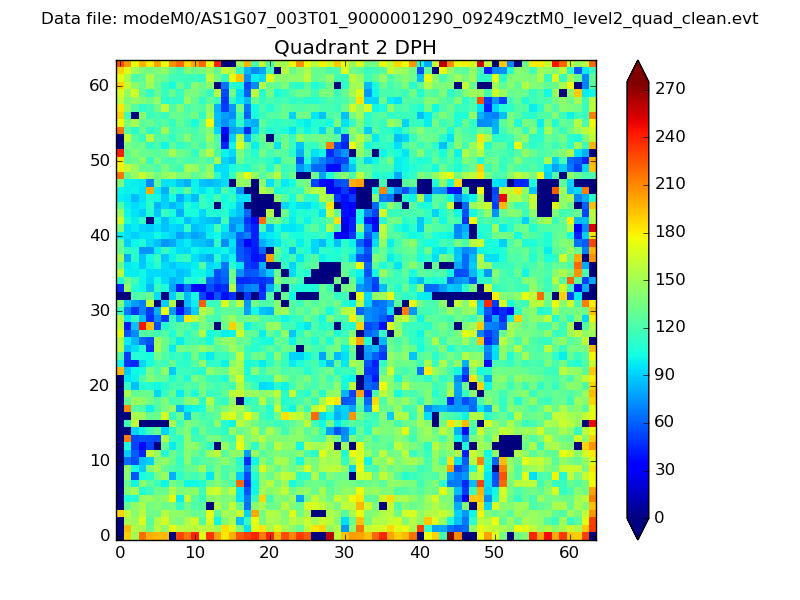
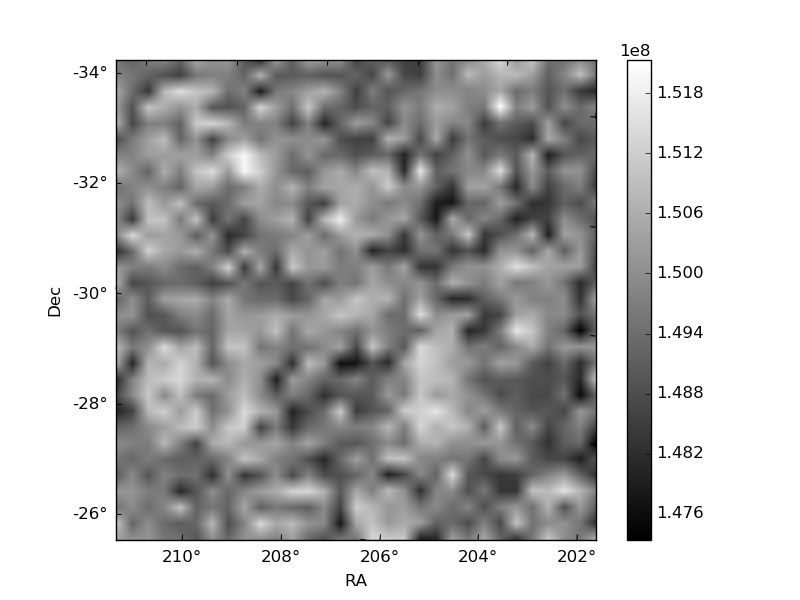
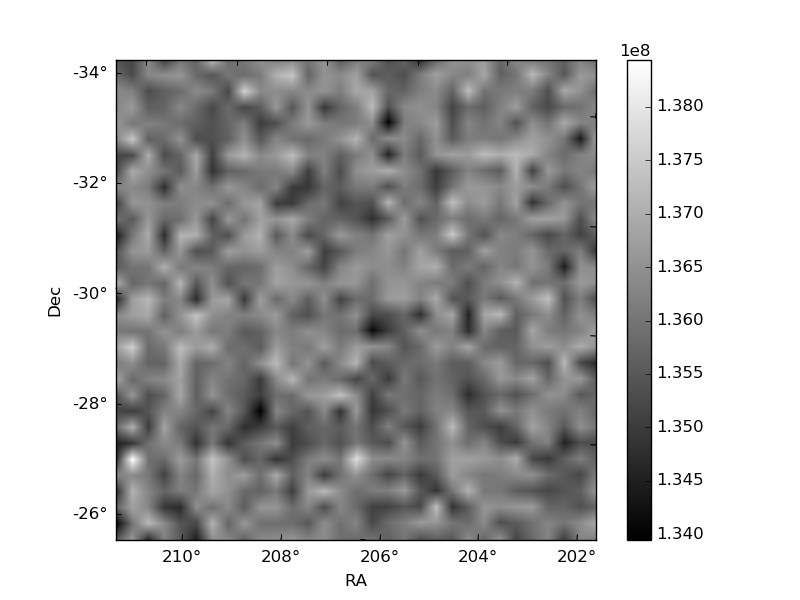
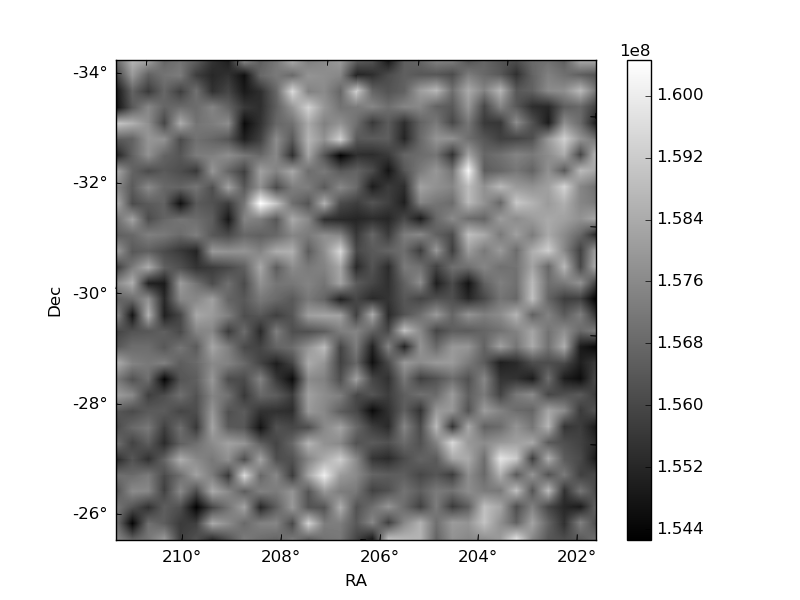
Histogram calculated using DETX and DETY for each event in the final _common_clean file
| Quadrant A | 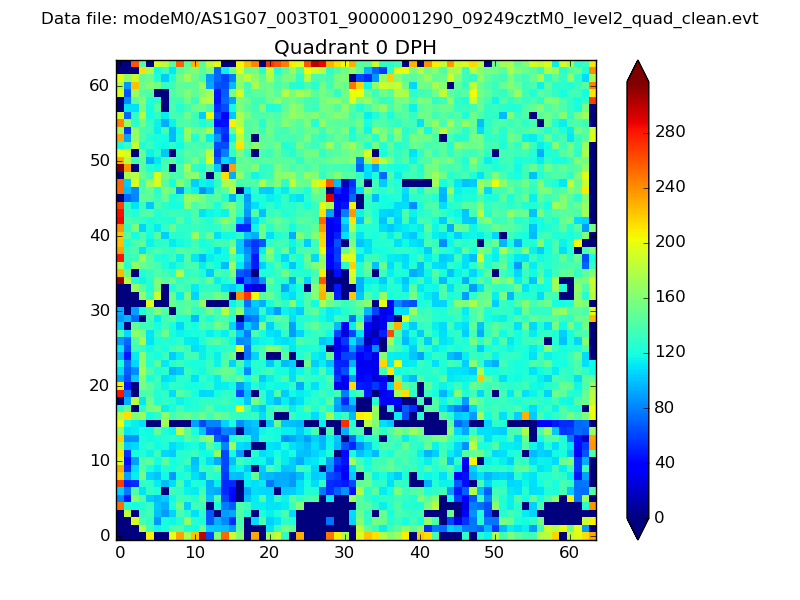 |
 |
Quadrant B |
|---|---|---|---|
| Quadrant D | 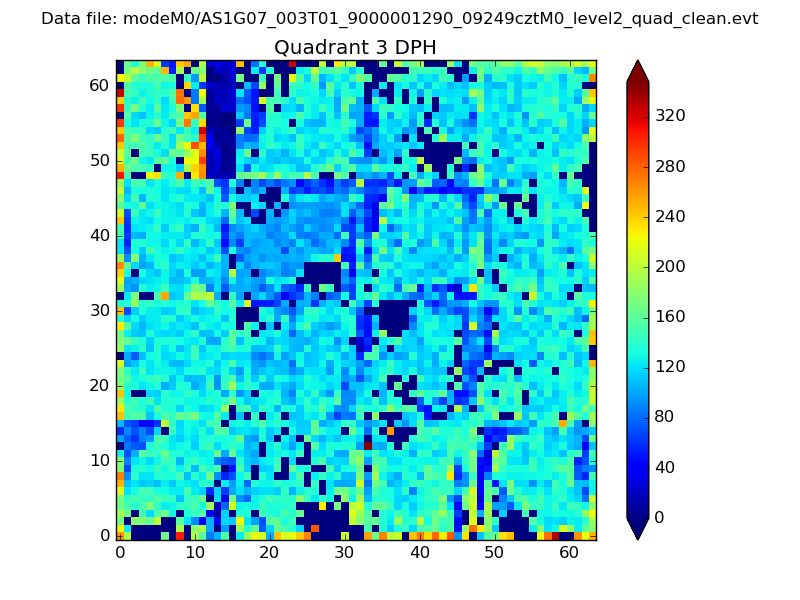 |
 |
Quadrant C |
| Plot type | Count rate plots | Images |
|---|---|---|
| Comparison with Poisson distribution Blue bars denote a histogram of data divided into 1 sec bins. Red curve is a Poisson curve with rate = median count rate of data. |
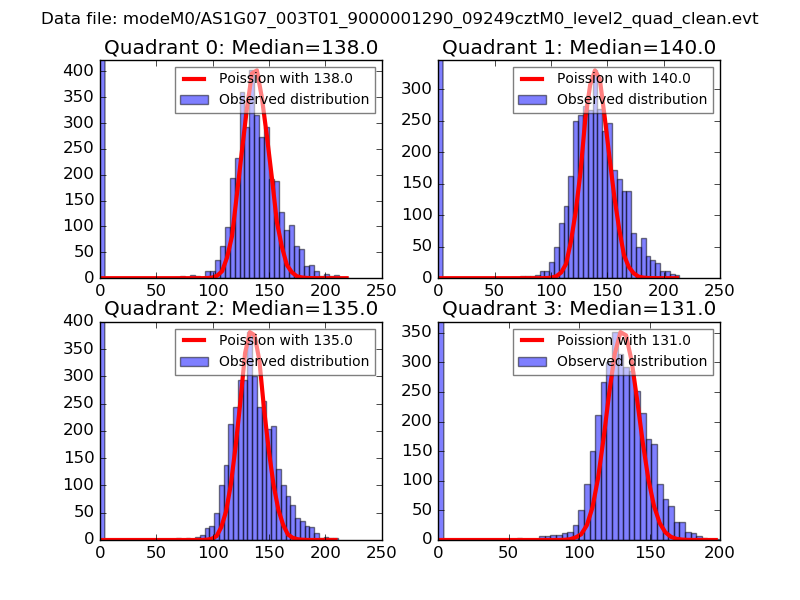 |
 |
| Quadrant-wise count rates Data is divided into 100 sec bins |
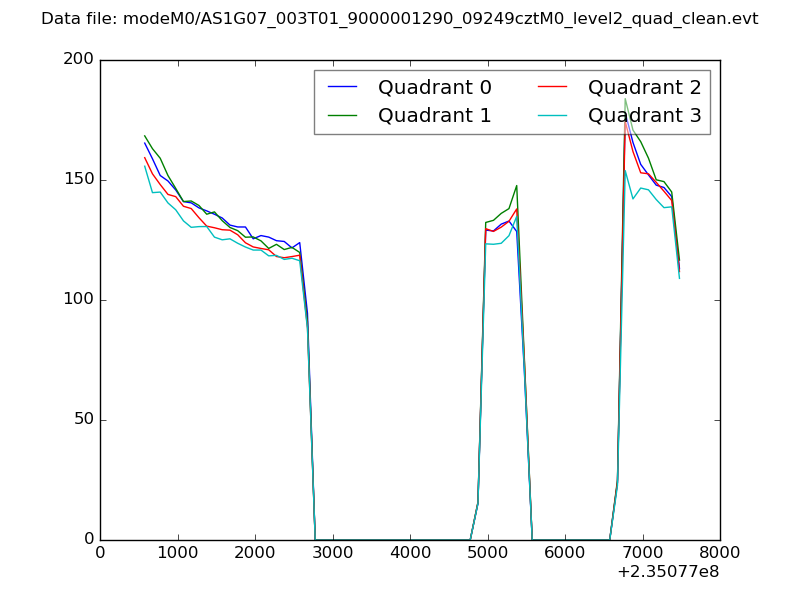 |
|
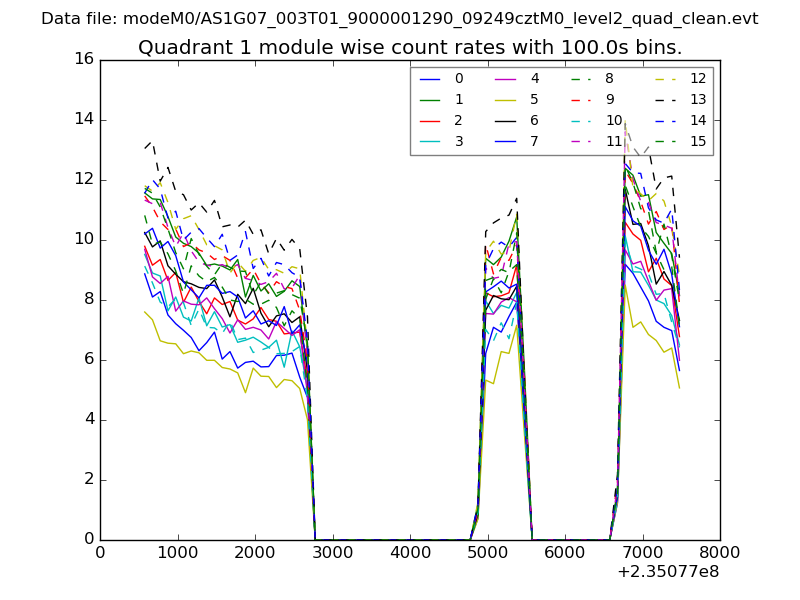
| Module-wise count rates for Quadrant A Data is divided into 100 sec bins |
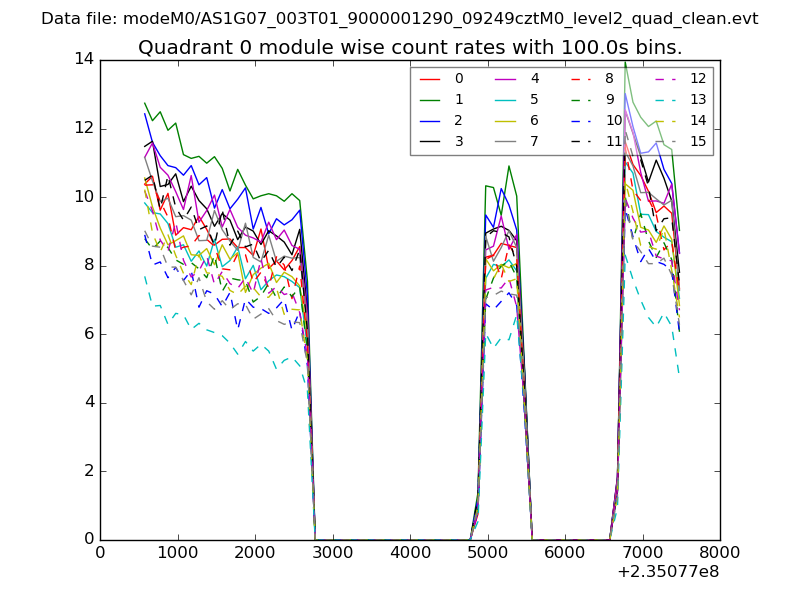 |
 |
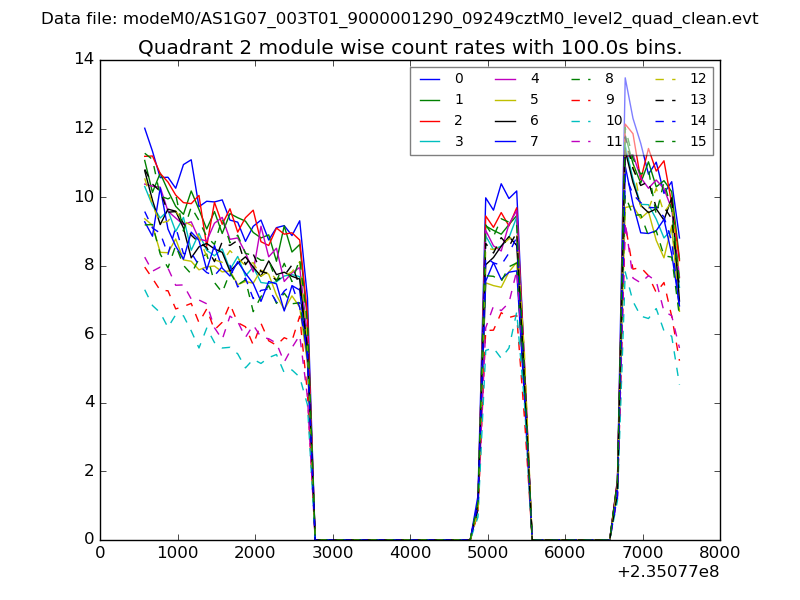
| Module-wise count rates for Quadrant B Data is divided into 100 sec bins |
 |
 |
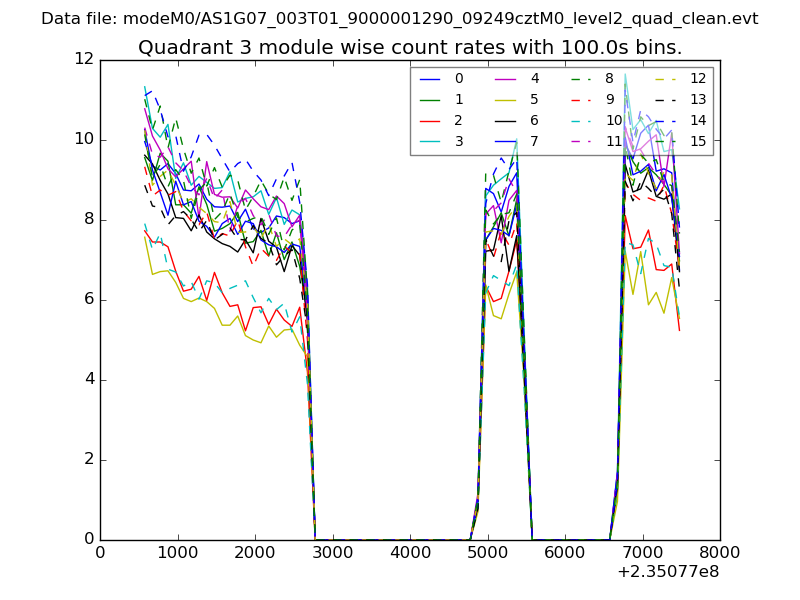
| Module-wise count rates for Quadrant C Data is divided into 100 sec bins |
 |
 |
| Module-wise count rates for Quadrant D Data is divided into 100 sec bins |
 |
 |
| Parameter | Plot |
|---|---|
| CZT HV Monitor | 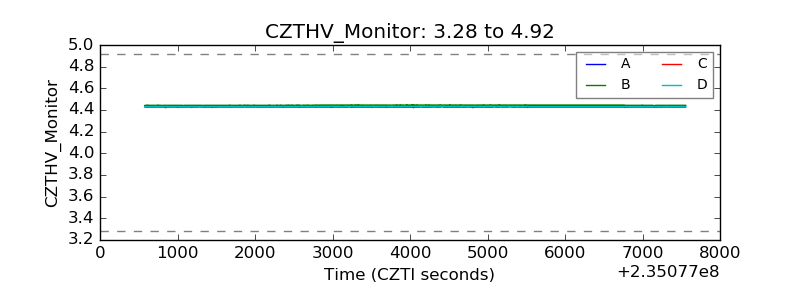 |
| D_VDD | 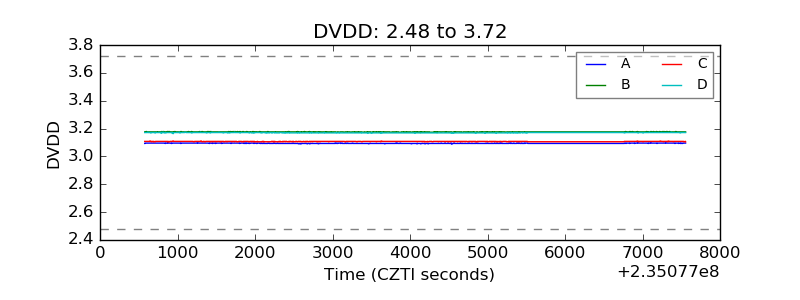 |
| Temperature 1 | 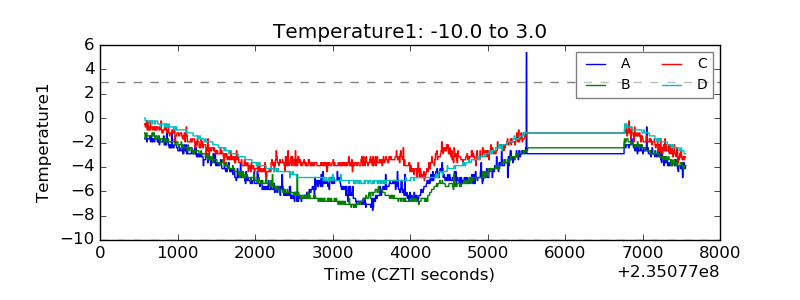 |
| Veto HV Monitor |  |
| Veto LLD | 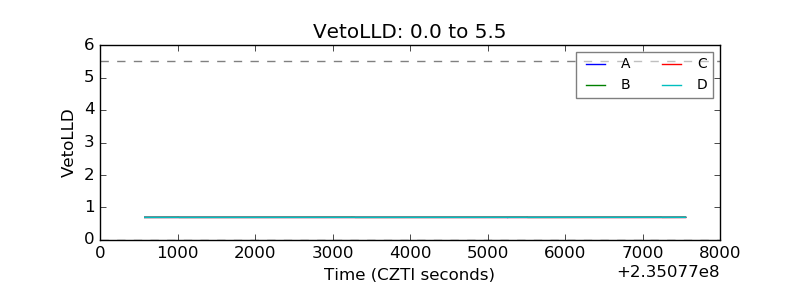 |
| Alpha Counter | 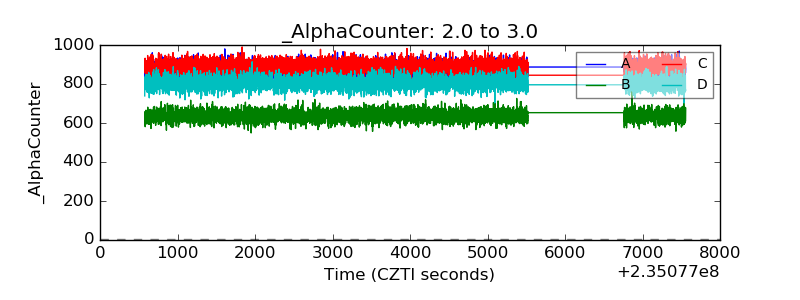 |
| _CPM_Rate | 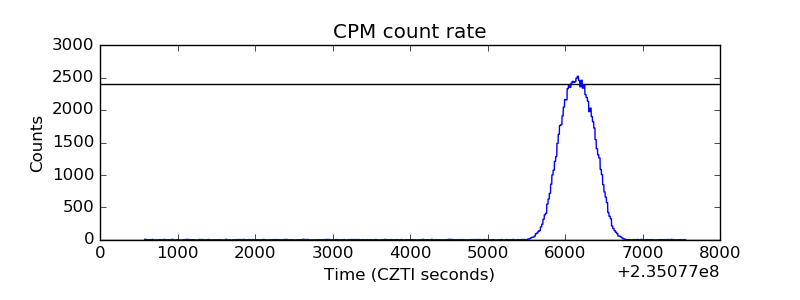 |
| CZT Counter | 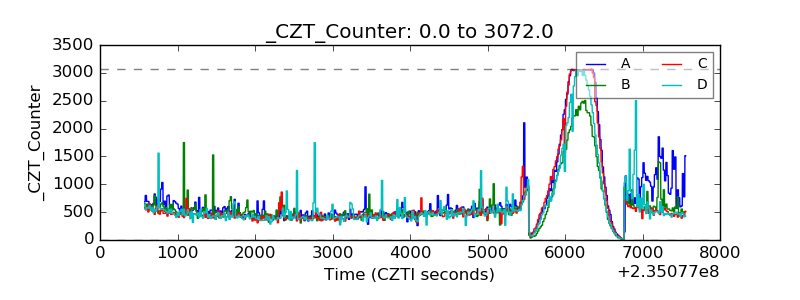 |
| +2.5 Volts monitor |  |
| +5 Volts monitor |  |
| _ROLL_ROT | 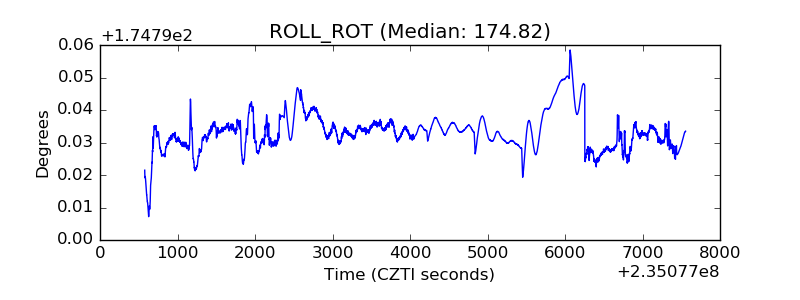 |
| _Roll_DEC | 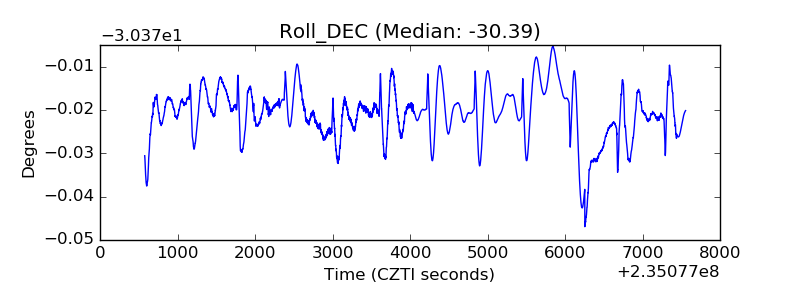 |
| _Roll_RA | 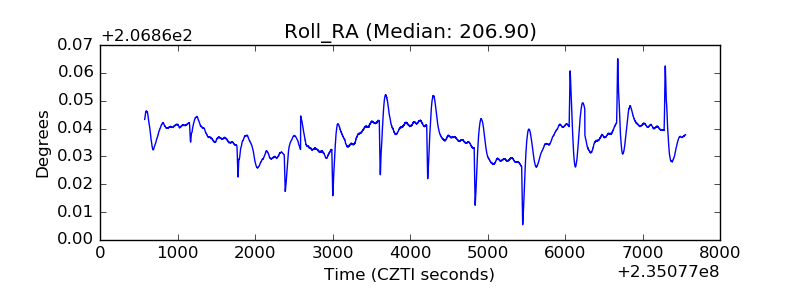 |
| Veto Counter | 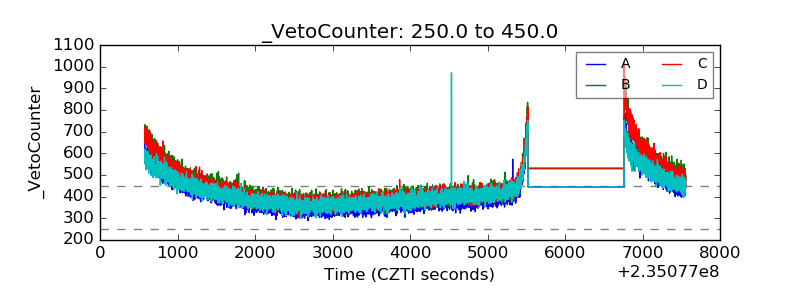 |