| Param | Original file | Final file |
|---|---|---|
| Filename | modeM0/AS1A03_062T04_9000001298cztM0_level2.fits | modeM0/AS1A03_062T04_9000001298cztM0_level2_quad_clean.evt |
| Size (bytes) | 176,212,800 | 136,584,000 |
| Size | 168.0 MB | 130.3 MB |
| Events in quadrant A | 1,040,462 | 729,489 |
| Events in quadrant B | 1,030,930 | 738,470 |
| Events in quadrant C | 1,051,508 | 704,216 |
| Events in quadrant D | 909,448 | 658,760 |
| Mode M0 | |||
|---|---|---|---|
| Quadrant | BADHDUFLAG | Total packets | Discarded packets |
| A | 0 | 51247 | 0 |
| B | 0 | 39875 | 0 |
| C | 0 | 39627 | 0 |
| D | 0 | 39930 | 0 |
| Mode SS | |||
|---|---|---|---|
| Quadrant | BADHDUFLAG | Total packets | Discarded packets |
| A | 0 | 384 | 0 |
| B | 0 | 388 | 0 |
| C | 0 | 383 | 0 |
| D | 0 | 384 | 0 |
| Mode M9 | |||
|---|---|---|---|
| Quadrant | BADHDUFLAG | Total packets | Discarded packets |
| A | 0 | 40 | 0 |
| B | 0 | 38 | 0 |
| C | 0 | 40 | 0 |
| D | 0 | 40 | 0 |
| Quadrant | Total seconds | Saturated seconds | Saturation percentage |
|---|---|---|---|
| A | 18876 | 352 | 1.864802% |
| B | 18949 | 188 | 0.992137% |
| C | 18966 | 112 | 0.590530% |
| D | 18948 | 182 | 0.960524% |
Noise dominated data is calculated using 1-second bins in cleaned event files. If a bin has >2000 counts, and if more than 50% of those come from <1% of pixels, then it is considered to be noise-dominated and hence unusable.
| Quadrant | # 1 sec bins | Bins with >0 counts | Bins with >2000 counts | High rate bins dominated by noise | Noise dominated (total time) | Noise dominated (detector-on time) | Marked lightcurve |
|---|---|---|---|---|---|---|---|
| A | 23126 | 19073 | 0 | 0 | 0.00% | 0.00% |  |
| B | 23126 | 19096 | 0 | 0 | 0.00% | 0.00% |  |
| C | 23125 | 19099 | 0 | 0 | 0.00% | 0.00% | 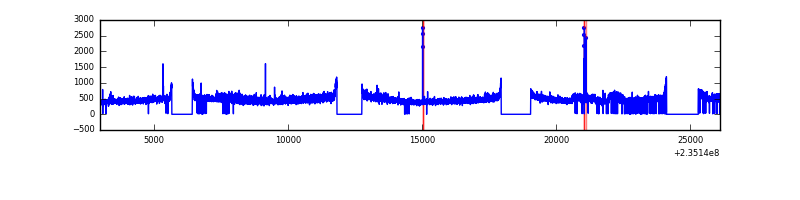 |
| D | 23125 | 19081 | 0 | 0 | 0.00% | 0.00% |  |
Top three noisy pixels from each quadrant. If the there are fewer than three noisy pixels in the level2.evt file, extra rows are filled as -1
| Pixel properties | Quadrant properties | ||||||
|---|---|---|---|---|---|---|---|
| Quadrant | DetID | PixID | Counts | Sigma | Mean | Median | Sigma |
| A | 0 | 29 | 1065 | 11.68 | 270 | 252 | 69.6 |
| A | 7 | 110 | 912 | 9.48 | 270 | 252 | 69.6 |
| A | 0 | 30 | 798 | 7.84 | 270 | 252 | 69.6 |
| B | 2 | 9 | 880 | 10.96 | 271 | 257 | 56.8 |
| B | 14 | 254 | 717 | 8.09 | 271 | 257 | 56.8 |
| B | 5 | 128 | 703 | 7.85 | 271 | 257 | 56.8 |
| C | 1 | 80 | 807 | 7.33 | 277 | 257 | 75.0 |
| C | 1 | 81 | 798 | 7.21 | 277 | 257 | 75.0 |
| C | 12 | 241 | 785 | 7.04 | 277 | 257 | 75.0 |
| D | 7 | 3 | 709 | 6.59 | 259 | 234 | 72.0 |
| D | 6 | 231 | 642 | 5.66 | 259 | 234 | 72.0 |
| D | 7 | 5 | 635 | 5.56 | 259 | 234 | 72.0 |
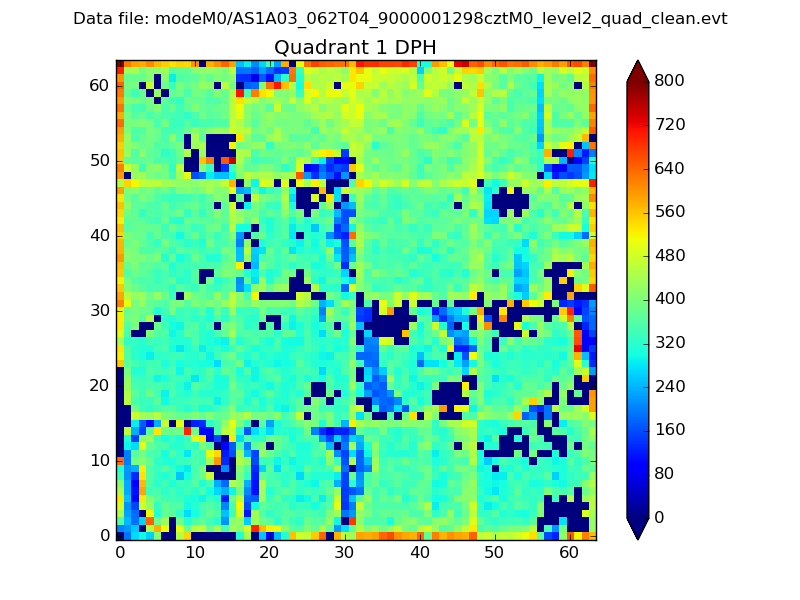
Histogram calculated using DETX and DETY for each event in the final _common_clean file
| Quadrant A |  |
 |
Quadrant B |
|---|---|---|---|
| Quadrant D |  |
 |
Quadrant C |
| Plot type | Count rate plots | Images |
|---|---|---|
| Comparison with Poisson distribution Blue bars denote a histogram of data divided into 1 sec bins. Red curve is a Poisson curve with rate = median count rate of data. |
 |
 |
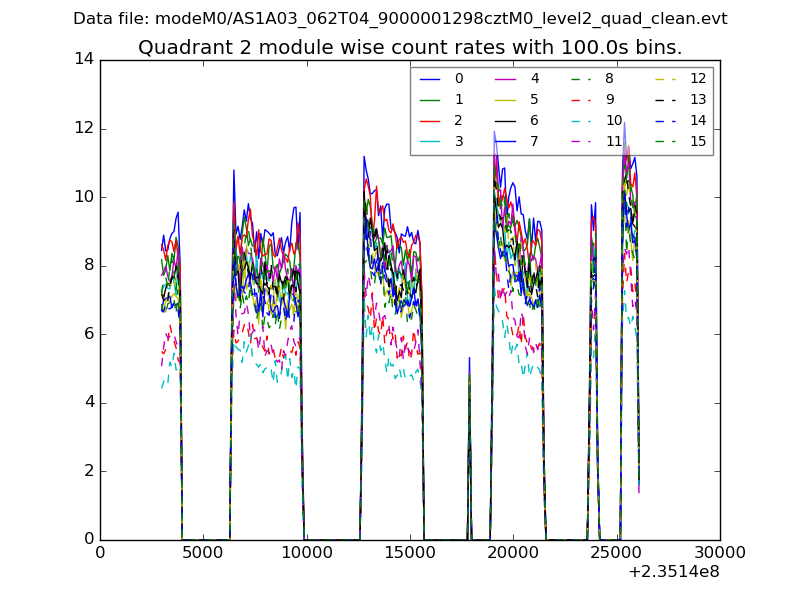
| Quadrant-wise count rates Data is divided into 100 sec bins |
 |
|
| Module-wise count rates for Quadrant A Data is divided into 100 sec bins |
 |
 |
| Module-wise count rates for Quadrant B Data is divided into 100 sec bins |
 |
 |
| Module-wise count rates for Quadrant C Data is divided into 100 sec bins |
 |
 |
| Module-wise count rates for Quadrant D Data is divided into 100 sec bins |
 |
 |
| Parameter | Plot |
|---|---|
| CZT HV Monitor |  |
| D_VDD |  |
| Temperature 1 |  |
| Veto HV Monitor |  |
| Veto LLD |  |
| Alpha Counter |  |
| _CPM_Rate |  |
| CZT Counter |  |
| +2.5 Volts monitor |  |
| +5 Volts monitor |  |
| _ROLL_ROT |  |
| _Roll_DEC |  |
| _Roll_RA |  |
| Veto Counter |  |