| Param | Original file | Final file |
|---|---|---|
| Filename | modeM0/AS1A03_062T04_9000001298_09257cztM0_level2.evt | modeM0/AS1A03_062T04_9000001298_09257cztM0_level2_quad_clean.evt |
| Size (bytes) | 305,288,640 | 50,693,760 |
| Size | 291.1 MB | 48.3 MB |
| Events in quadrant A | 2,846,514 | 307,052 |
| Events in quadrant B | 2,079,971 | 316,639 |
| Events in quadrant C | 1,987,922 | 309,276 |
| Events in quadrant D | 2,043,186 | 304,442 |
| Mode M0 | |||
|---|---|---|---|
| Quadrant | BADHDUFLAG | Total packets | Discarded packets |
| A | 0 | 11481 | 231 |
| B | 0 | 9069 | 105 |
| C | 0 | 8879 | 98 |
| D | 0 | 9095 | 81 |
| Mode SS | |||
|---|---|---|---|
| Quadrant | BADHDUFLAG | Total packets | Discarded packets |
| A | 0 | 88 | 4 |
| B | 0 | 88 | 2 |
| C | 0 | 88 | 2 |
| D | 0 | 88 | 4 |
| Mode M9 | |||
|---|---|---|---|
| Quadrant | BADHDUFLAG | Total packets | Discarded packets |
| A | 0 | 8 | 0 |
| B | 0 | 8 | 0 |
| C | 0 | 8 | 0 |
| D | 0 | 8 | 0 |
| Quadrant | Total seconds | Saturated seconds | Saturation percentage |
|---|---|---|---|
| A | 4208 | 98 | 2.328897% |
| B | 4229 | 50 | 1.182313% |
| C | 4229 | 26 | 0.614803% |
| D | 4237 | 48 | 1.132877% |
Noise dominated data is calculated using 1-second bins in cleaned event files. If a bin has >2000 counts, and if more than 50% of those come from <1% of pixels, then it is considered to be noise-dominated and hence unusable.
| Quadrant | # 1 sec bins | Bins with >0 counts | Bins with >2000 counts | High rate bins dominated by noise | Noise dominated (total time) | Noise dominated (detector-on time) | Marked lightcurve |
|---|---|---|---|---|---|---|---|
| A | 5040 | 4269 | 52 | 52 | 1.03% | 1.22% |  |
| B | 5040 | 4272 | 0 | 0 | 0.00% | 0.00% | 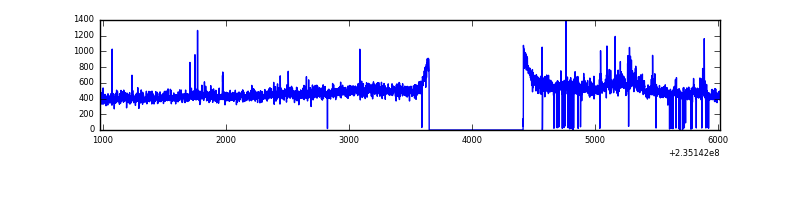 |
| C | 5040 | 4274 | 0 | 0 | 0.00% | 0.00% |  |
| D | 5040 | 4275 | 6 | 6 | 0.12% | 0.14% | 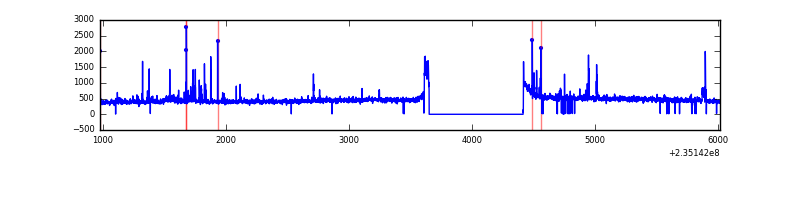 |
Top three noisy pixels from each quadrant. If the there are fewer than three noisy pixels in the level2.evt file, extra rows are filled as -1
| Pixel properties | Quadrant properties | ||||||
|---|---|---|---|---|---|---|---|
| Quadrant | DetID | PixID | Counts | Sigma | Mean | Median | Sigma |
| A | 8 | 5 | 773529 | 7359.92 | 506 | 494 | 105.0 |
| A | 13 | 248 | 56745 | 535.56 | 506 | 494 | 105.0 |
| A | 1 | 162 | 24902 | 232.38 | 506 | 494 | 105.0 |
| B | 0 | 219 | 37401 | 366.74 | 514 | 501 | 100.6 |
| B | 0 | 214 | 17971 | 173.63 | 514 | 501 | 100.6 |
| B | 4 | 173 | 17561 | 169.56 | 514 | 501 | 100.6 |
| C | 9 | 68 | 36938 | 312.34 | 497 | 499 | 116.7 |
| C | 14 | 234 | 9148 | 74.14 | 497 | 499 | 116.7 |
| C | 13 | 61 | 3743 | 27.81 | 497 | 499 | 116.7 |
| D | 2 | 136 | 83963 | 693.04 | 494 | 482 | 120.5 |
| D | 1 | 52 | 42454 | 348.44 | 494 | 482 | 120.5 |
| D | 7 | 71 | 20808 | 168.74 | 494 | 482 | 120.5 |
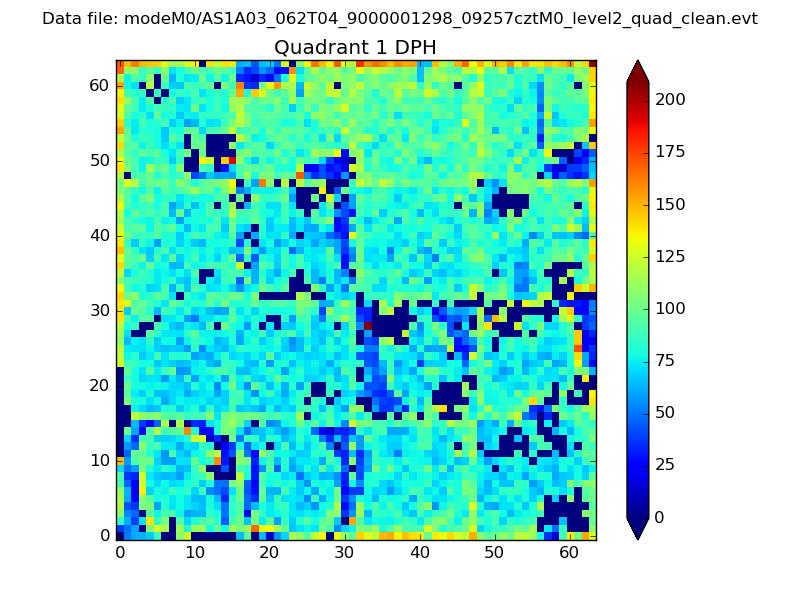
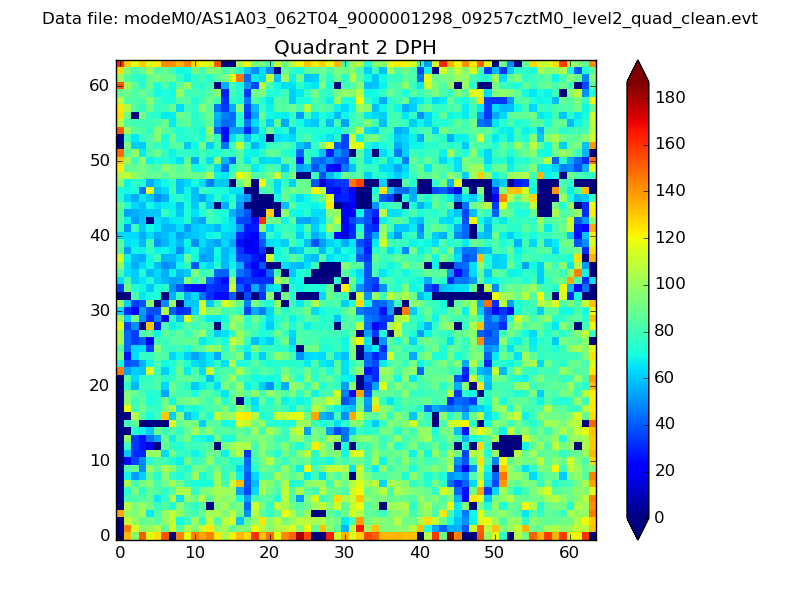
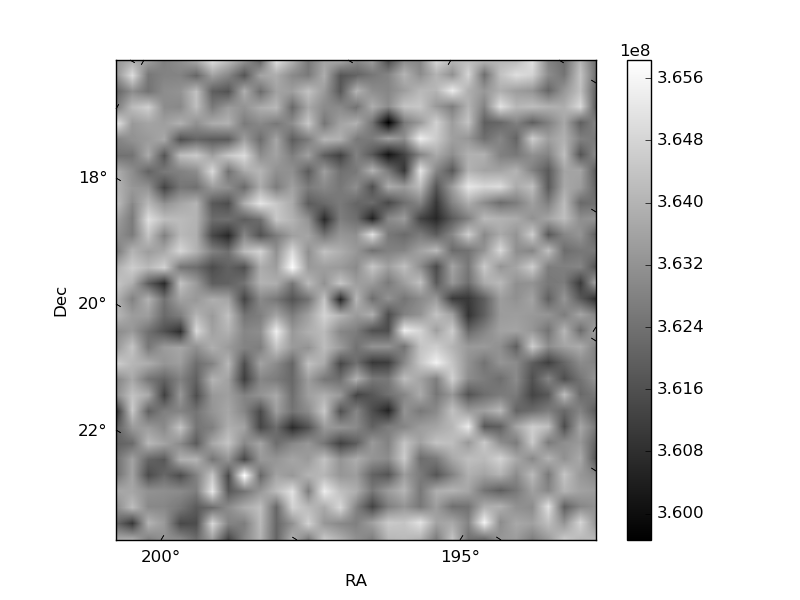
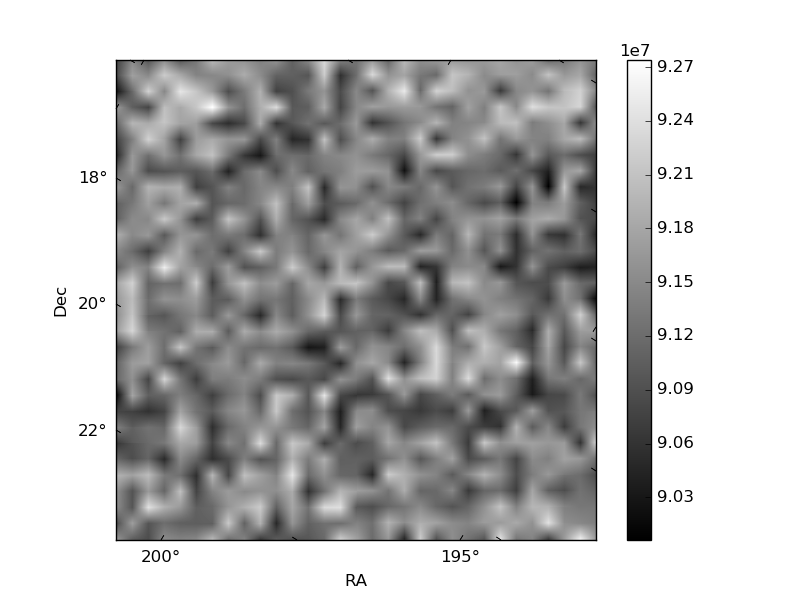
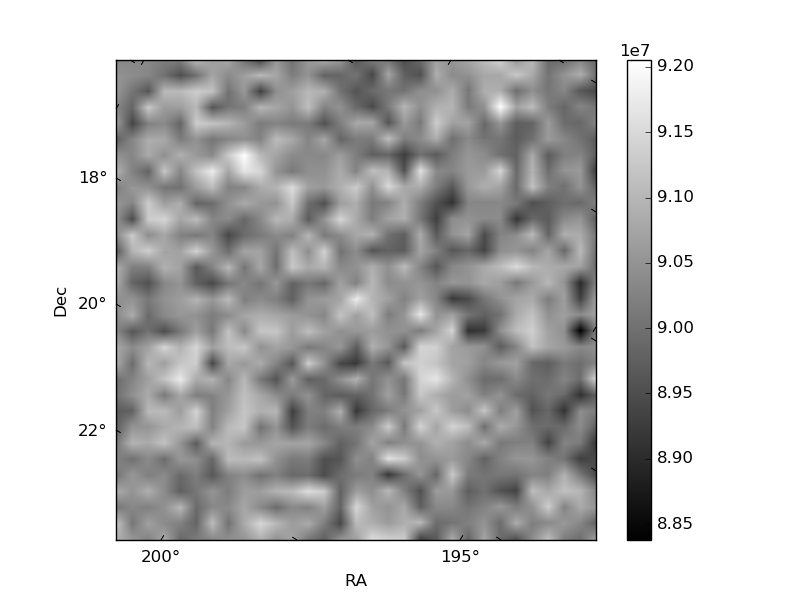
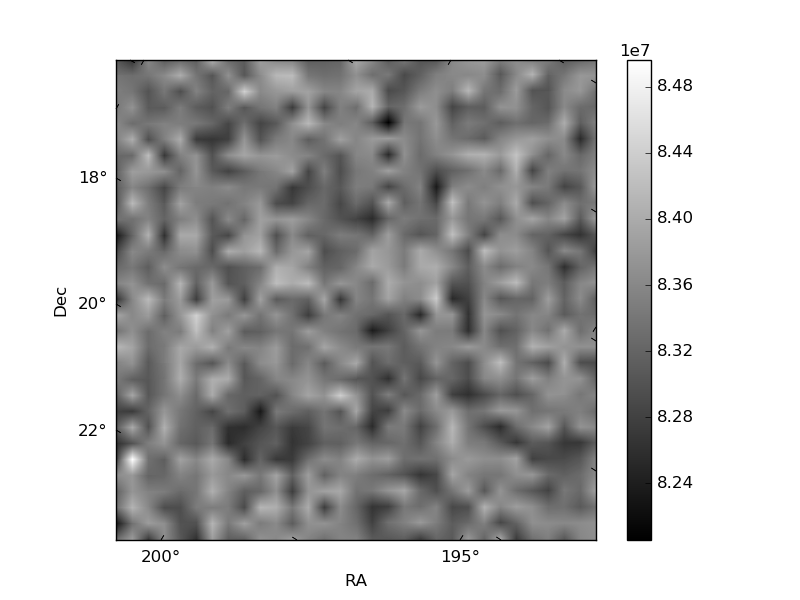
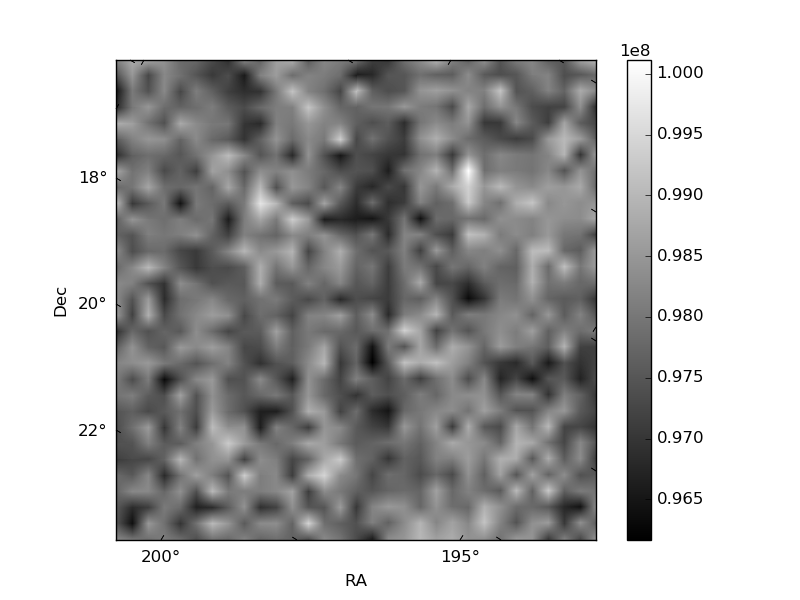
Histogram calculated using DETX and DETY for each event in the final _common_clean file
| Quadrant A |  |
 |
Quadrant B |
|---|---|---|---|
| Quadrant D |  |
 |
Quadrant C |
| Plot type | Count rate plots | Images |
|---|---|---|
| Comparison with Poisson distribution Blue bars denote a histogram of data divided into 1 sec bins. Red curve is a Poisson curve with rate = median count rate of data. |
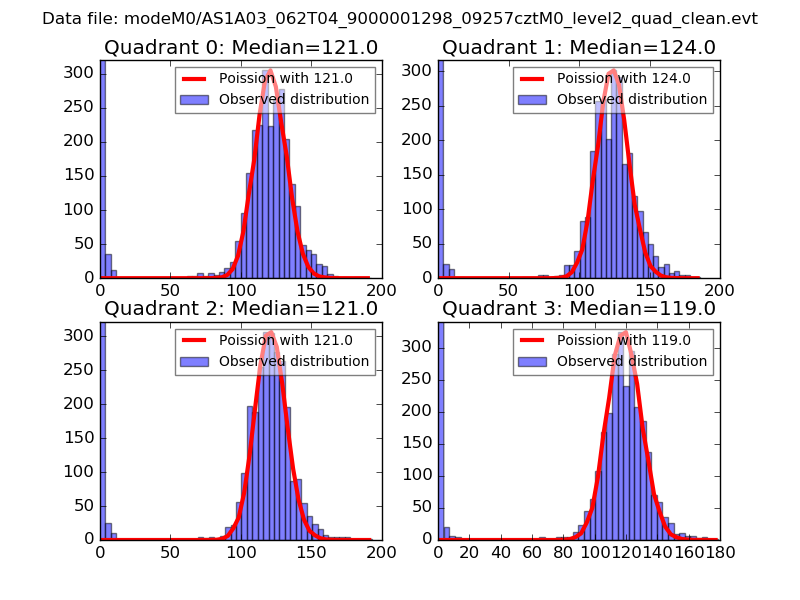 |
 |
| Quadrant-wise count rates Data is divided into 100 sec bins |
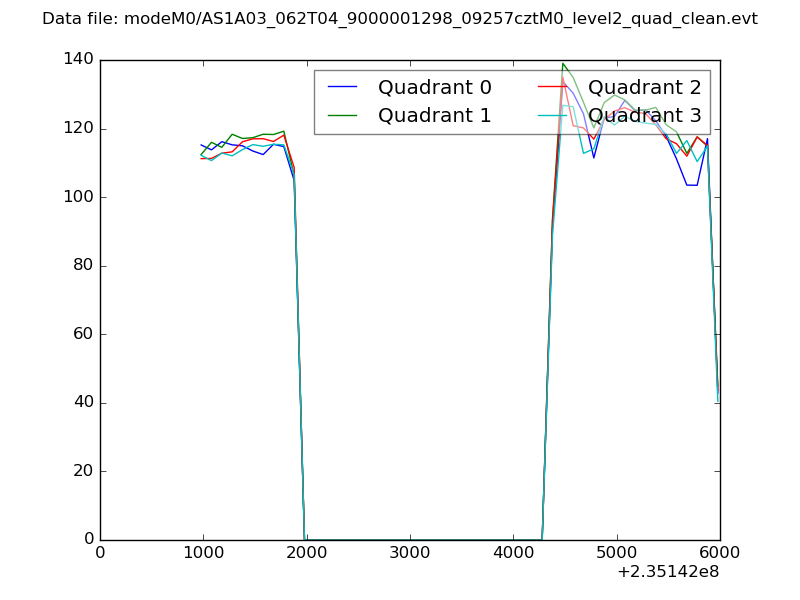 |
|
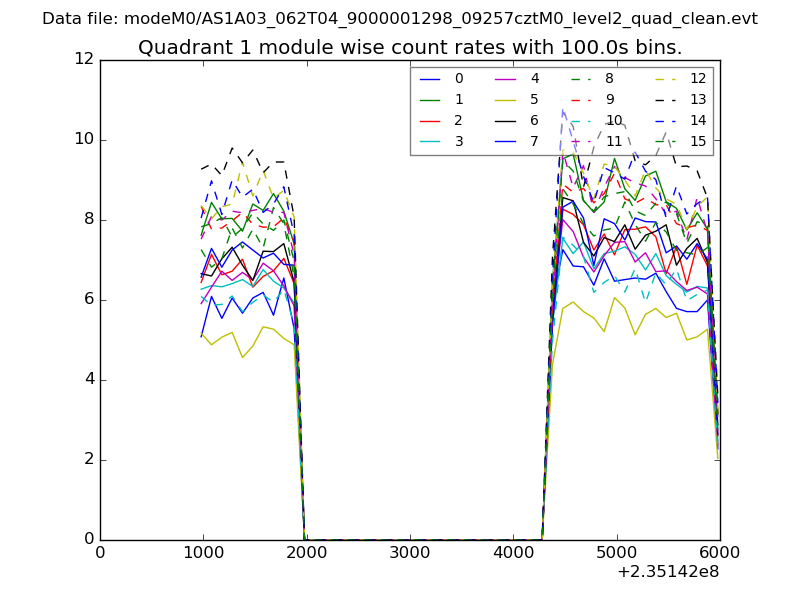
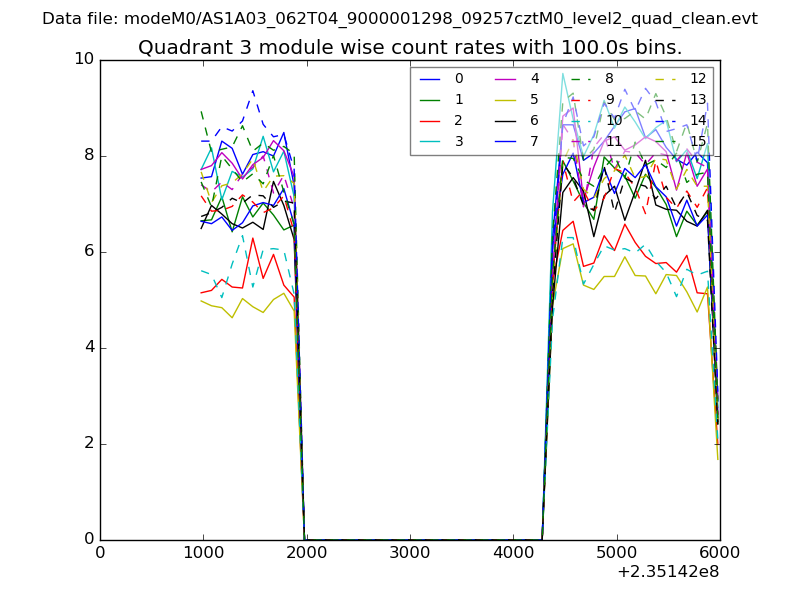
| Module-wise count rates for Quadrant A Data is divided into 100 sec bins |
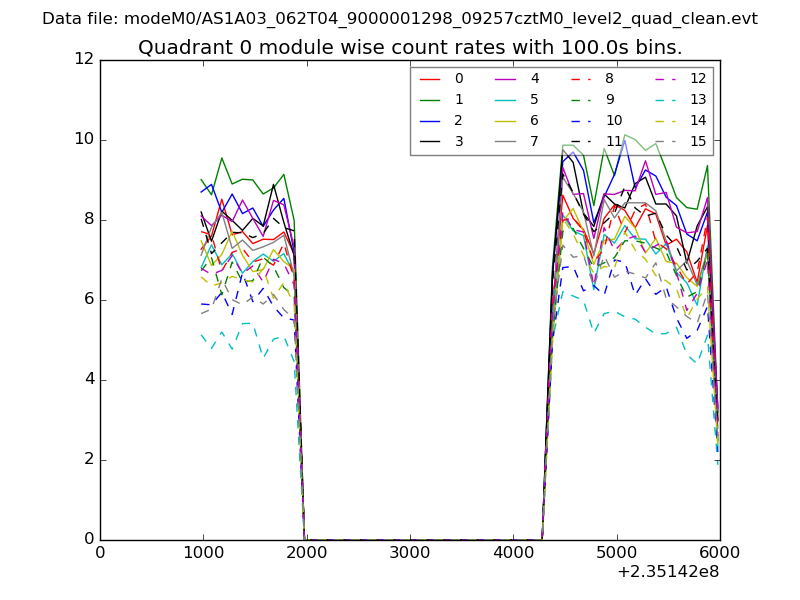 |
 |
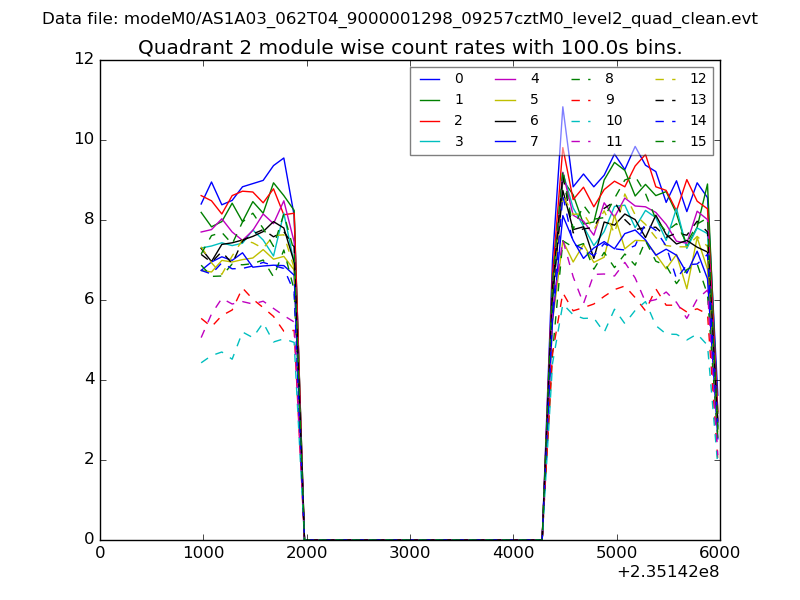
| Module-wise count rates for Quadrant B Data is divided into 100 sec bins |
 |
 |
| Module-wise count rates for Quadrant C Data is divided into 100 sec bins |
 |
 |
| Module-wise count rates for Quadrant D Data is divided into 100 sec bins |
 |
 |
| Parameter | Plot |
|---|---|
| CZT HV Monitor |  |
| D_VDD | 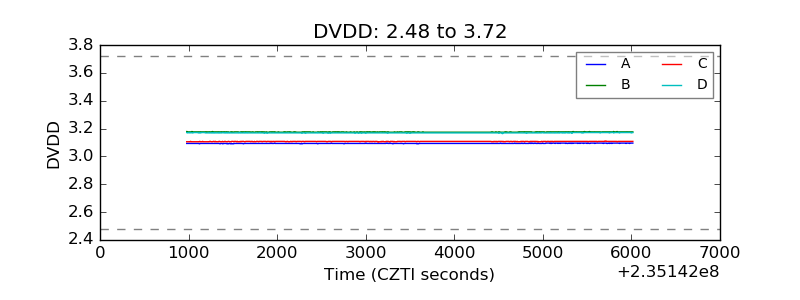 |
| Temperature 1 | 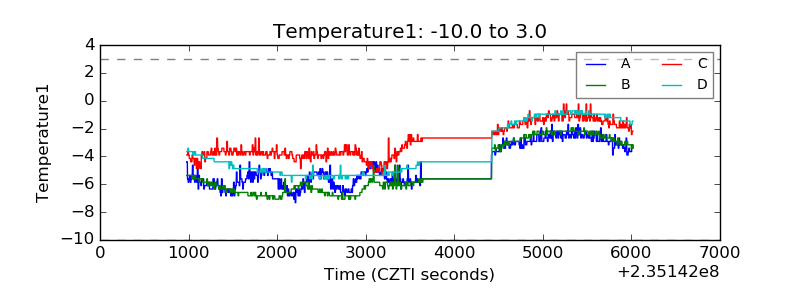 |
| Veto HV Monitor | 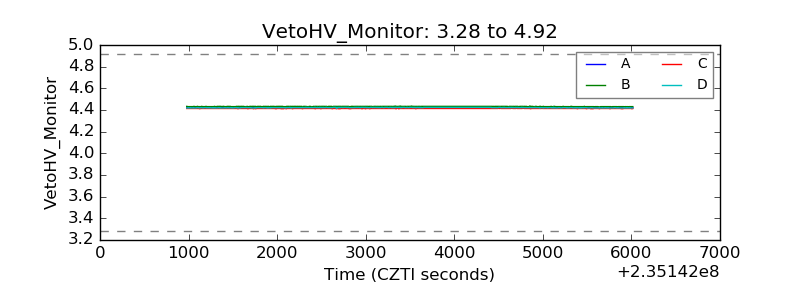 |
| Veto LLD | 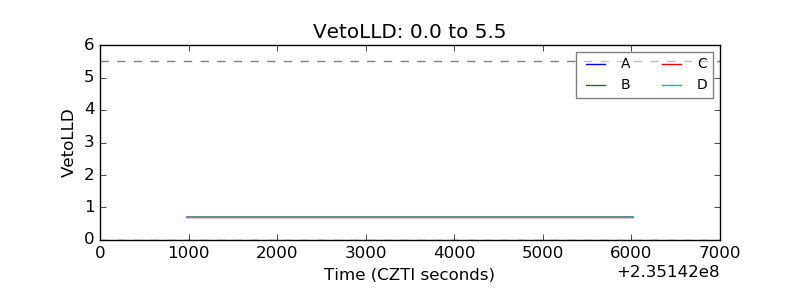 |
| Alpha Counter | 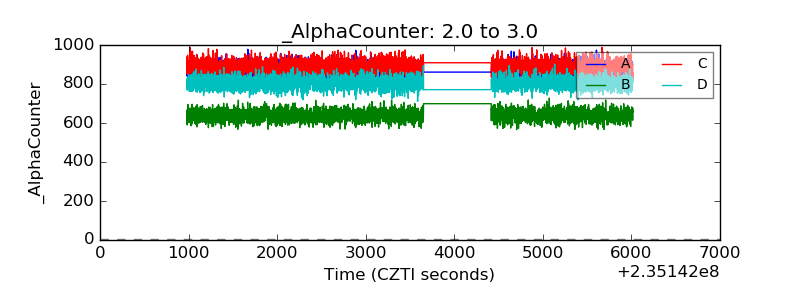 |
| _CPM_Rate | 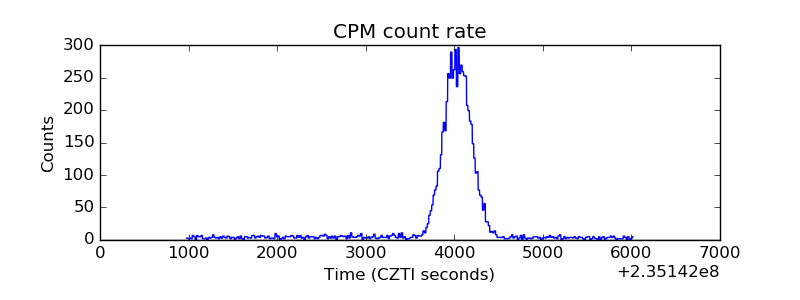 |
| CZT Counter |  |
| +2.5 Volts monitor |  |
| +5 Volts monitor |  |
| _ROLL_ROT | 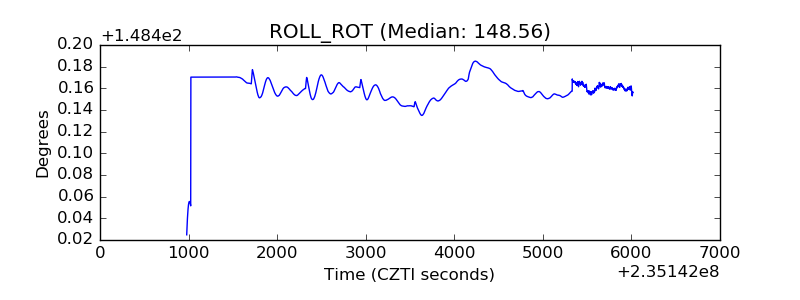 |
| _Roll_DEC | 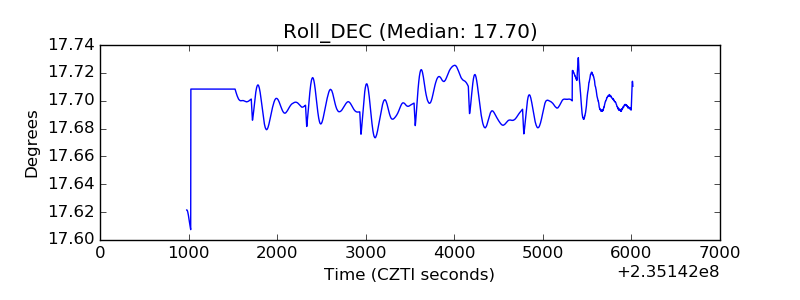 |
| _Roll_RA | 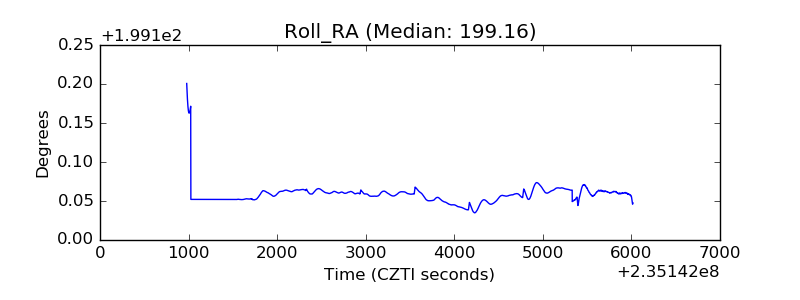 |
| Veto Counter | 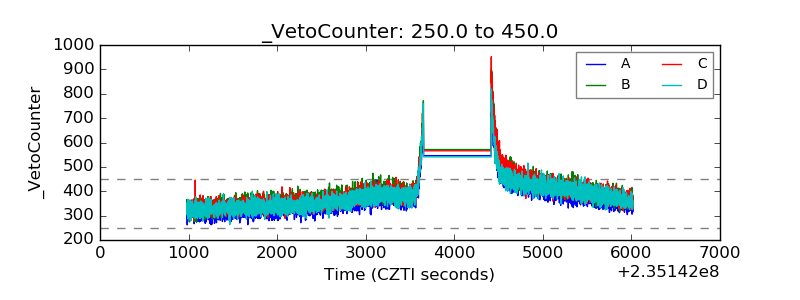 |