| Param | Original file | Final file |
|---|---|---|
| Filename | modeM0/AS1A03_062T04_9000001298_09260cztM0_level2.evt | modeM0/AS1A03_062T04_9000001298_09260cztM0_level2_quad_clean.evt |
| Size (bytes) | 475,882,560 | 87,085,440 |
| Size | 453.8 MB | 83.1 MB |
| Events in quadrant A | 4,693,305 | 543,142 |
| Events in quadrant B | 3,206,527 | 561,575 |
| Events in quadrant C | 3,022,025 | 549,146 |
| Events in quadrant D | 3,048,976 | 529,988 |
| Mode M0 | |||
|---|---|---|---|
| Quadrant | BADHDUFLAG | Total packets | Discarded packets |
| A | 0 | 18632 | 82 |
| B | 0 | 13856 | 22 |
| C | 0 | 13547 | 23 |
| D | 0 | 13743 | 36 |
| Mode SS | |||
|---|---|---|---|
| Quadrant | BADHDUFLAG | Total packets | Discarded packets |
| A | 0 | 132 | 0 |
| B | 0 | 132 | 0 |
| C | 0 | 132 | 0 |
| D | 0 | 132 | 0 |
| Mode M9 | |||
|---|---|---|---|
| Quadrant | BADHDUFLAG | Total packets | Discarded packets |
| A | 0 | 16 | 0 |
| B | 0 | 16 | 0 |
| C | 0 | 16 | 0 |
| D | 0 | 17 | 0 |
| Quadrant | Total seconds | Saturated seconds | Saturation percentage |
|---|---|---|---|
| A | 6491 | 92 | 1.417347% |
| B | 6505 | 42 | 0.645657% |
| C | 6504 | 23 | 0.353629% |
| D | 6499 | 50 | 0.769349% |
Noise dominated data is calculated using 1-second bins in cleaned event files. If a bin has >2000 counts, and if more than 50% of those come from <1% of pixels, then it is considered to be noise-dominated and hence unusable.
| Quadrant | # 1 sec bins | Bins with >0 counts | Bins with >2000 counts | High rate bins dominated by noise | Noise dominated (total time) | Noise dominated (detector-on time) | Marked lightcurve |
|---|---|---|---|---|---|---|---|
| A | 7615 | 6516 | 28 | 28 | 0.37% | 0.43% | 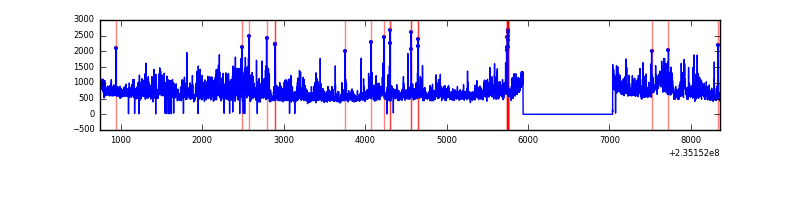 |
| B | 7615 | 6516 | 2 | 2 | 0.03% | 0.03% | 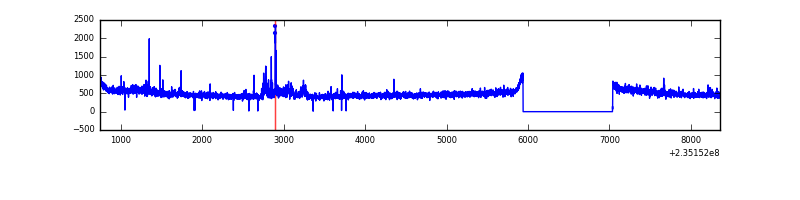 |
| C | 7615 | 6515 | 3 | 3 | 0.04% | 0.05% | 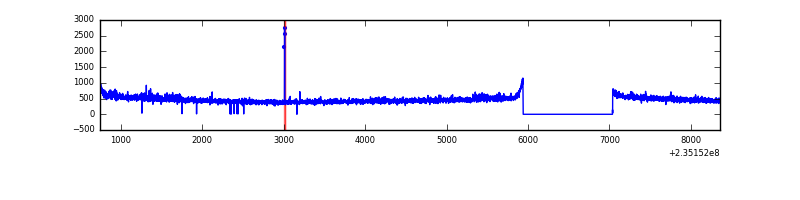 |
| D | 7615 | 6516 | 15 | 15 | 0.20% | 0.23% | 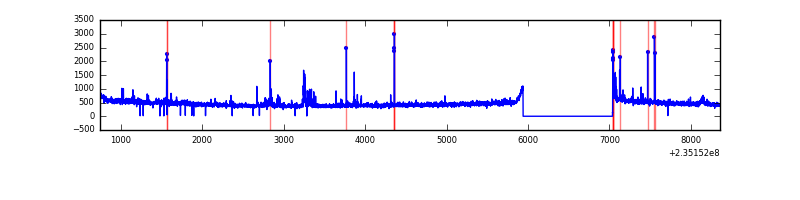 |
Top three noisy pixels from each quadrant. If the there are fewer than three noisy pixels in the level2.evt file, extra rows are filled as -1
| Pixel properties | Quadrant properties | ||||||
|---|---|---|---|---|---|---|---|
| Quadrant | DetID | PixID | Counts | Sigma | Mean | Median | Sigma |
| A | 8 | 5 | 1521443 | 9563.88 | 774 | 756 | 159.0 |
| A | 4 | 2 | 112062 | 700.02 | 774 | 756 | 159.0 |
| A | 1 | 162 | 38409 | 236.81 | 774 | 756 | 159.0 |
| B | 0 | 219 | 85762 | 571.16 | 782 | 762 | 148.8 |
| B | 0 | 214 | 53653 | 355.4 | 782 | 762 | 148.8 |
| B | 12 | 111 | 15775 | 100.88 | 782 | 762 | 148.8 |
| C | 9 | 68 | 41785 | 232.25 | 760 | 762 | 176.6 |
| C | 14 | 234 | 8044 | 41.23 | 760 | 762 | 176.6 |
| C | 13 | 61 | 5847 | 28.79 | 760 | 762 | 176.6 |
| D | 7 | 71 | 70659 | 352.32 | 754 | 736 | 198.5 |
| D | 2 | 136 | 41052 | 203.14 | 754 | 736 | 198.5 |
| D | 2 | 14 | 28099 | 137.88 | 754 | 736 | 198.5 |
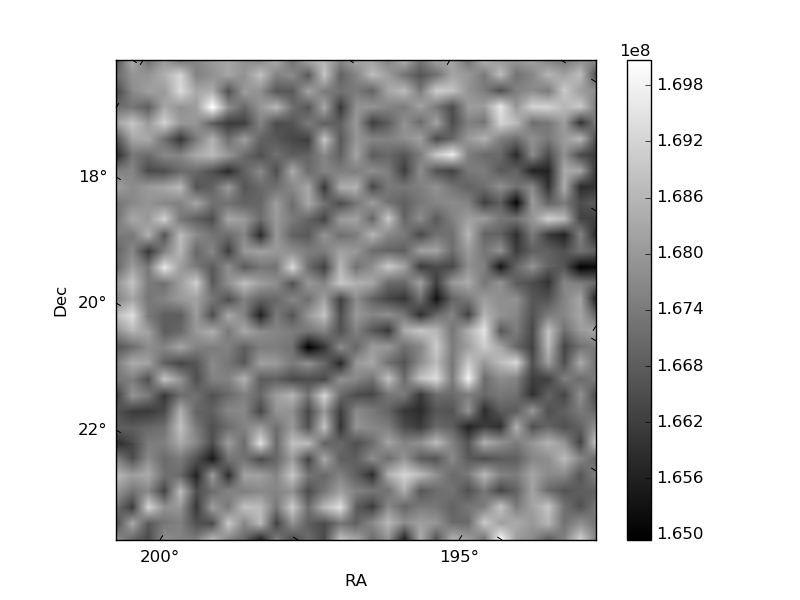
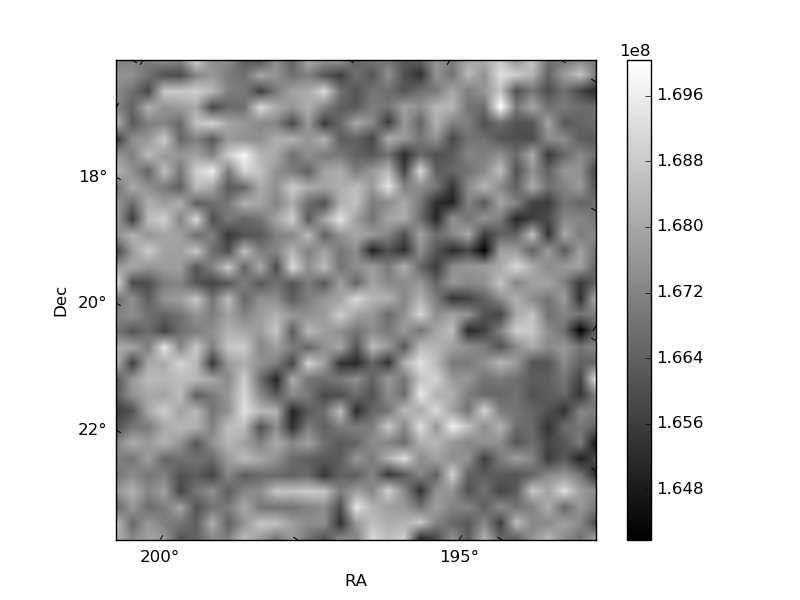
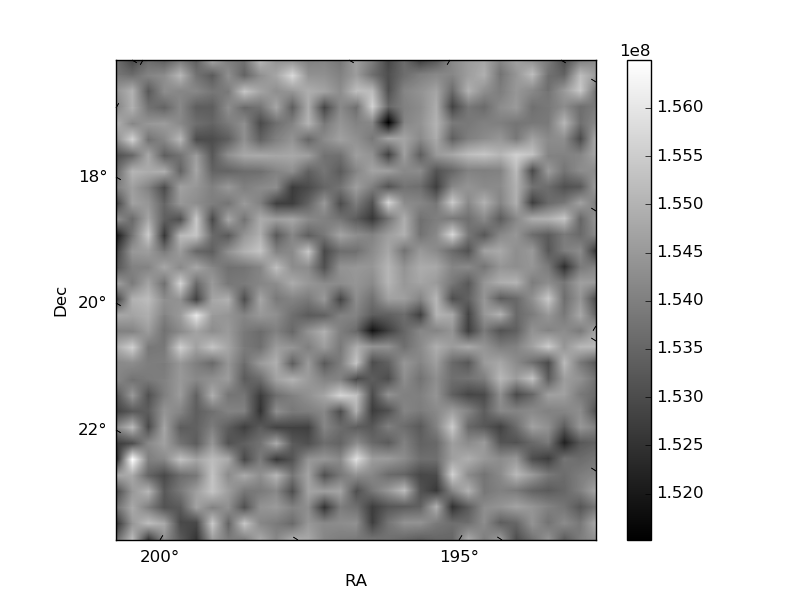
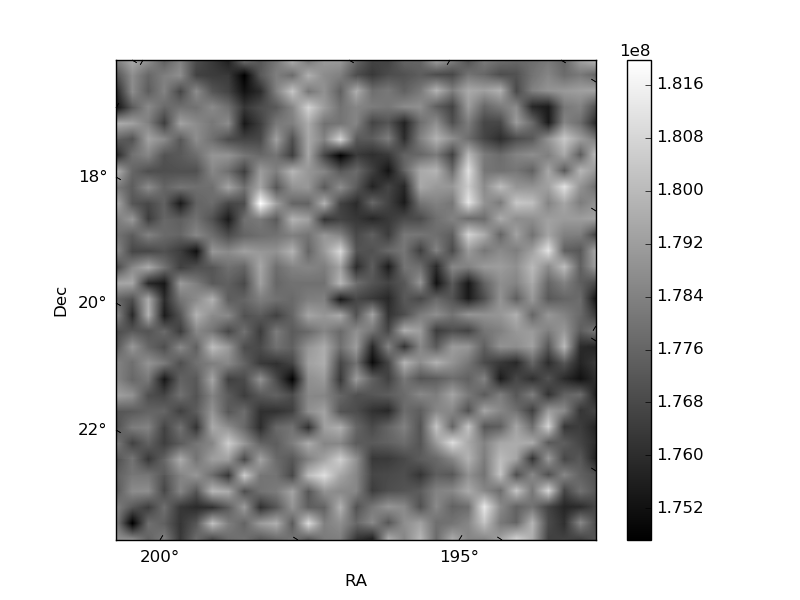
Histogram calculated using DETX and DETY for each event in the final _common_clean file
| Quadrant A | 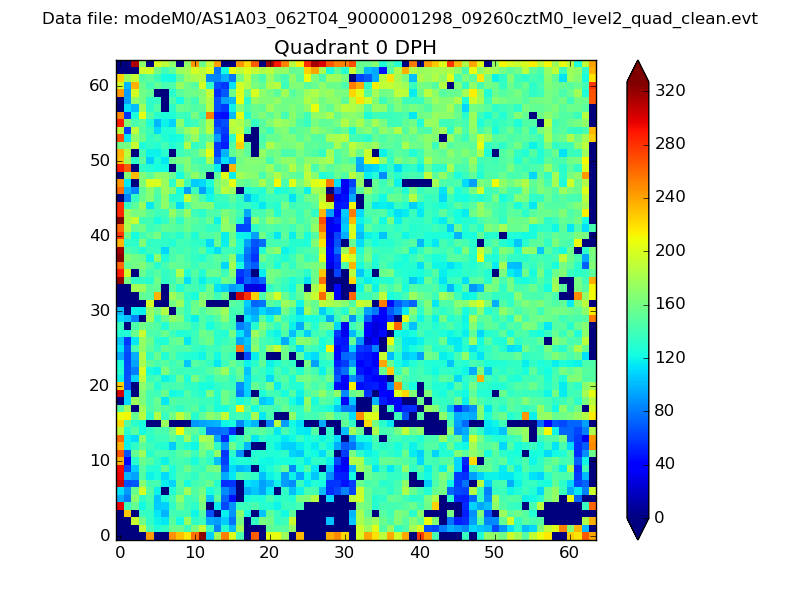 |
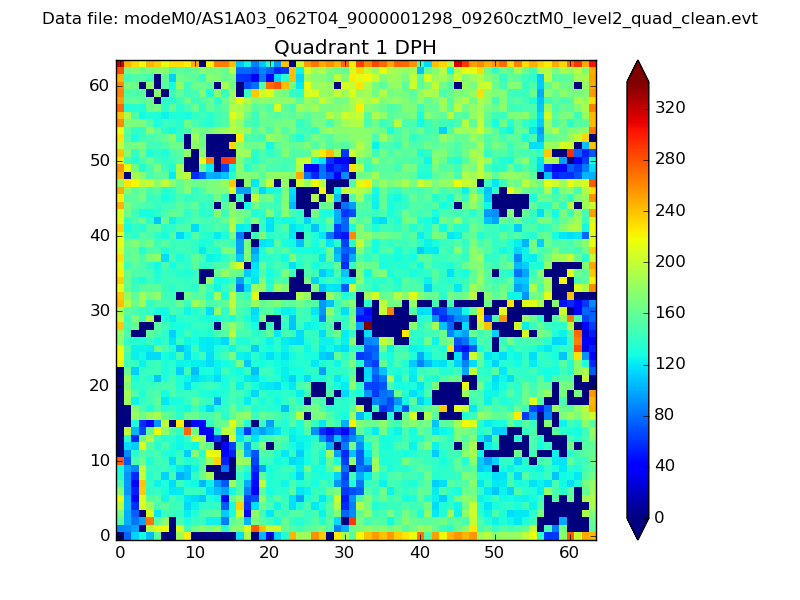 |
Quadrant B |
|---|---|---|---|
| Quadrant D | 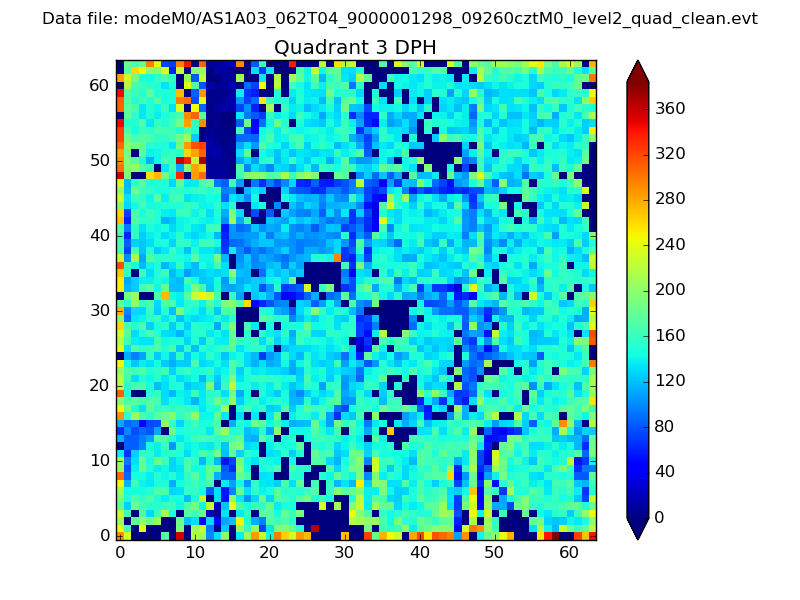 |
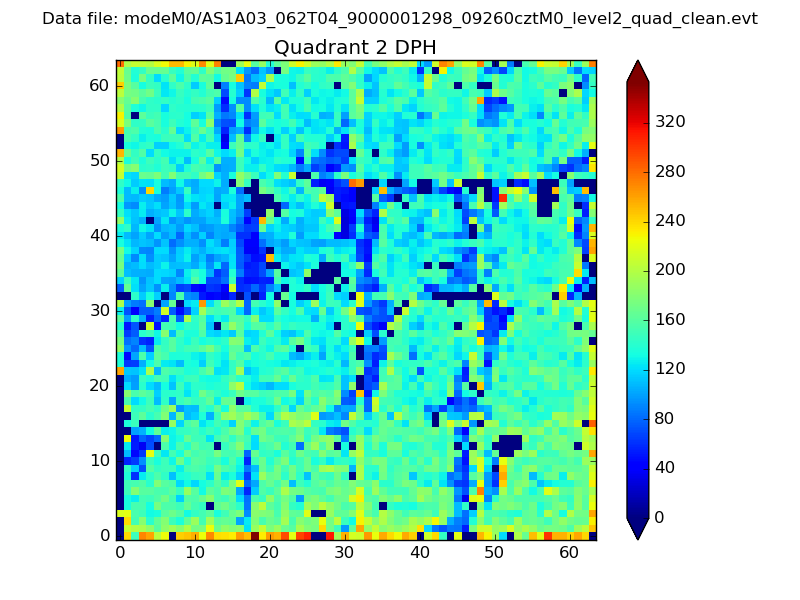 |
Quadrant C |
| Plot type | Count rate plots | Images |
|---|---|---|
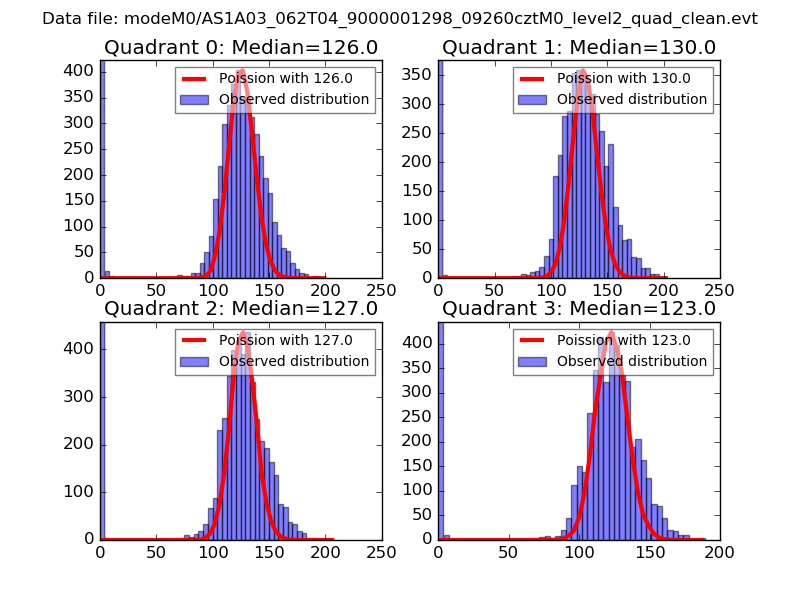
| Comparison with Poisson distribution Blue bars denote a histogram of data divided into 1 sec bins. Red curve is a Poisson curve with rate = median count rate of data. |
 |
 |
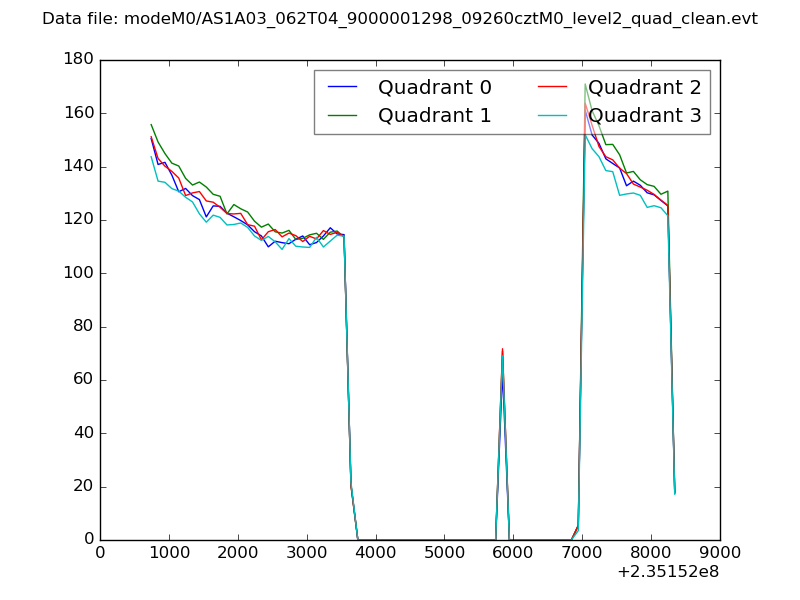
| Quadrant-wise count rates Data is divided into 100 sec bins |
 |
|
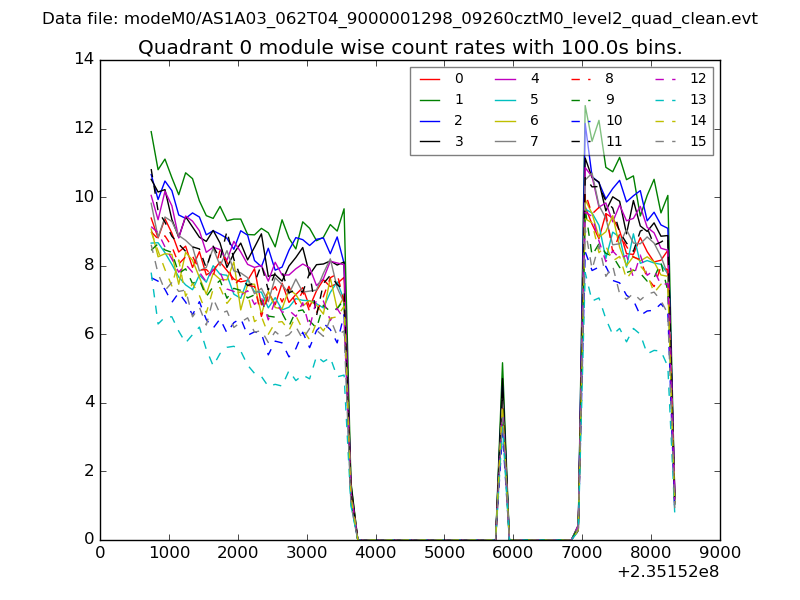
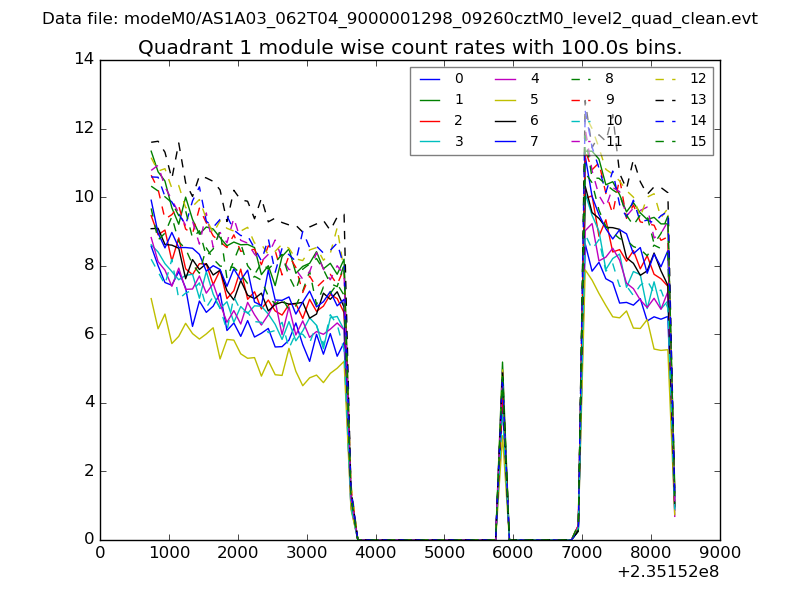
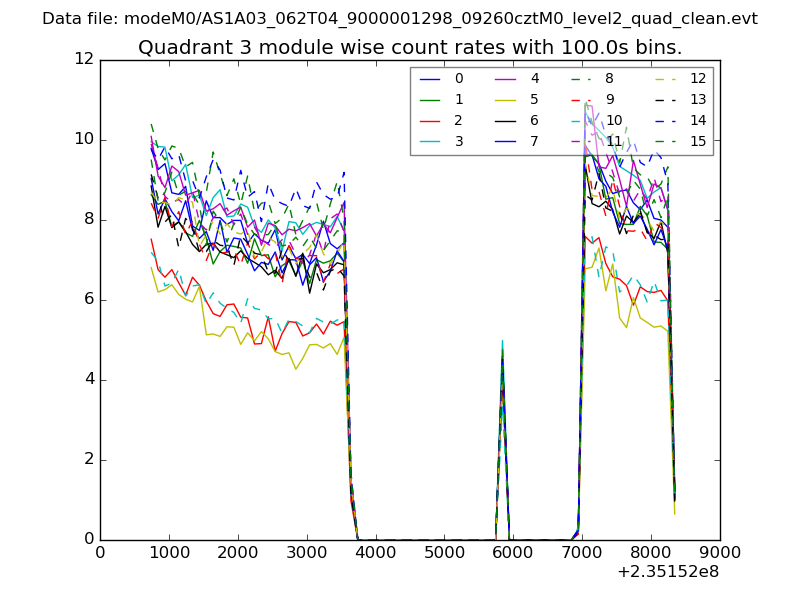
| Module-wise count rates for Quadrant A Data is divided into 100 sec bins |
 |
 |
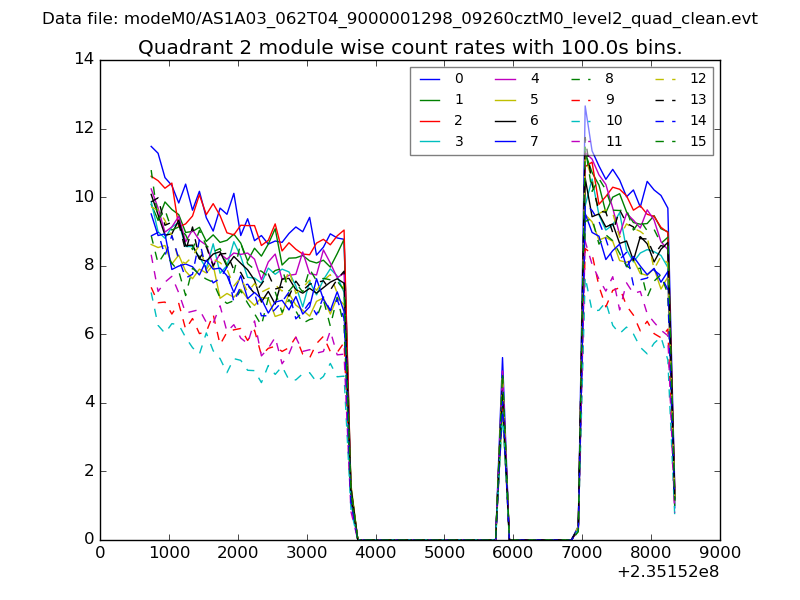
| Module-wise count rates for Quadrant B Data is divided into 100 sec bins |
 |
 |
| Module-wise count rates for Quadrant C Data is divided into 100 sec bins |
 |
 |
| Module-wise count rates for Quadrant D Data is divided into 100 sec bins |
 |
 |
| Parameter | Plot |
|---|---|
| CZT HV Monitor | 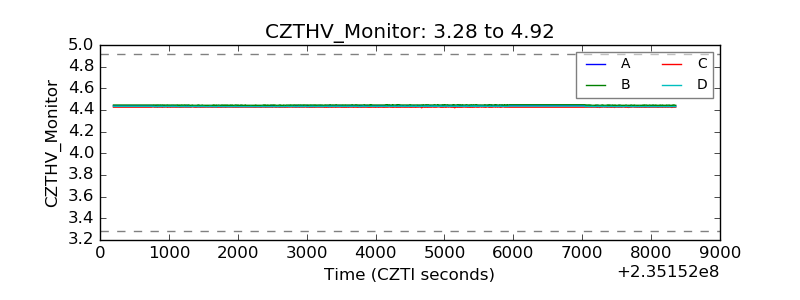 |
| D_VDD | 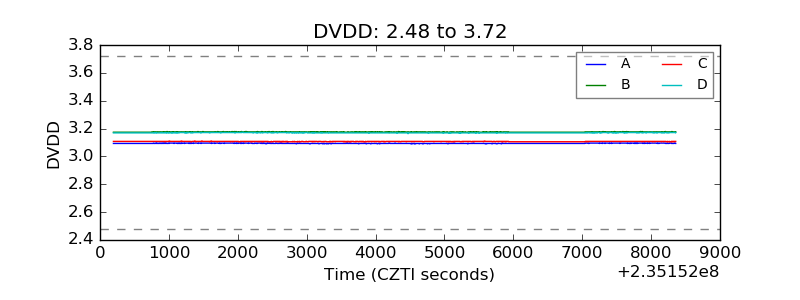 |
| Temperature 1 | 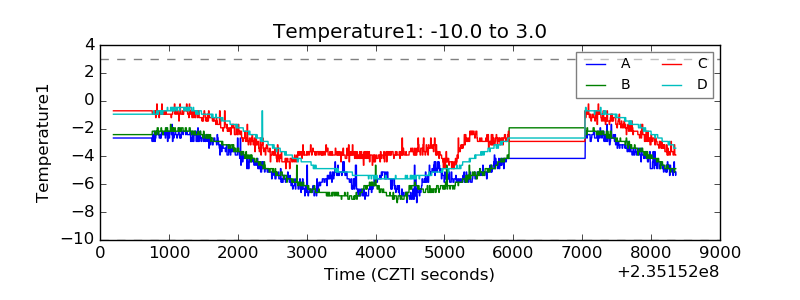 |
| Veto HV Monitor | 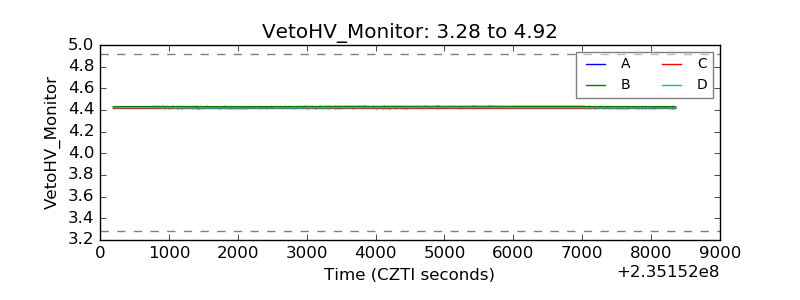 |
| Veto LLD | 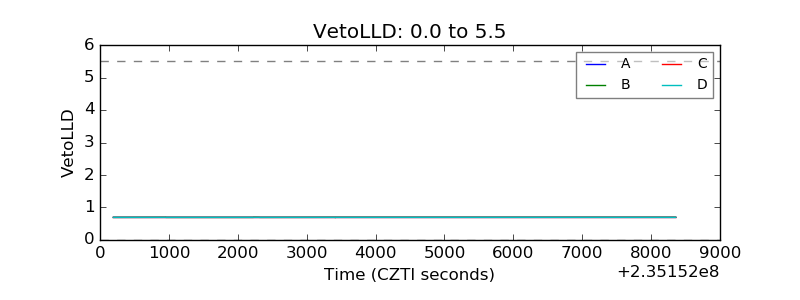 |
| Alpha Counter | 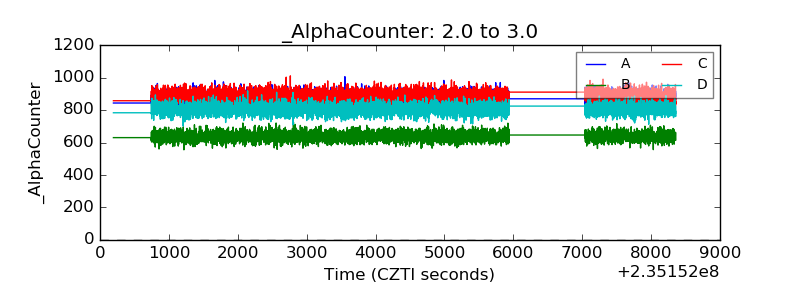 |
| _CPM_Rate | 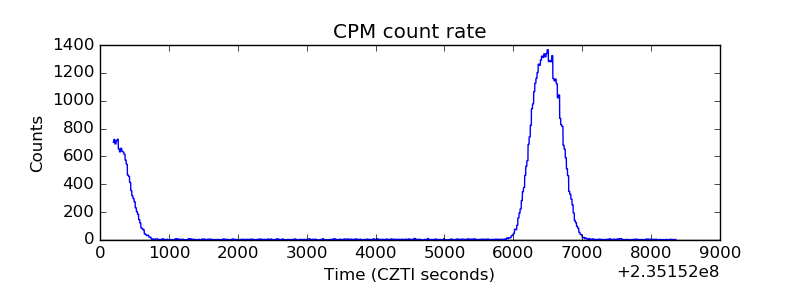 |
| CZT Counter | 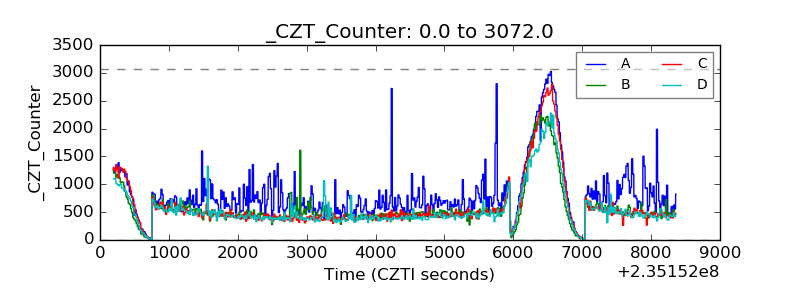 |
| +2.5 Volts monitor |  |
| +5 Volts monitor | 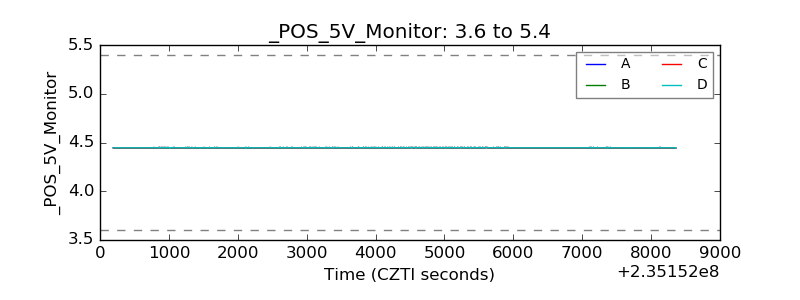 |
| _ROLL_ROT | 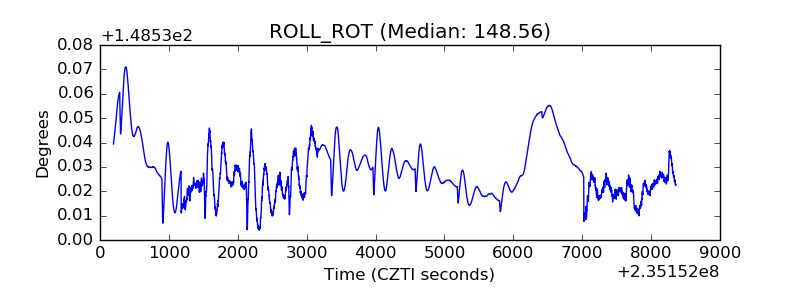 |
| _Roll_DEC | 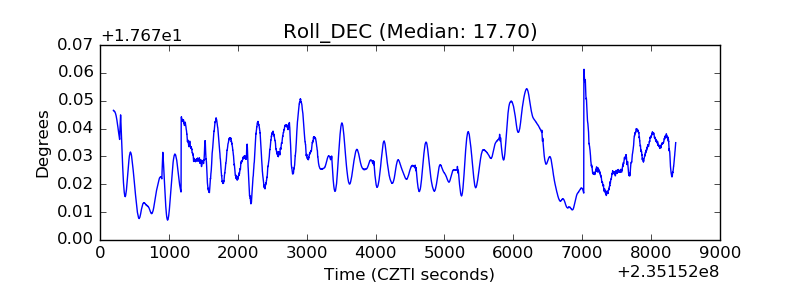 |
| _Roll_RA | 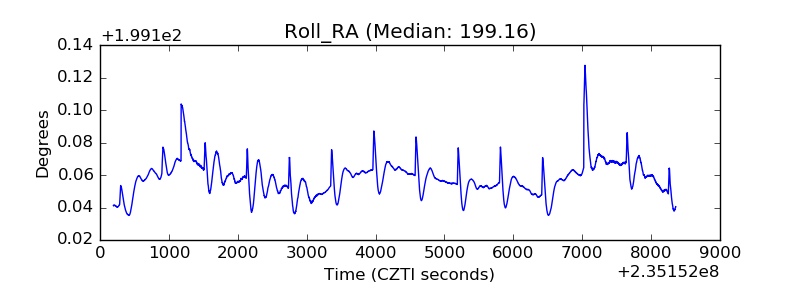 |
| Veto Counter | 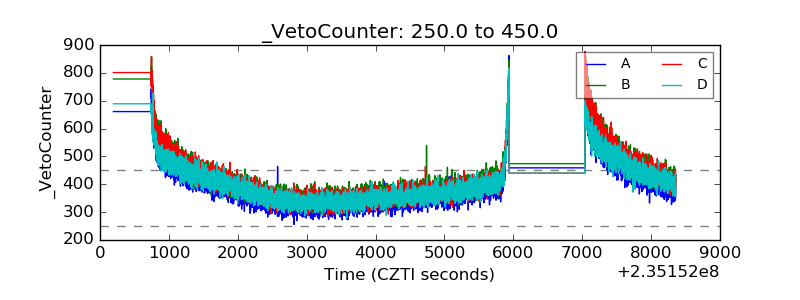 |