| Param | Original file | Final file |
|---|---|---|
| Filename | modeM0/AS1A03_062T04_9000001298_09261cztM0_level2.evt | modeM0/AS1A03_062T04_9000001298_09261cztM0_level2_quad_clean.evt |
| Size (bytes) | 423,820,800 | 76,731,840 |
| Size | 404.2 MB | 73.2 MB |
| Events in quadrant A | 4,045,982 | 479,662 |
| Events in quadrant B | 2,796,387 | 496,659 |
| Events in quadrant C | 2,866,734 | 484,743 |
| Events in quadrant D | 2,738,432 | 463,650 |
| Mode M0 | |||
|---|---|---|---|
| Quadrant | BADHDUFLAG | Total packets | Discarded packets |
| A | 0 | 16757 | 698 |
| B | 0 | 12475 | 354 |
| C | 0 | 12490 | 326 |
| D | 0 | 12566 | 400 |
| Mode SS | |||
|---|---|---|---|
| Quadrant | BADHDUFLAG | Total packets | Discarded packets |
| A | 0 | 120 | 4 |
| B | 0 | 120 | 2 |
| C | 0 | 119 | 6 |
| D | 0 | 120 | 4 |
| Mode M9 | |||
|---|---|---|---|
| Quadrant | BADHDUFLAG | Total packets | Discarded packets |
| A | 0 | 16 | 0 |
| B | 0 | 16 | 2 |
| C | 0 | 16 | 0 |
| D | 0 | 17 | 0 |
| Quadrant | Total seconds | Saturated seconds | Saturation percentage |
|---|---|---|---|
| A | 5663 | 113 | 1.995409% |
| B | 5719 | 51 | 0.891764% |
| C | 5737 | 25 | 0.435768% |
| D | 5703 | 52 | 0.911801% |
Noise dominated data is calculated using 1-second bins in cleaned event files. If a bin has >2000 counts, and if more than 50% of those come from <1% of pixels, then it is considered to be noise-dominated and hence unusable.
| Quadrant | # 1 sec bins | Bins with >0 counts | Bins with >2000 counts | High rate bins dominated by noise | Noise dominated (total time) | Noise dominated (detector-on time) | Marked lightcurve |
|---|---|---|---|---|---|---|---|
| A | 7064 | 5865 | 45 | 45 | 0.64% | 0.77% | 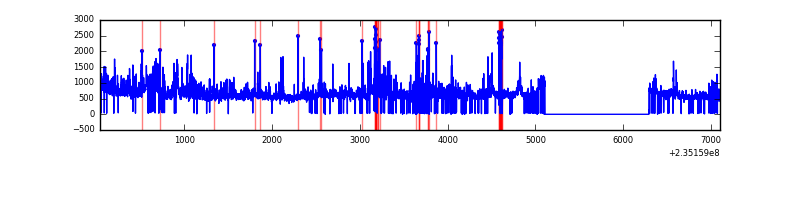 |
| B | 7064 | 5871 | 1 | 1 | 0.01% | 0.02% | 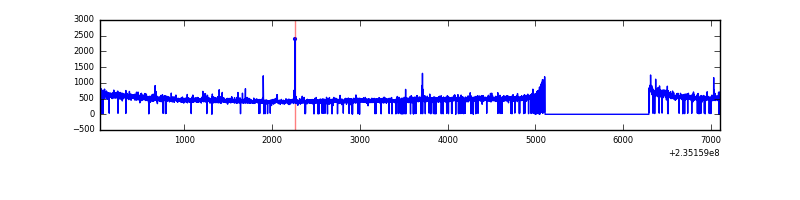 |
| C | 7064 | 5874 | 4 | 4 | 0.06% | 0.07% | 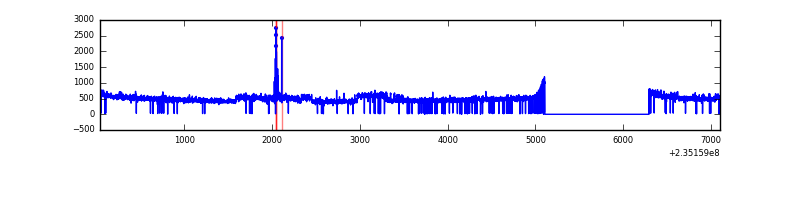 |
| D | 7064 | 5869 | 13 | 13 | 0.18% | 0.22% | 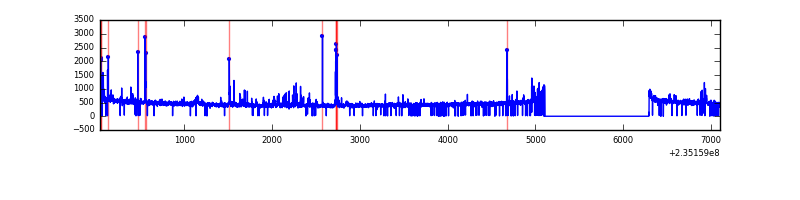 |
Top three noisy pixels from each quadrant. If the there are fewer than three noisy pixels in the level2.evt file, extra rows are filled as -1
| Pixel properties | Quadrant properties | ||||||
|---|---|---|---|---|---|---|---|
| Quadrant | DetID | PixID | Counts | Sigma | Mean | Median | Sigma |
| A | 8 | 5 | 1047119 | 7462.3 | 686 | 673 | 140.2 |
| A | 13 | 251 | 128273 | 909.93 | 686 | 673 | 140.2 |
| A | 4 | 2 | 106089 | 751.73 | 686 | 673 | 140.2 |
| B | 4 | 173 | 17637 | 126.98 | 702 | 685 | 133.5 |
| B | 0 | 214 | 16165 | 115.96 | 702 | 685 | 133.5 |
| B | 12 | 111 | 13924 | 99.17 | 702 | 685 | 133.5 |
| C | 9 | 68 | 187933 | 1196.11 | 680 | 684 | 156.5 |
| C | 14 | 234 | 22965 | 142.33 | 680 | 684 | 156.5 |
| C | 13 | 61 | 5124 | 28.36 | 680 | 684 | 156.5 |
| D | 2 | 136 | 92411 | 543.64 | 669 | 652 | 168.8 |
| D | 7 | 71 | 31213 | 181.06 | 669 | 652 | 168.8 |
| D | 12 | 233 | 22447 | 129.13 | 669 | 652 | 168.8 |
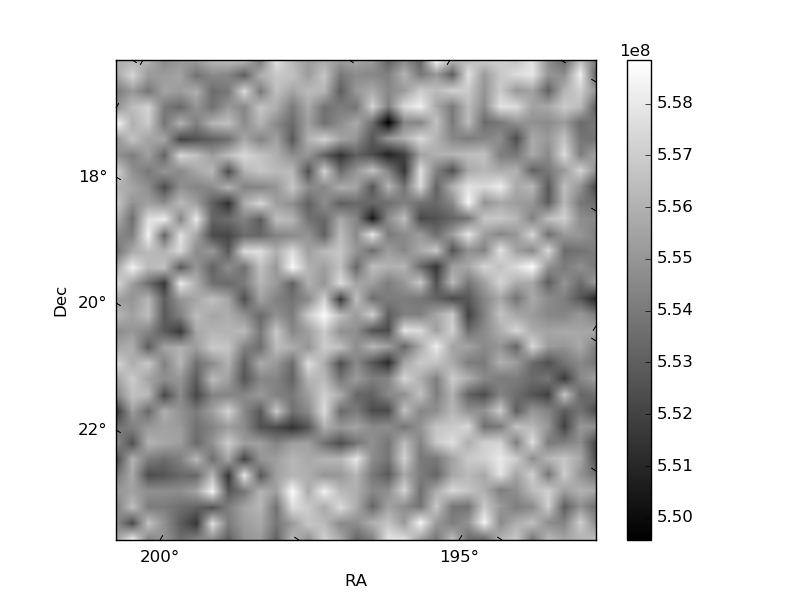
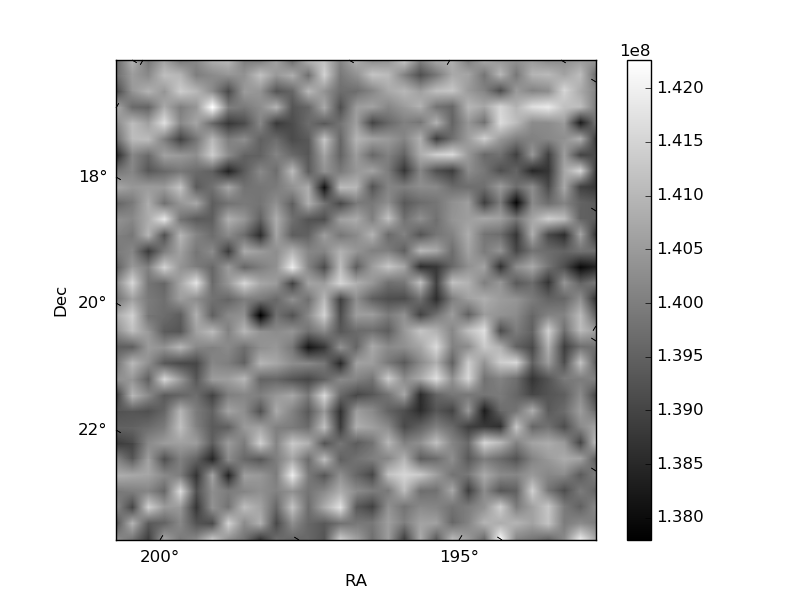
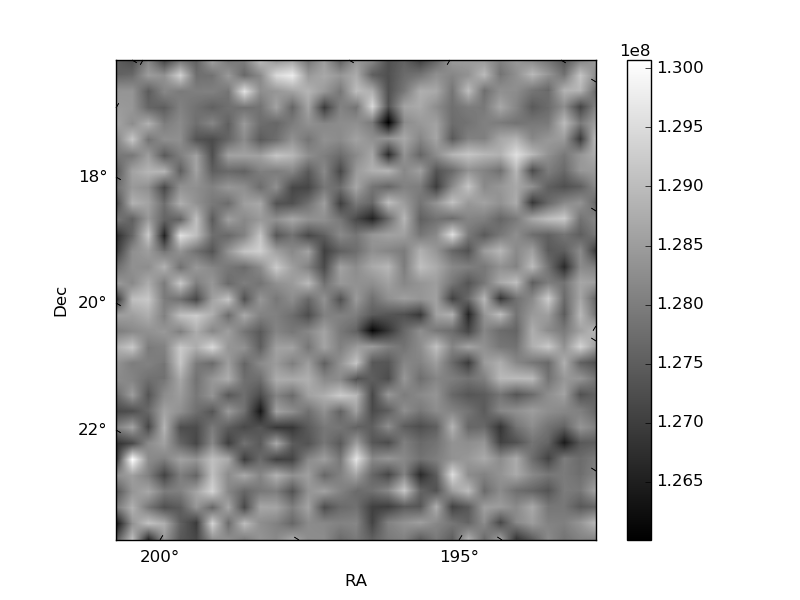
Histogram calculated using DETX and DETY for each event in the final _common_clean file
| Quadrant A | 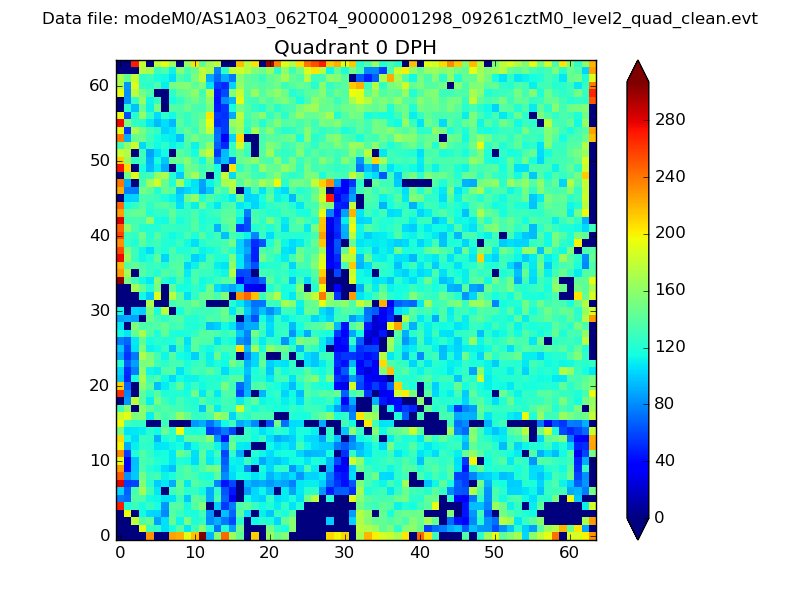 |
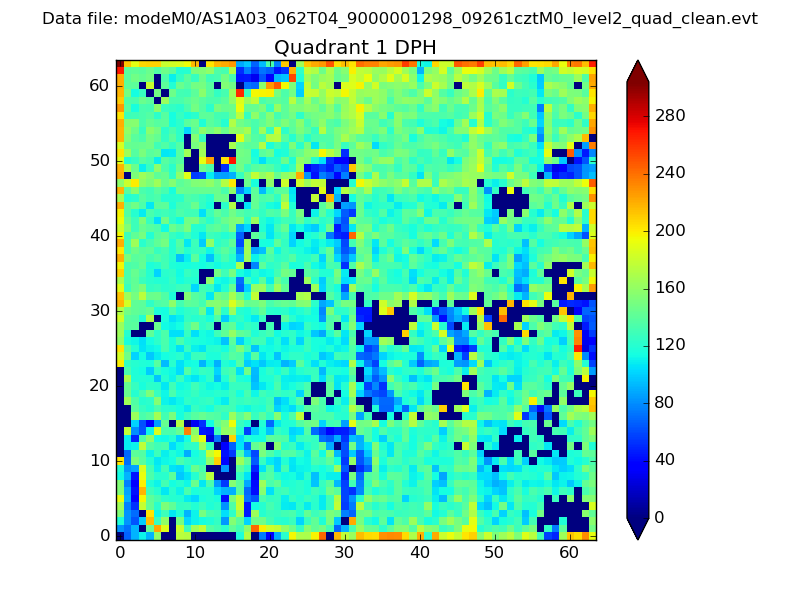 |
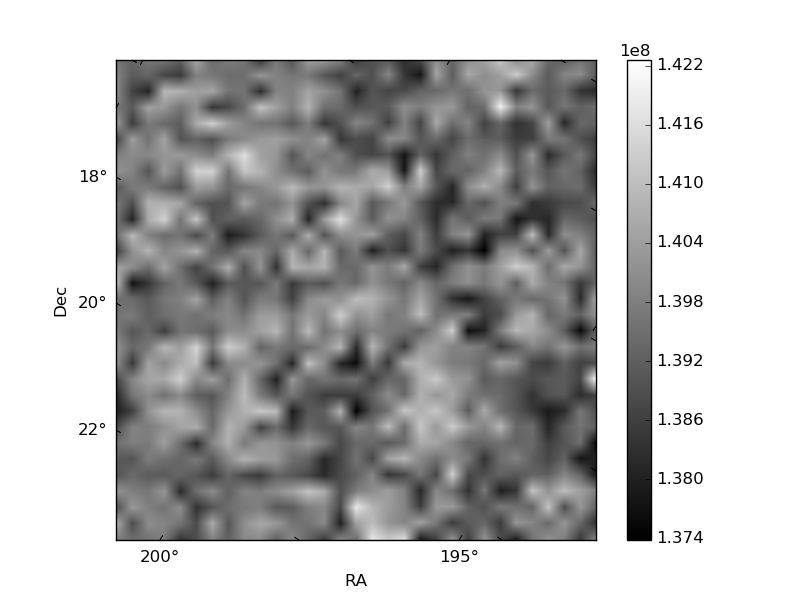
Quadrant B |
|---|---|---|---|
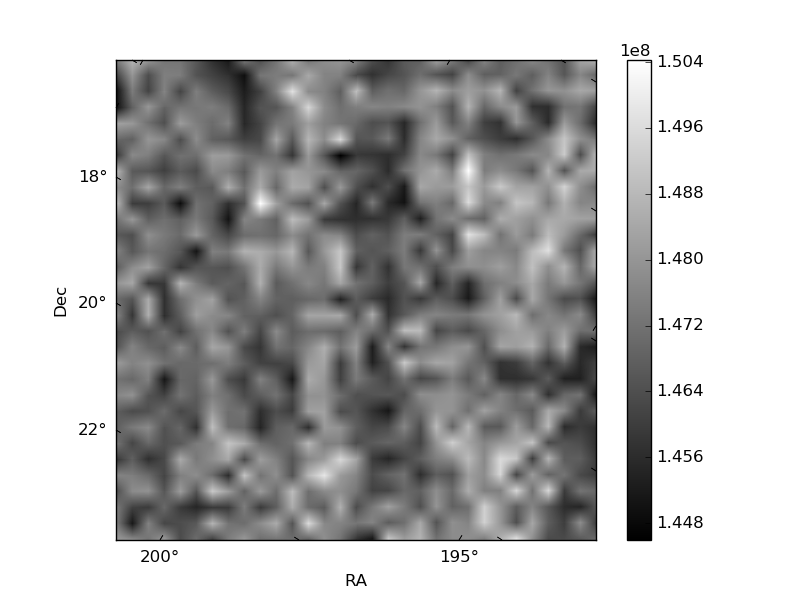
| Quadrant D | 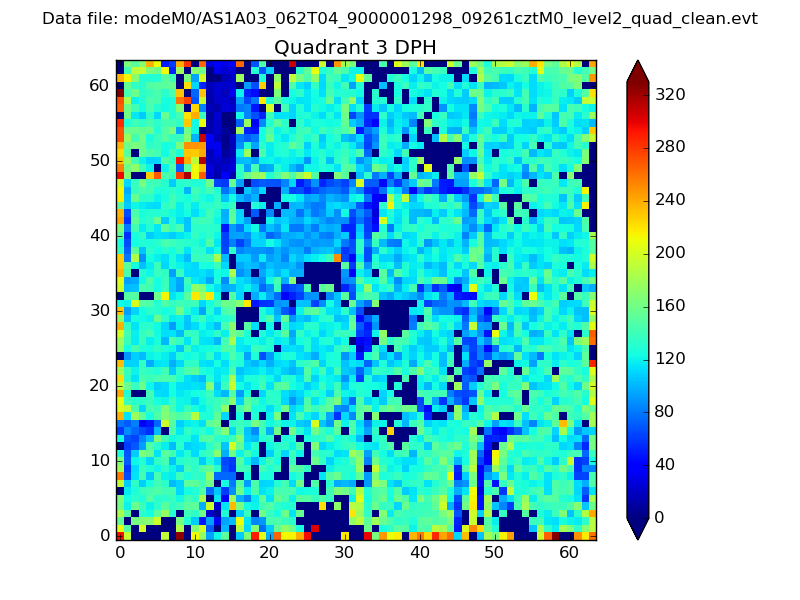 |
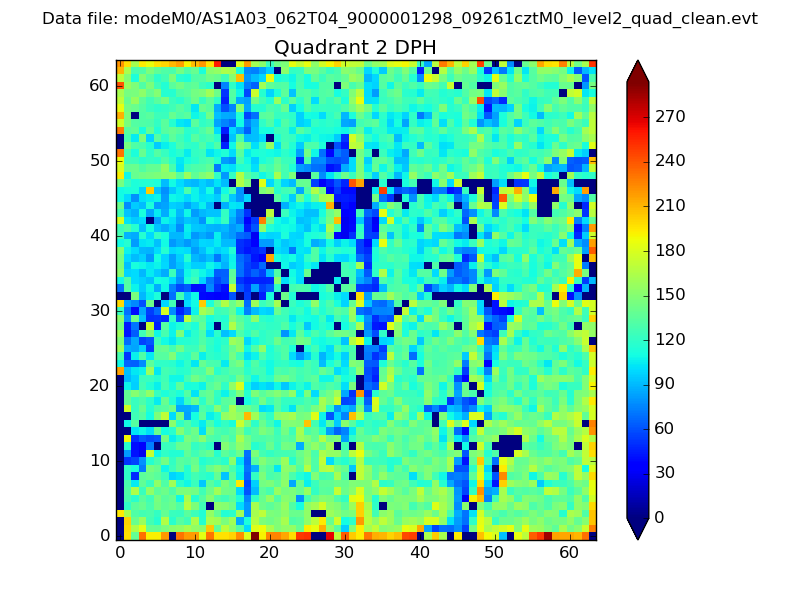 |
Quadrant C |
| Plot type | Count rate plots | Images |
|---|---|---|
| Comparison with Poisson distribution Blue bars denote a histogram of data divided into 1 sec bins. Red curve is a Poisson curve with rate = median count rate of data. |
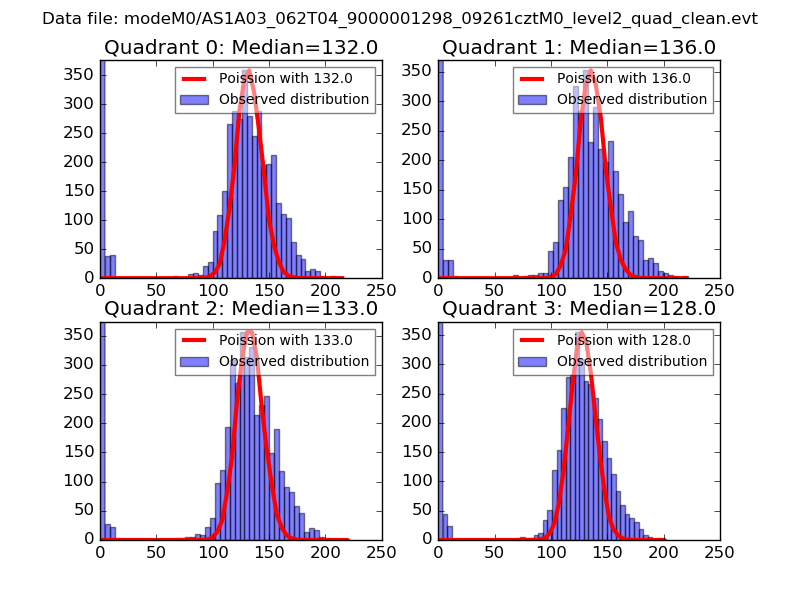 |
 |
| Quadrant-wise count rates Data is divided into 100 sec bins |
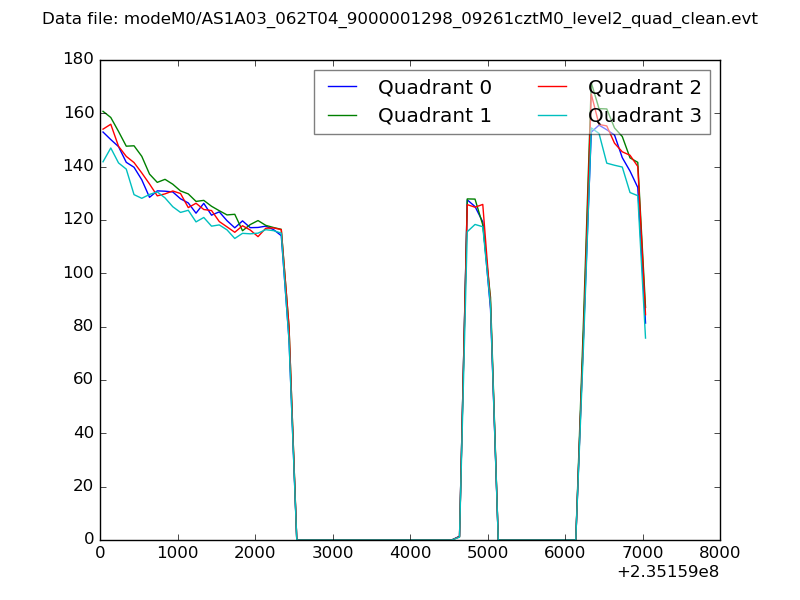 |
|
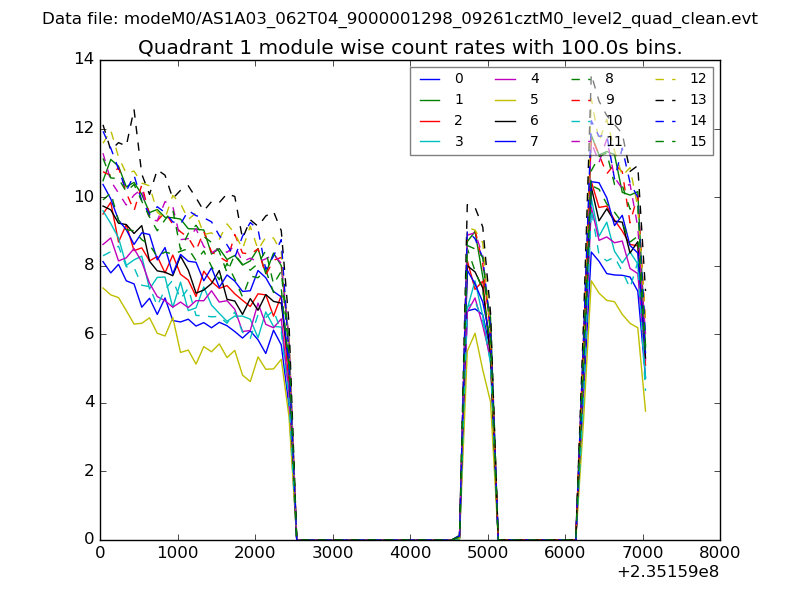
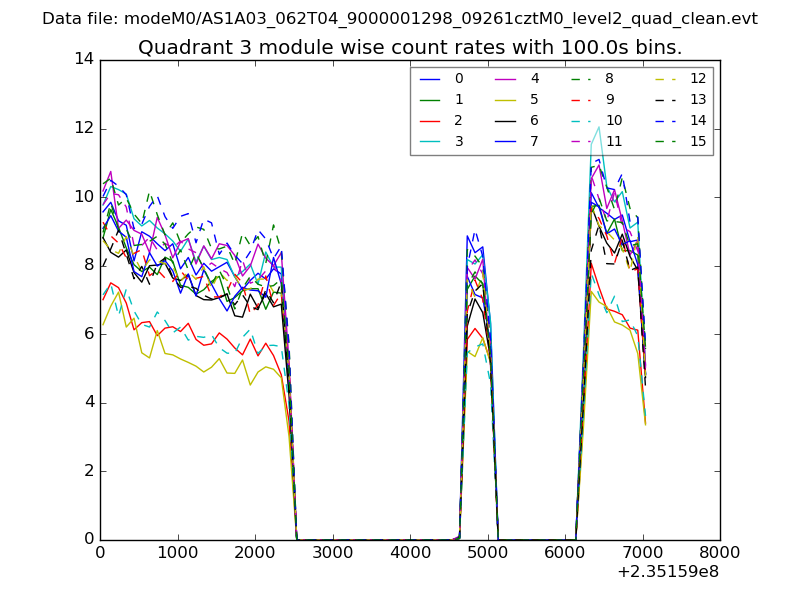
| Module-wise count rates for Quadrant A Data is divided into 100 sec bins |
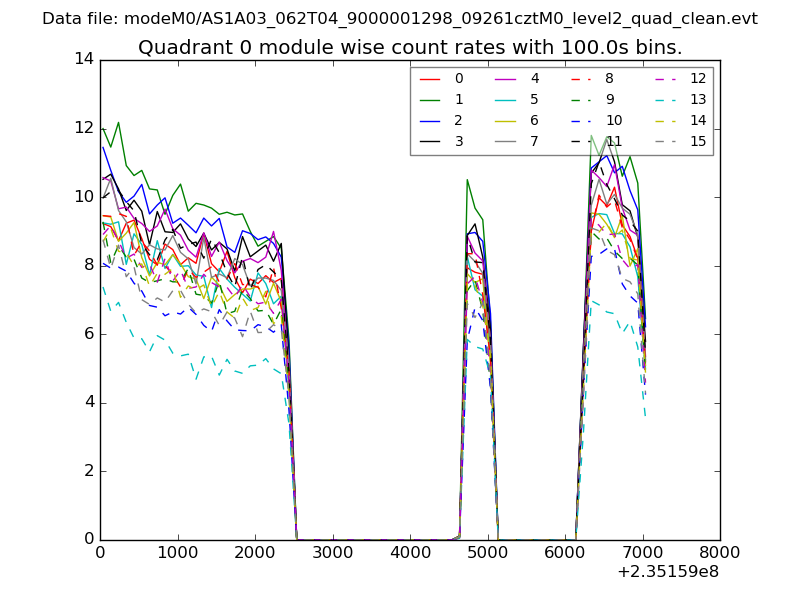 |
 |
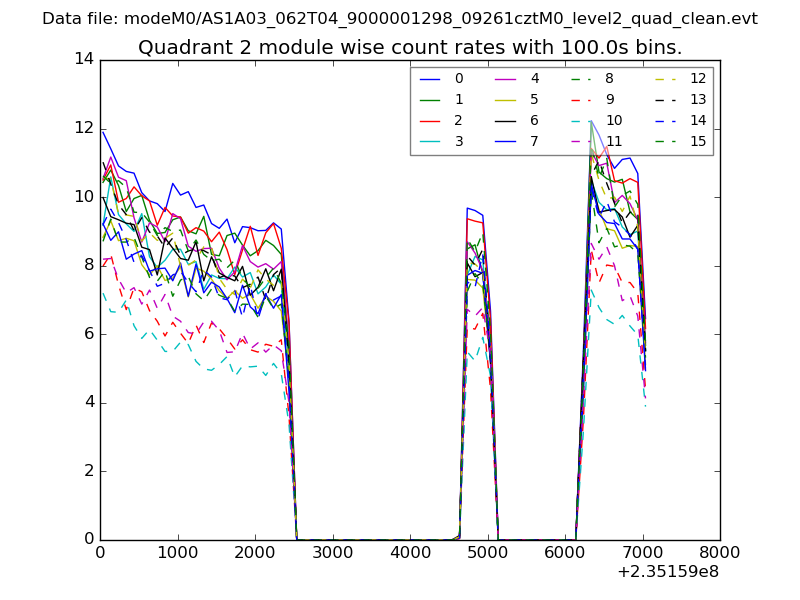
| Module-wise count rates for Quadrant B Data is divided into 100 sec bins |
 |
 |
| Module-wise count rates for Quadrant C Data is divided into 100 sec bins |
 |
 |
| Module-wise count rates for Quadrant D Data is divided into 100 sec bins |
 |
 |
| Parameter | Plot |
|---|---|
| CZT HV Monitor | 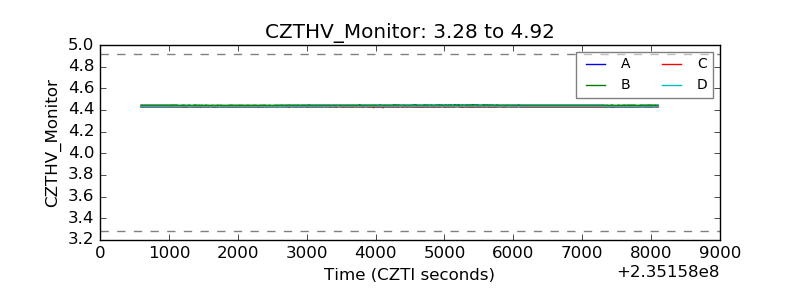 |
| D_VDD | 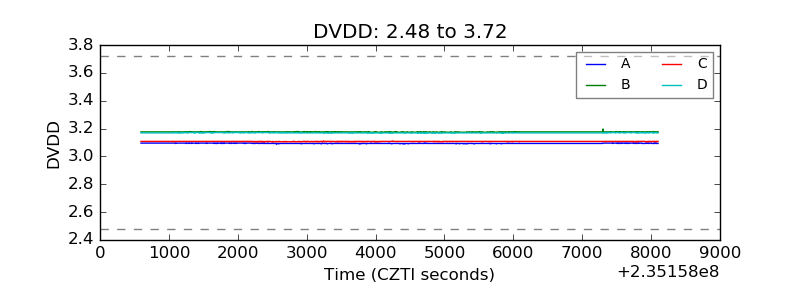 |
| Temperature 1 | 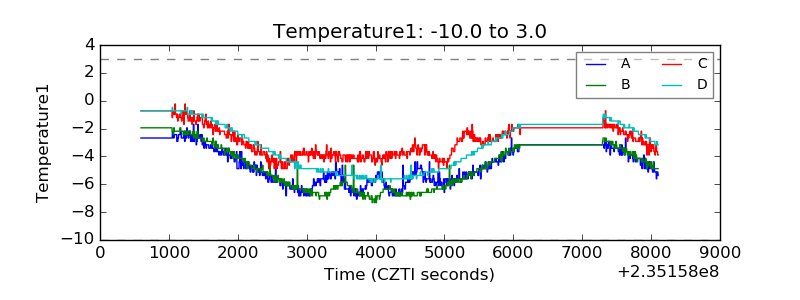 |
| Veto HV Monitor | 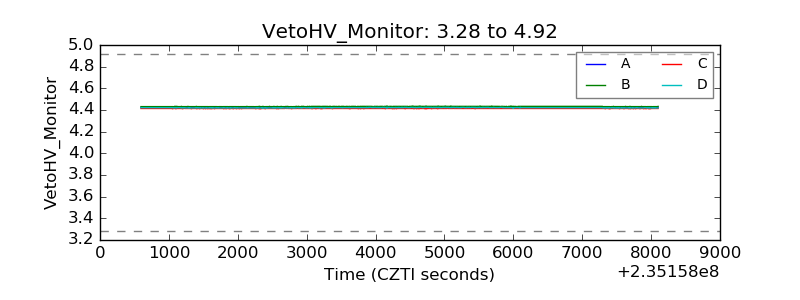 |
| Veto LLD | 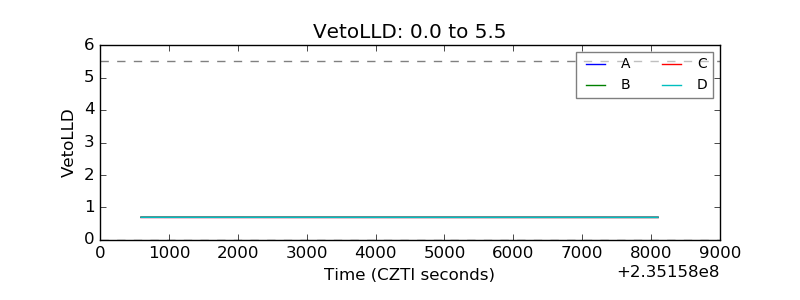 |
| Alpha Counter | 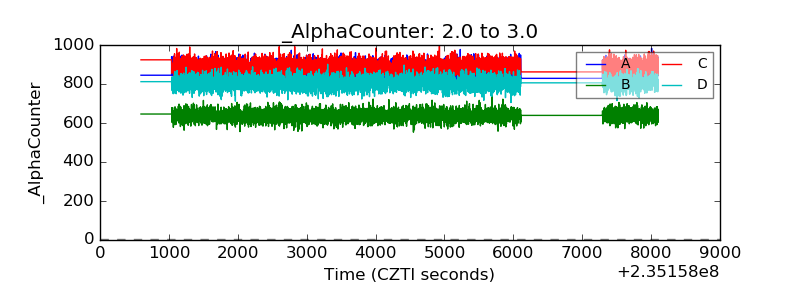 |
| _CPM_Rate | 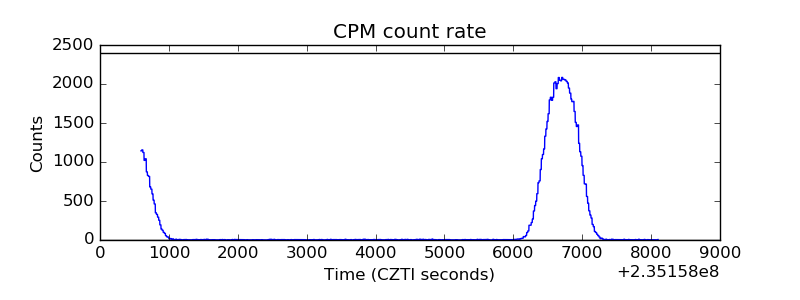 |
| CZT Counter | 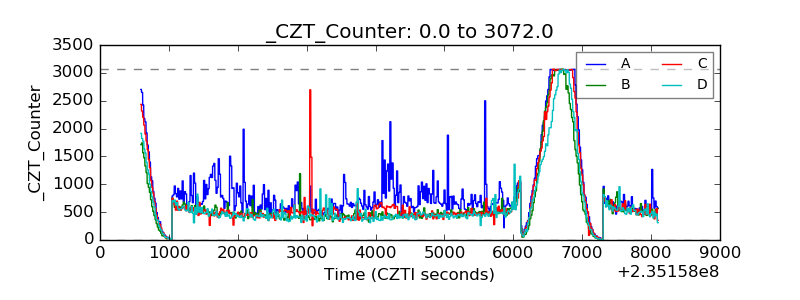 |
| +2.5 Volts monitor | 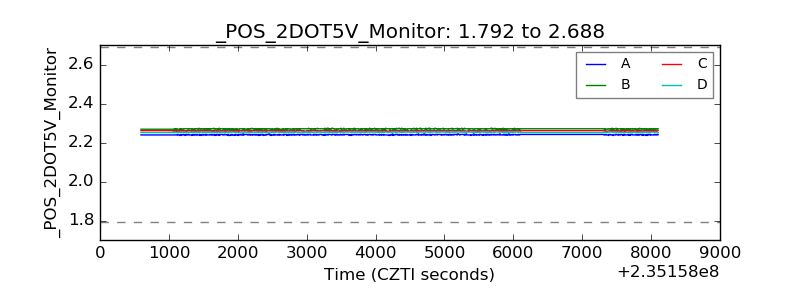 |
| +5 Volts monitor | 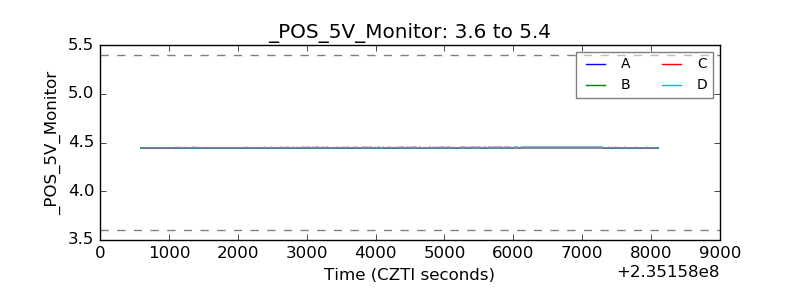 |
| _ROLL_ROT | 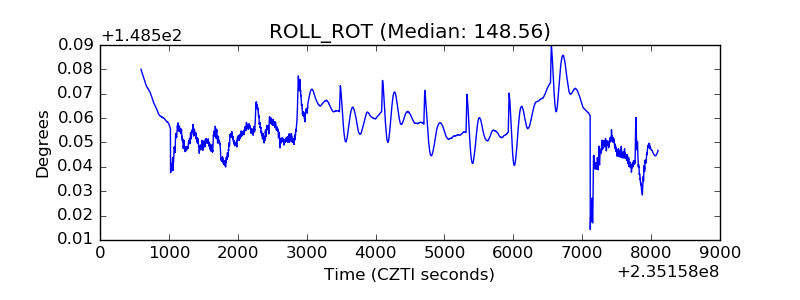 |
| _Roll_DEC | 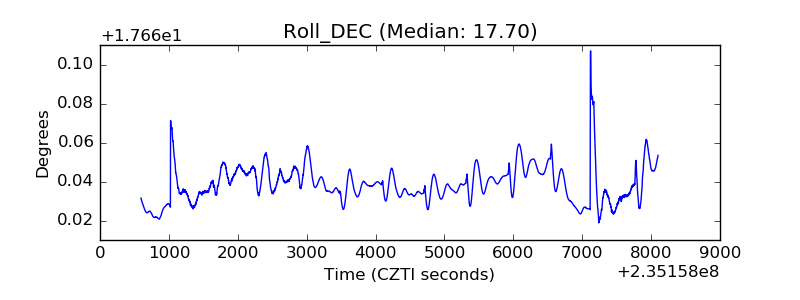 |
| _Roll_RA | 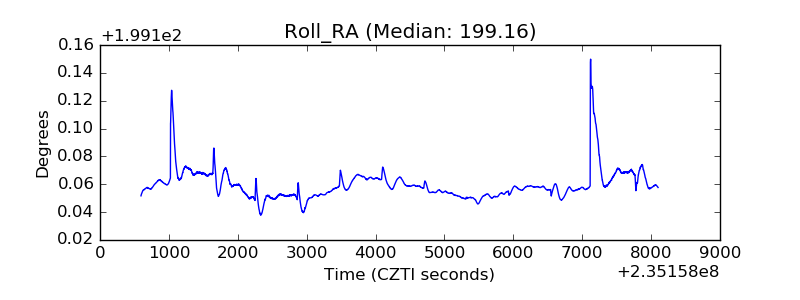 |
| Veto Counter | 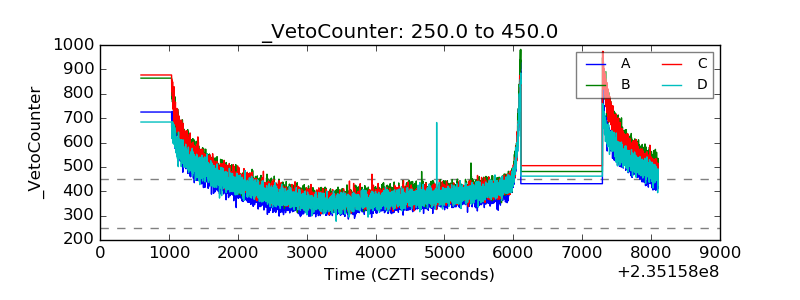 |