| Param | Original file | Final file |
|---|---|---|
| Filename | modeM0/AS1A03_062T04_9000001298_09265cztM0_level2.evt | modeM0/AS1A03_062T04_9000001298_09265cztM0_level2_quad_clean.evt |
| Size (bytes) | 63,328,320 | 18,492,480 |
| Size | 60.4 MB | 17.6 MB |
| Events in quadrant A | 521,086 | 124,296 |
| Events in quadrant B | 464,218 | 129,120 |
| Events in quadrant C | 438,715 | 124,826 |
| Events in quadrant D | 435,750 | 117,359 |
| Mode M0 | |||
|---|---|---|---|
| Quadrant | BADHDUFLAG | Total packets | Discarded packets |
| A | 0 | 2128 | 0 |
| B | 0 | 1882 | 0 |
| C | 0 | 1785 | 0 |
| D | 0 | 1790 | 0 |
| Mode SS | |||
|---|---|---|---|
| Quadrant | BADHDUFLAG | Total packets | Discarded packets |
| A | 0 | 16 | 0 |
| B | 0 | 16 | 0 |
| C | 0 | 16 | 0 |
| D | 0 | 16 | 0 |
| Mode M9 | |||
|---|---|---|---|
| Quadrant | BADHDUFLAG | Total packets | Discarded packets |
| A | 0 | 3 | 0 |
| B | 0 | 3 | 0 |
| C | 0 | 3 | 0 |
| D | 0 | 4 | 0 |
| Quadrant | Total seconds | Saturated seconds | Saturation percentage |
|---|---|---|---|
| A | 809 | 5 | 0.618047% |
| B | 809 | 5 | 0.618047% |
| C | 809 | 3 | 0.370828% |
| D | 809 | 3 | 0.370828% |
Noise dominated data is calculated using 1-second bins in cleaned event files. If a bin has >2000 counts, and if more than 50% of those come from <1% of pixels, then it is considered to be noise-dominated and hence unusable.
| Quadrant | # 1 sec bins | Bins with >0 counts | Bins with >2000 counts | High rate bins dominated by noise | Noise dominated (total time) | Noise dominated (detector-on time) | Marked lightcurve |
|---|---|---|---|---|---|---|---|
| A | 809 | 809 | 0 | 0 | 0.00% | 0.00% | 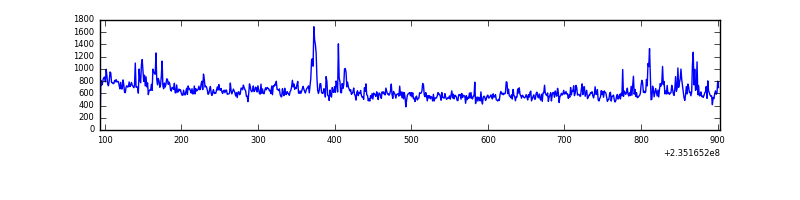 |
| B | 809 | 809 | 0 | 0 | 0.00% | 0.00% | 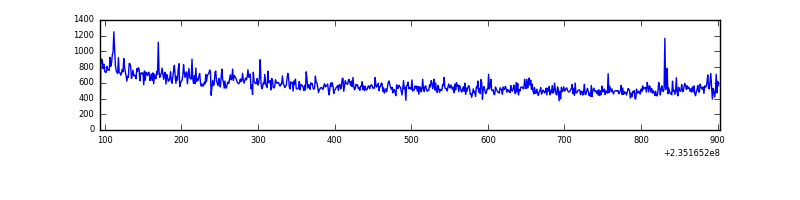 |
| C | 809 | 809 | 0 | 0 | 0.00% | 0.00% | 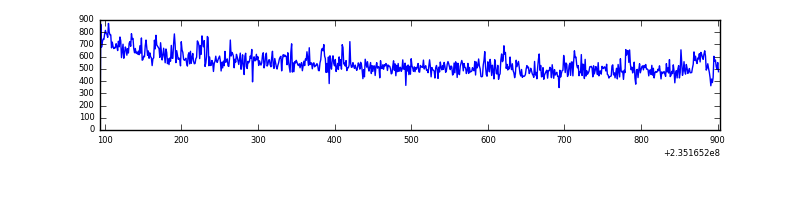 |
| D | 809 | 809 | 0 | 0 | 0.00% | 0.00% | 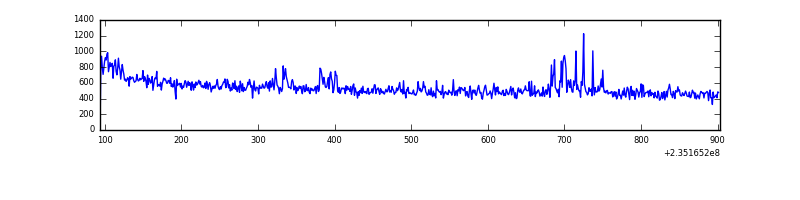 |
Top three noisy pixels from each quadrant. If the there are fewer than three noisy pixels in the level2.evt file, extra rows are filled as -1
| Pixel properties | Quadrant properties | ||||||
|---|---|---|---|---|---|---|---|
| Quadrant | DetID | PixID | Counts | Sigma | Mean | Median | Sigma |
| A | 8 | 5 | 64112 | 2599.94 | 110 | 108 | 24.6 |
| A | 13 | 251 | 23079 | 933.12 | 110 | 108 | 24.6 |
| A | 1 | 162 | 4853 | 192.75 | 110 | 108 | 24.6 |
| B | 4 | 173 | 16845 | 727.1 | 112 | 110 | 23.0 |
| B | 0 | 214 | 2447 | 101.54 | 112 | 110 | 23.0 |
| B | 15 | 204 | 2405 | 99.71 | 112 | 110 | 23.0 |
| C | 9 | 68 | 10700 | 395.51 | 109 | 109 | 26.8 |
| C | 13 | 61 | 808 | 26.1 | 109 | 109 | 26.8 |
| C | 7 | 159 | 485 | 14.04 | 109 | 109 | 26.8 |
| D | 10 | 199 | 10156 | 358.89 | 108 | 105 | 28.0 |
| D | 1 | 52 | 8817 | 311.08 | 108 | 105 | 28.0 |
| D | 2 | 234 | 2644 | 90.66 | 108 | 105 | 28.0 |
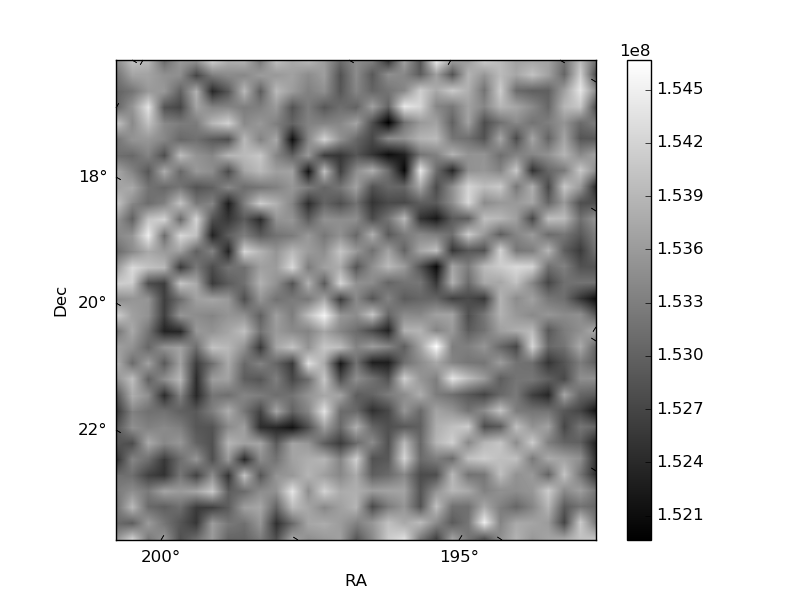
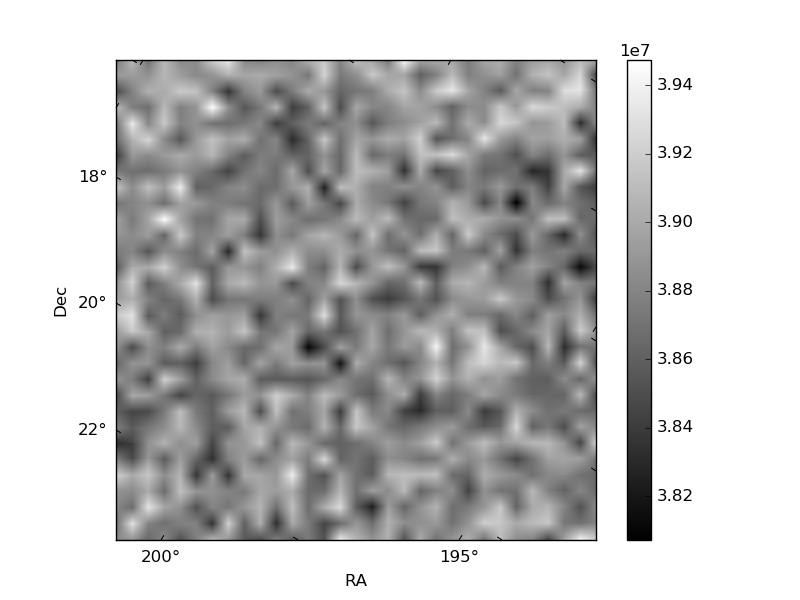
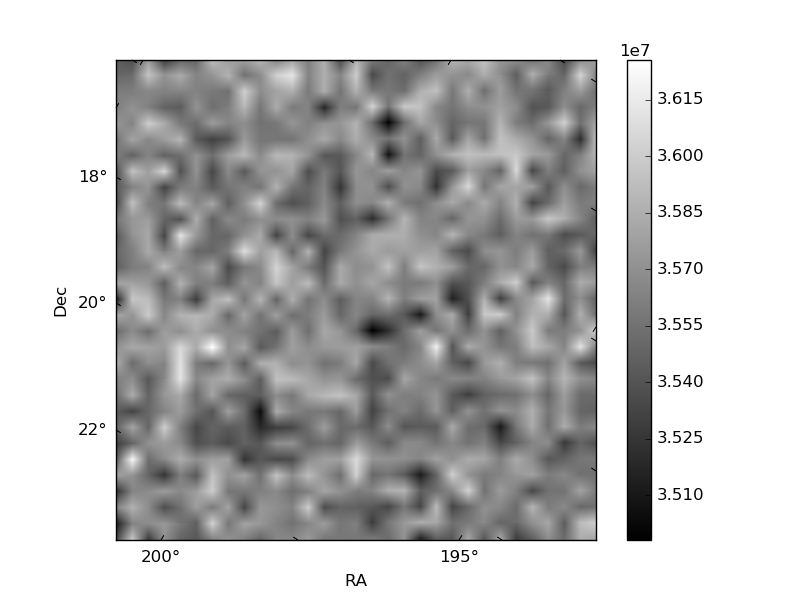
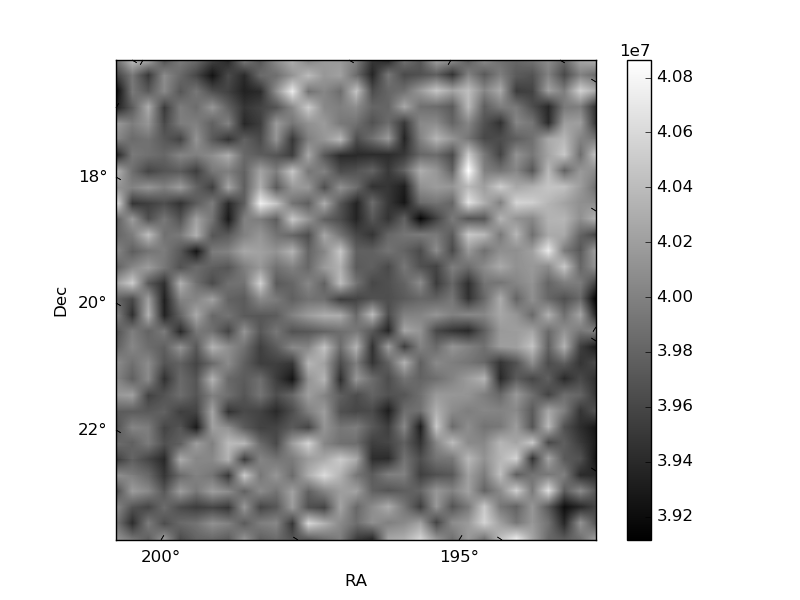
Histogram calculated using DETX and DETY for each event in the final _common_clean file
| Quadrant A | 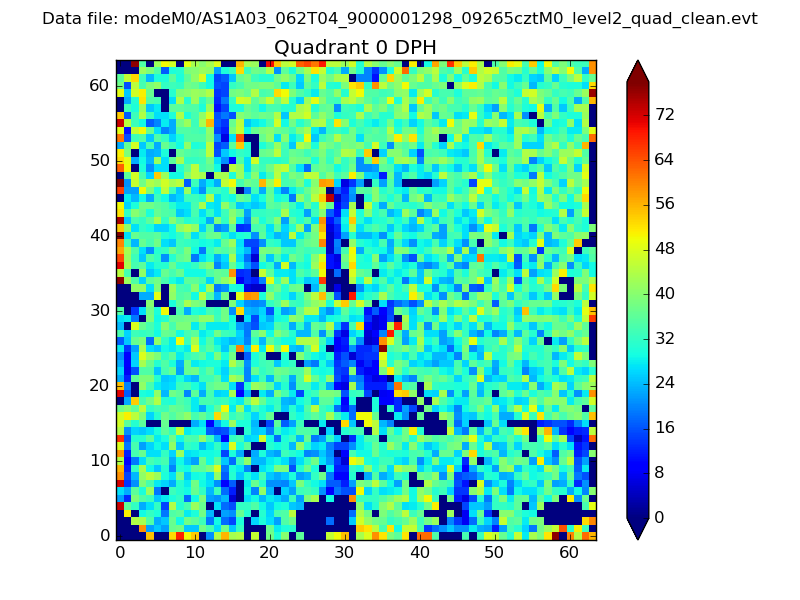 |
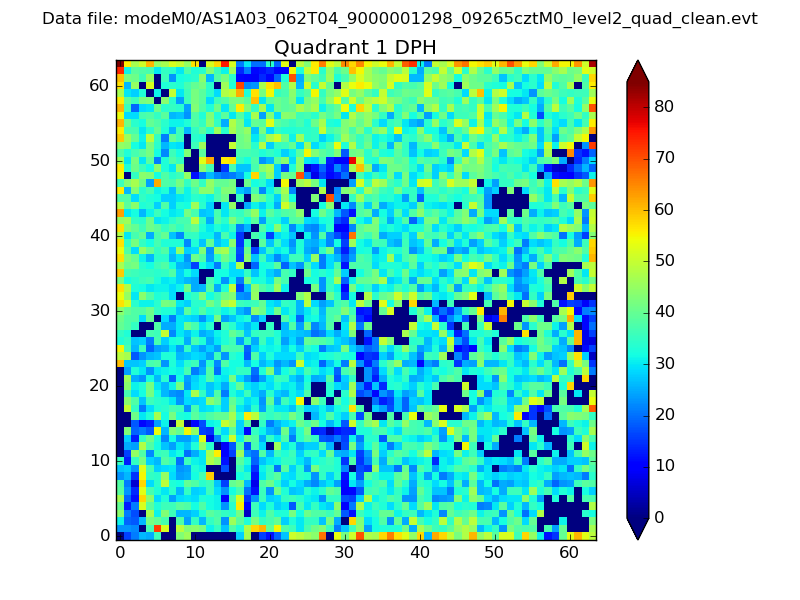 |
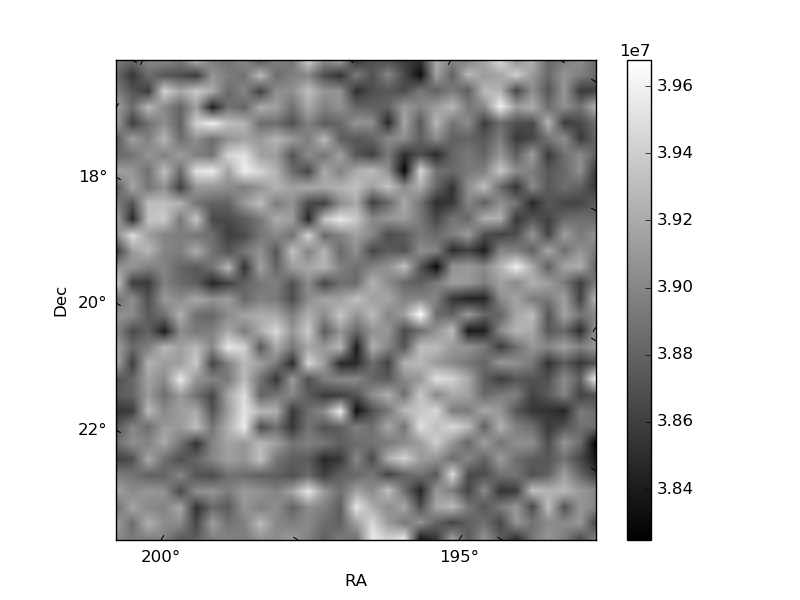
Quadrant B |
|---|---|---|---|
| Quadrant D | 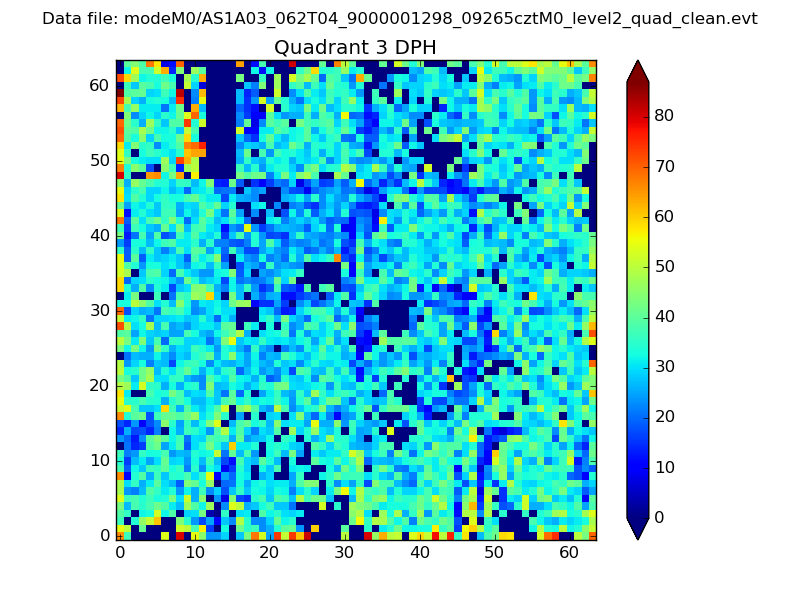 |
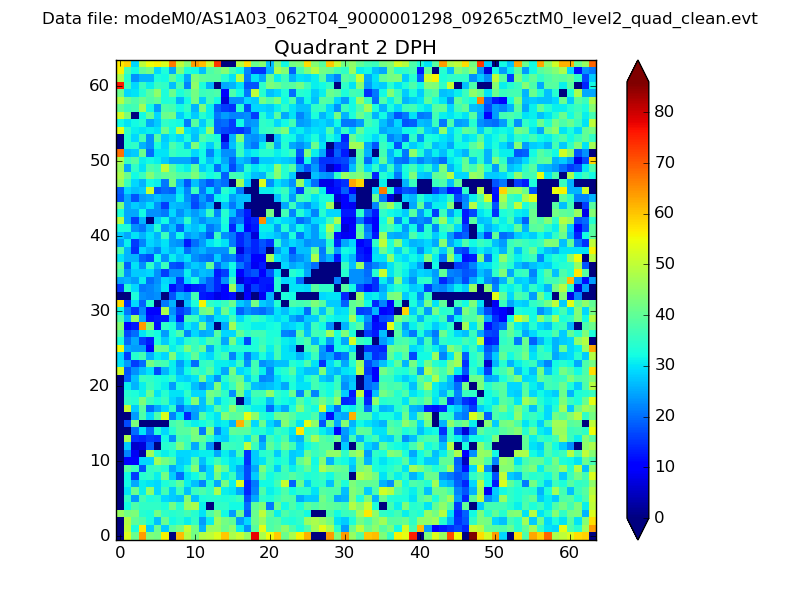 |
Quadrant C |
| Plot type | Count rate plots | Images |
|---|---|---|
| Comparison with Poisson distribution Blue bars denote a histogram of data divided into 1 sec bins. Red curve is a Poisson curve with rate = median count rate of data. |
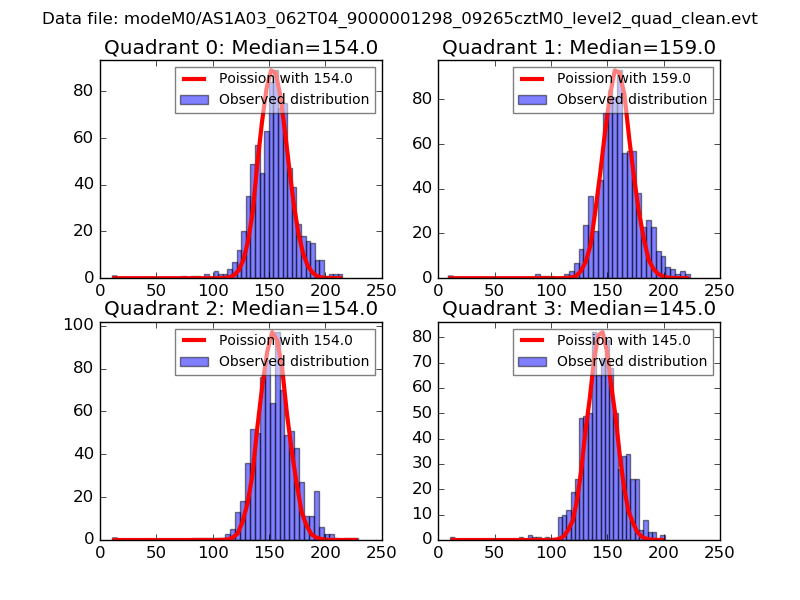 |
 |
| Quadrant-wise count rates Data is divided into 100 sec bins |
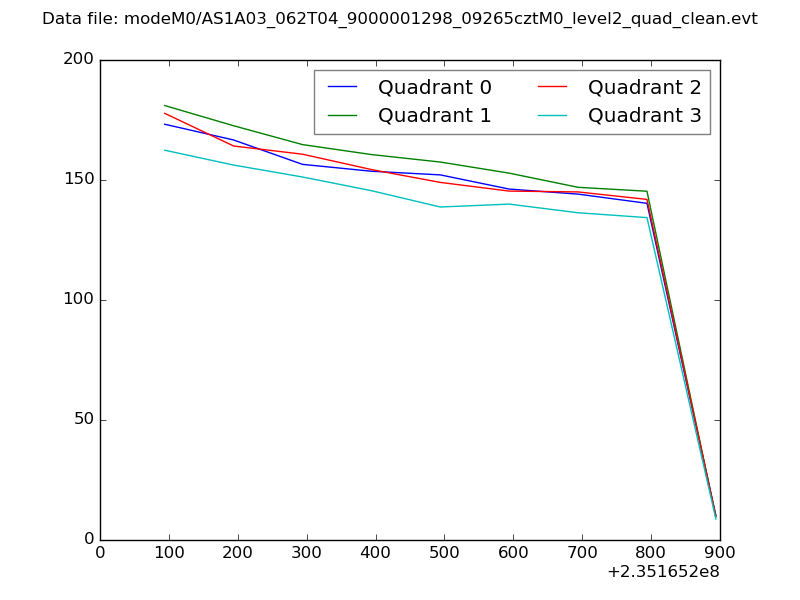 |
|
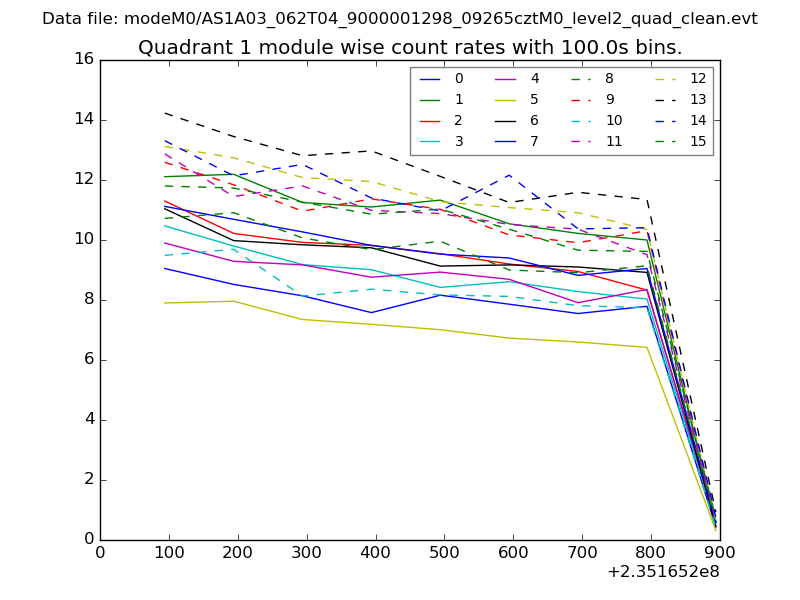
| Module-wise count rates for Quadrant A Data is divided into 100 sec bins |
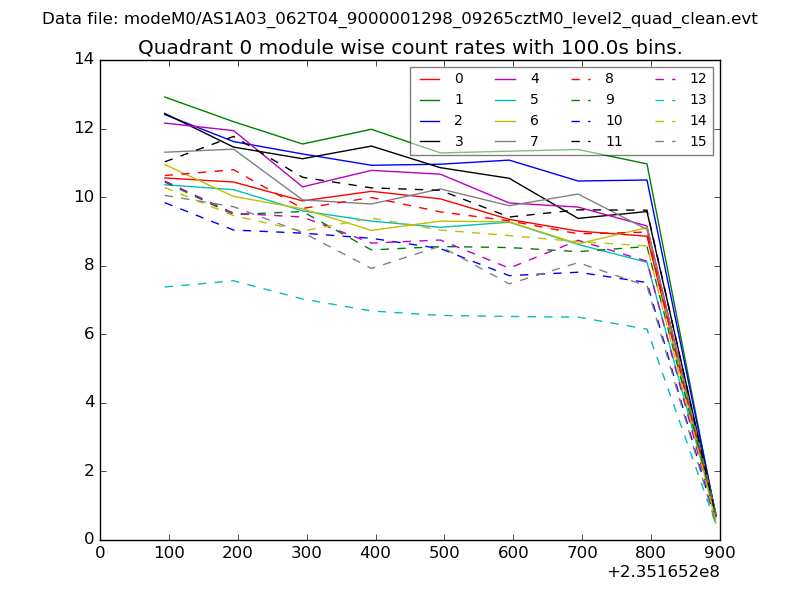 |
 |
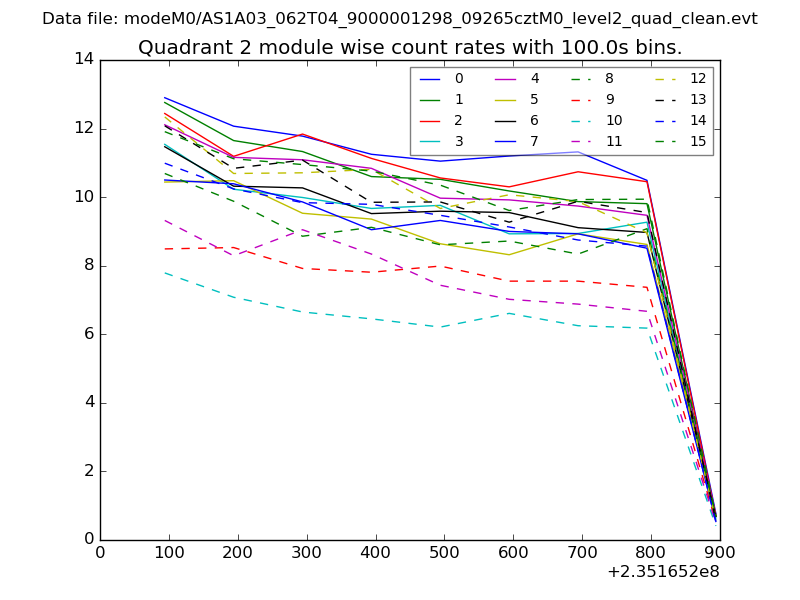
| Module-wise count rates for Quadrant B Data is divided into 100 sec bins |
 |
 |
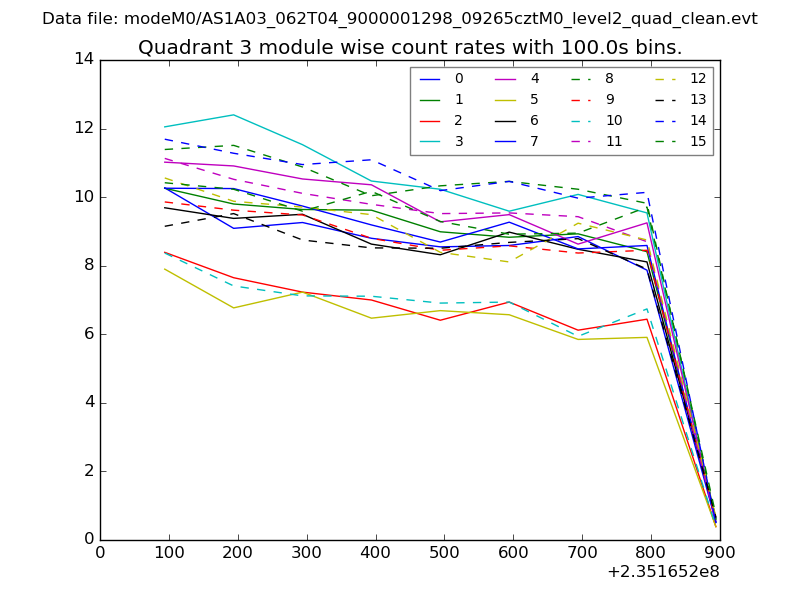
| Module-wise count rates for Quadrant C Data is divided into 100 sec bins |
 |
 |
| Module-wise count rates for Quadrant D Data is divided into 100 sec bins |
 |
 |
| Parameter | Plot |
|---|---|
| CZT HV Monitor | 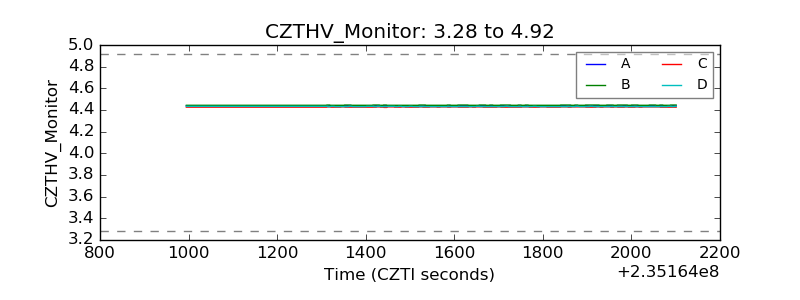 |
| D_VDD | 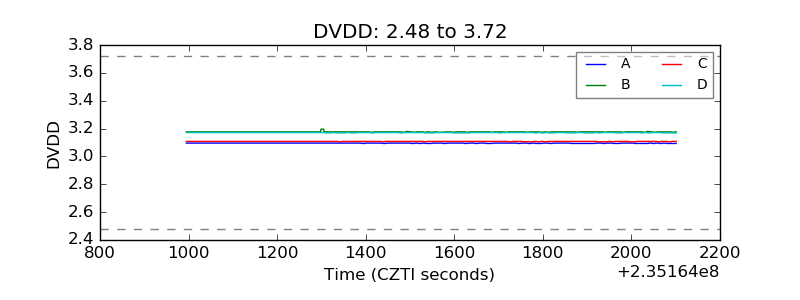 |
| Temperature 1 |  |
| Veto HV Monitor | 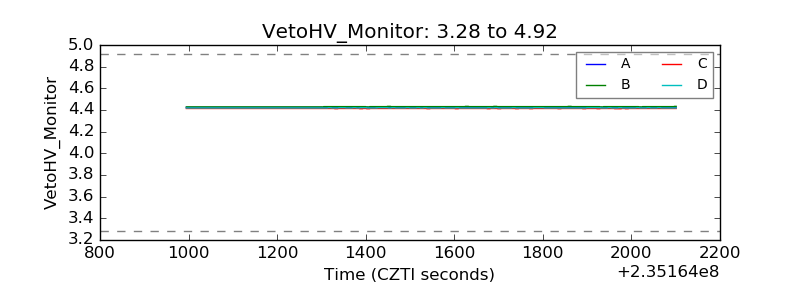 |
| Veto LLD |  |
| Alpha Counter | 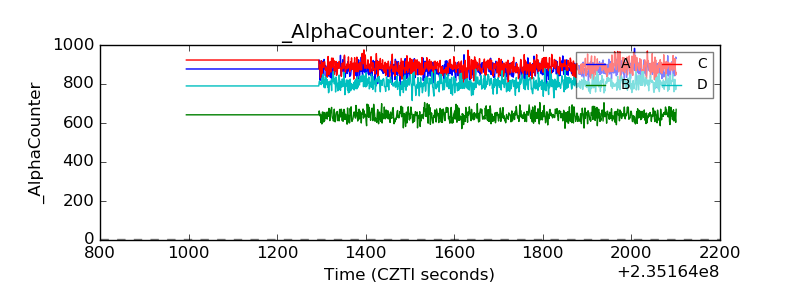 |
| _CPM_Rate | 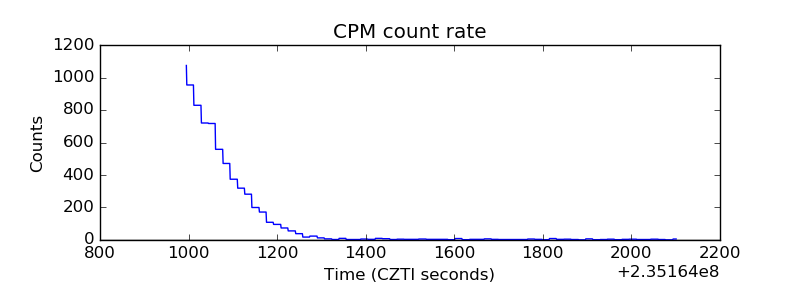 |
| CZT Counter | 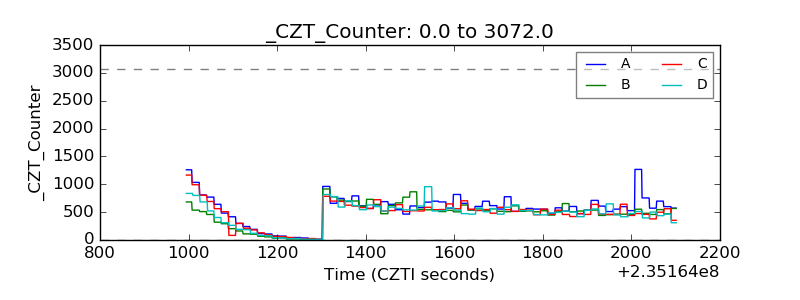 |
| +2.5 Volts monitor |  |
| +5 Volts monitor |  |
| _ROLL_ROT | 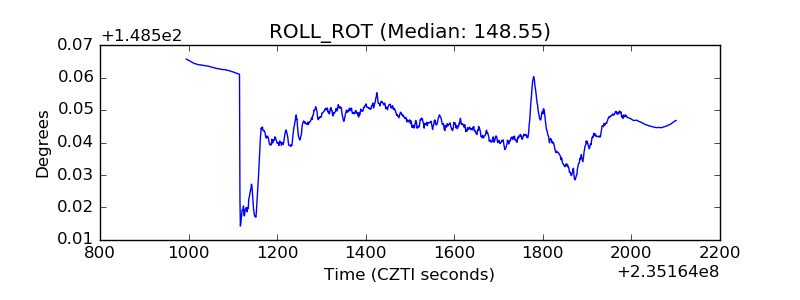 |
| _Roll_DEC |  |
| _Roll_RA | 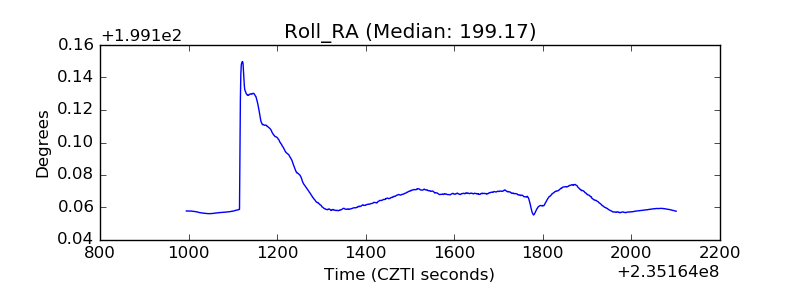 |
| Veto Counter | 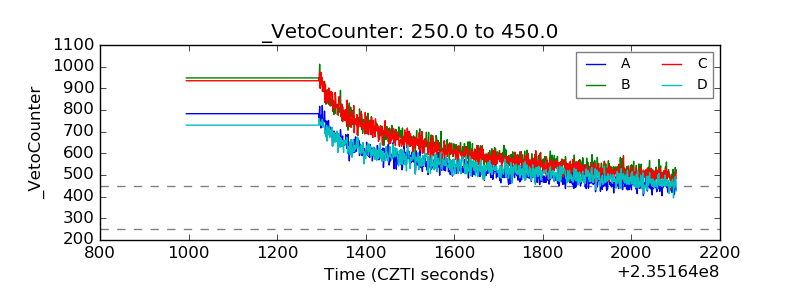 |