| Param | Original file | Final file |
|---|---|---|
| Filename | modeM0/AS1A03_091T01_9000001296cztM0_level2.fits | modeM0/AS1A03_091T01_9000001296cztM0_level2_quad_clean.evt |
| Size (bytes) | 86,987,520 | 88,205,760 |
| Size | 83.0 MB | 84.1 MB |
| Events in quadrant A | 508,204 | 522,091 |
| Events in quadrant B | 506,376 | 526,447 |
| Events in quadrant C | 515,114 | 499,326 |
| Events in quadrant D | 444,766 | 463,120 |
| Mode M0 | |||
|---|---|---|---|
| Quadrant | BADHDUFLAG | Total packets | Discarded packets |
| A | 0 | 24418 | 0 |
| B | 0 | 19528 | 0 |
| C | 0 | 19573 | 0 |
| D | 0 | 20471 | 0 |
| Mode M9 | |||
|---|---|---|---|
| Quadrant | BADHDUFLAG | Total packets | Discarded packets |
| A | 0 | 11 | 0 |
| B | 0 | 11 | 0 |
| C | 0 | 10 | 0 |
| D | 0 | 10 | 0 |
| Mode SS | |||
|---|---|---|---|
| Quadrant | BADHDUFLAG | Total packets | Discarded packets |
| A | 0 | 190 | 0 |
| B | 0 | 196 | 0 |
| C | 0 | 194 | 0 |
| D | 0 | 194 | 0 |
| Quadrant | Total seconds | Saturated seconds | Saturation percentage |
|---|---|---|---|
| A | 9483 | 252 | 2.657387% |
| B | 9529 | 140 | 1.469199% |
| C | 9542 | 107 | 1.121358% |
| D | 9511 | 147 | 1.545579% |
Noise dominated data is calculated using 1-second bins in cleaned event files. If a bin has >2000 counts, and if more than 50% of those come from <1% of pixels, then it is considered to be noise-dominated and hence unusable.
| Quadrant | # 1 sec bins | Bins with >0 counts | Bins with >2000 counts | High rate bins dominated by noise | Noise dominated (total time) | Noise dominated (detector-on time) | Marked lightcurve |
|---|---|---|---|---|---|---|---|
| A | 10768 | 9645 | 0 | 0 | 0.00% | 0.00% |  |
| B | 10769 | 9656 | 0 | 0 | 0.00% | 0.00% | 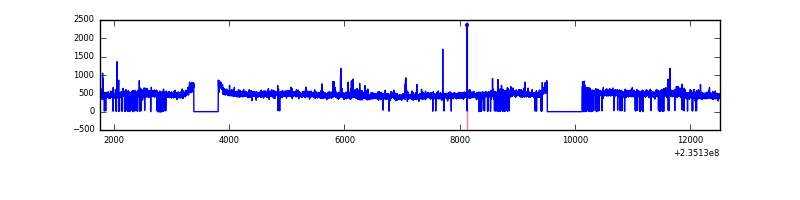 |
| C | 10769 | 9645 | 0 | 0 | 0.00% | 0.00% | 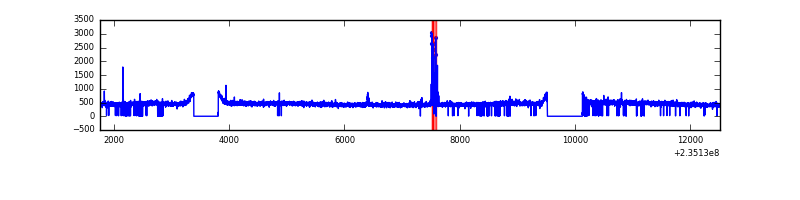 |
| D | 10769 | 9648 | 0 | 0 | 0.00% | 0.00% |  |
Top three noisy pixels from each quadrant. If the there are fewer than three noisy pixels in the level2.evt file, extra rows are filled as -1
| Pixel properties | Quadrant properties | ||||||
|---|---|---|---|---|---|---|---|
| Quadrant | DetID | PixID | Counts | Sigma | Mean | Median | Sigma |
| A | 0 | 29 | 491 | 10.21 | 132 | 123 | 36.1 |
| A | 7 | 110 | 431 | 8.54 | 132 | 123 | 36.1 |
| A | 15 | 236 | 377 | 7.05 | 132 | 123 | 36.1 |
| B | 2 | 9 | 430 | 10.32 | 133 | 126 | 29.4 |
| B | 12 | 226 | 361 | 7.98 | 133 | 126 | 29.4 |
| B | 5 | 232 | 345 | 7.44 | 133 | 126 | 29.4 |
| C | 1 | 80 | 420 | 7.91 | 135 | 125 | 37.3 |
| C | 1 | 81 | 414 | 7.75 | 135 | 125 | 37.3 |
| C | 12 | 241 | 369 | 6.54 | 135 | 125 | 37.3 |
| D | 3 | 14 | 343 | 6.36 | 126 | 114 | 36.0 |
| D | 3 | 31 | 330 | 5.99 | 126 | 114 | 36.0 |
| D | 6 | 231 | 328 | 5.94 | 126 | 114 | 36.0 |
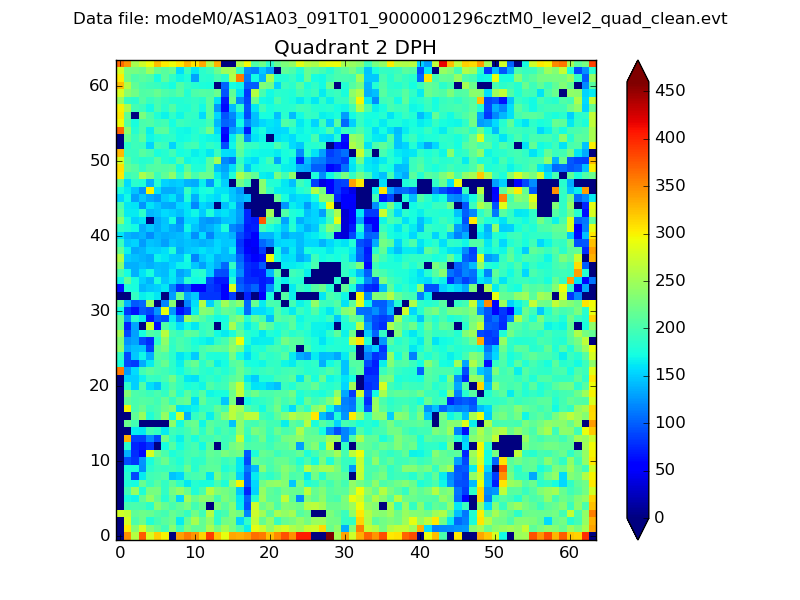
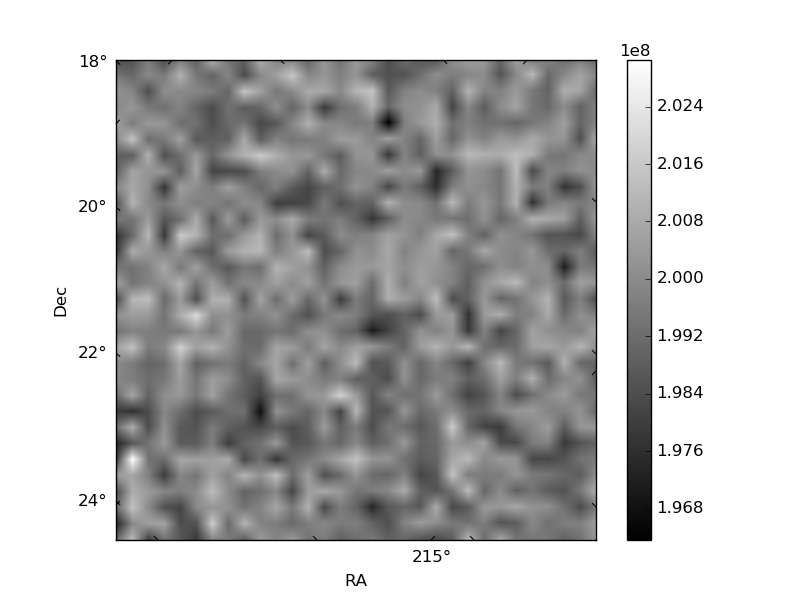
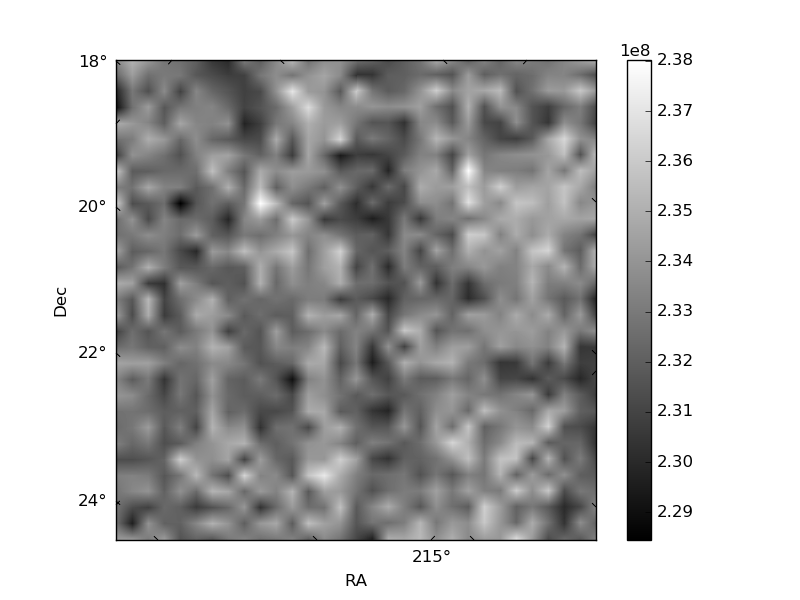
Histogram calculated using DETX and DETY for each event in the final _common_clean file
| Quadrant A | 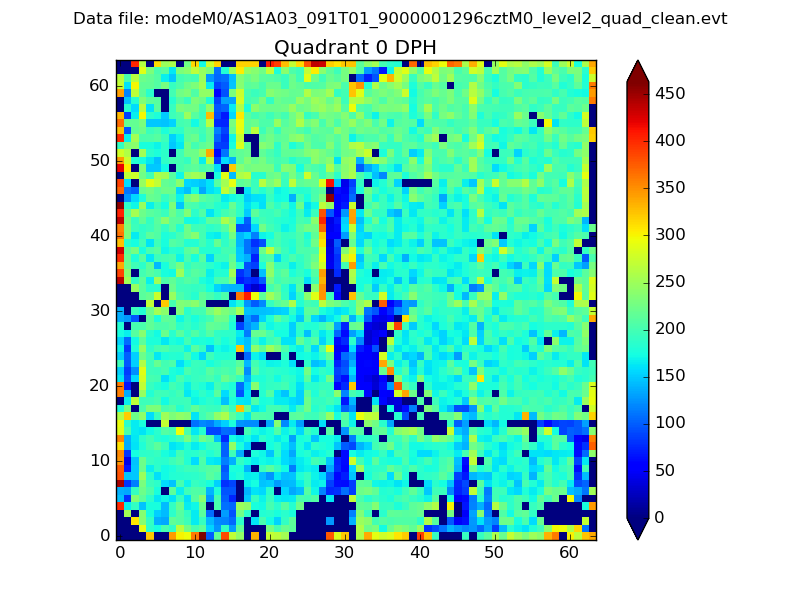 |
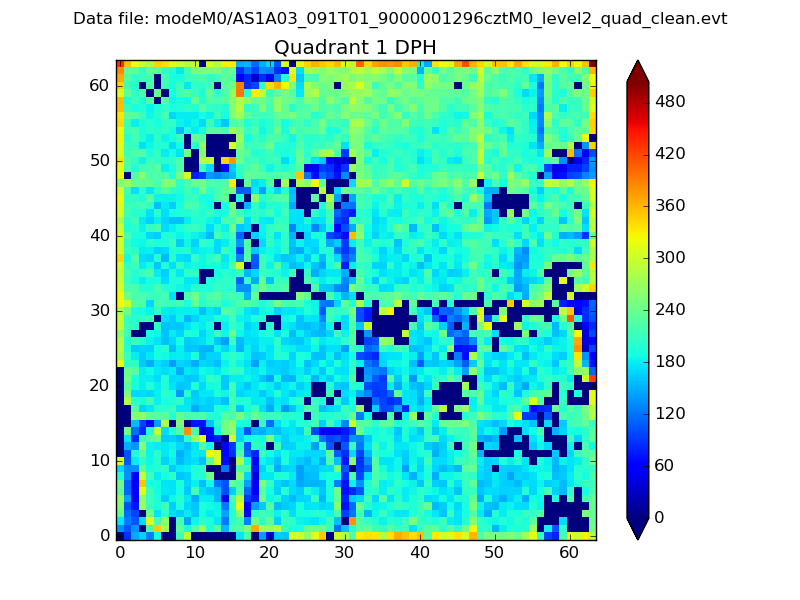 |
Quadrant B |
|---|---|---|---|
| Quadrant D | 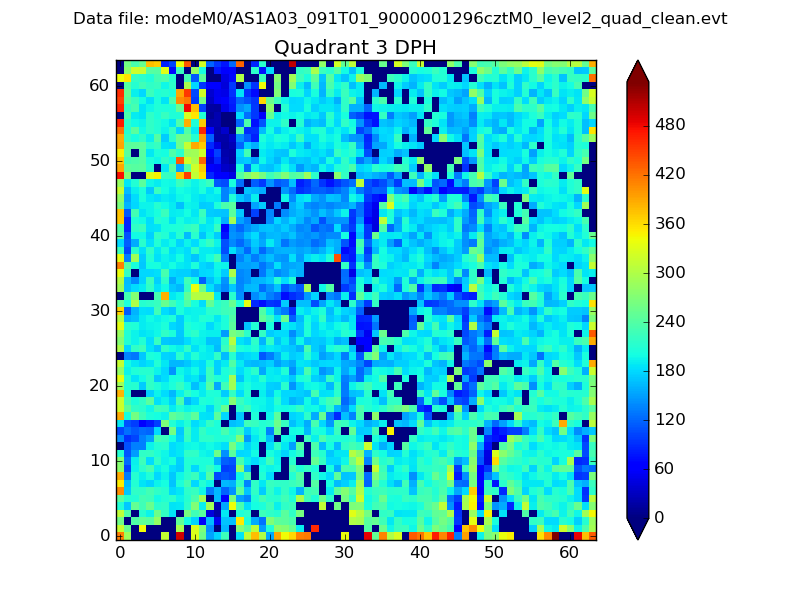 |
 |
Quadrant C |
| Plot type | Count rate plots | Images |
|---|---|---|
| Comparison with Poisson distribution Blue bars denote a histogram of data divided into 1 sec bins. Red curve is a Poisson curve with rate = median count rate of data. |
 |
 |
| Quadrant-wise count rates Data is divided into 100 sec bins |
 |
|
| Module-wise count rates for Quadrant A Data is divided into 100 sec bins |
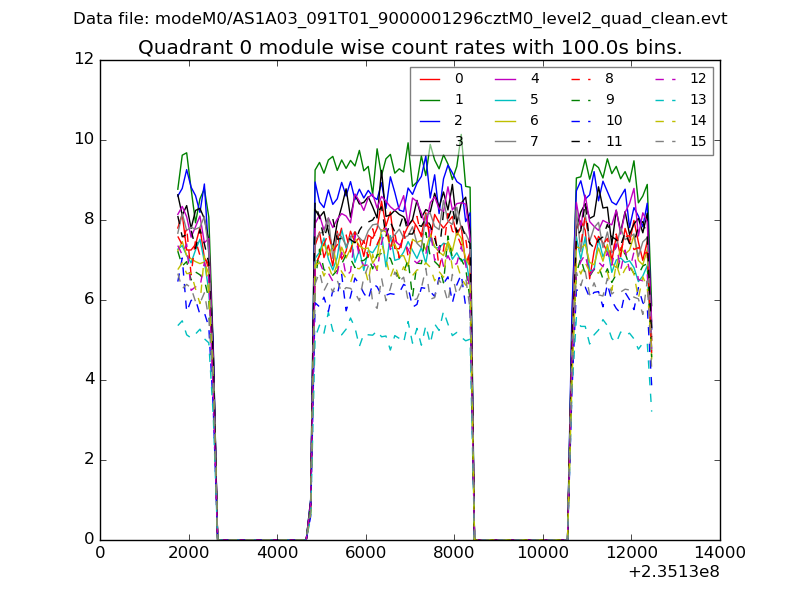 |
 |
| Module-wise count rates for Quadrant B Data is divided into 100 sec bins |
 |
 |
| Module-wise count rates for Quadrant C Data is divided into 100 sec bins |
 |
 |
| Module-wise count rates for Quadrant D Data is divided into 100 sec bins |
 |
 |
| Parameter | Plot |
|---|---|
| CZT HV Monitor | 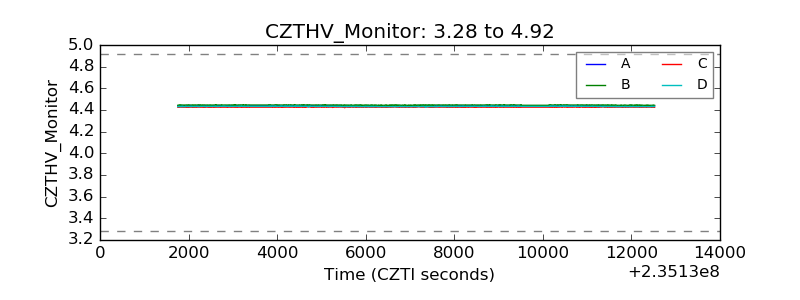 |
| D_VDD |  |
| Temperature 1 |  |
| Veto HV Monitor |  |
| Veto LLD |  |
| Alpha Counter |  |
| _CPM_Rate | 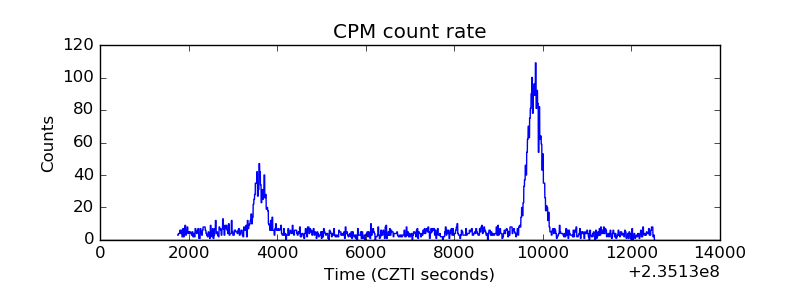 |
| CZT Counter |  |
| +2.5 Volts monitor |  |
| +5 Volts monitor |  |
| _ROLL_ROT |  |
| _Roll_DEC |  |
| _Roll_RA |  |
| Veto Counter | 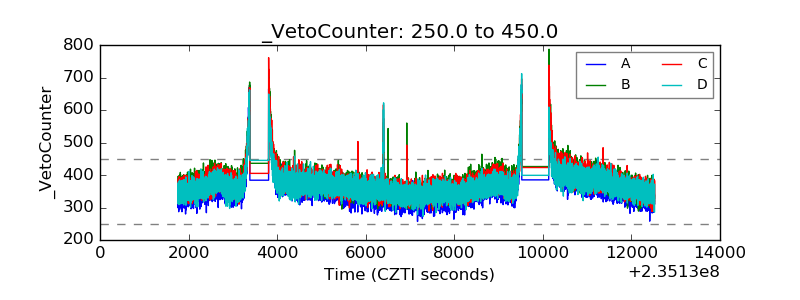 |