| Param | Original file | Final file |
|---|---|---|
| Filename | modeM0/AS1A03_091T01_9000001296_09258cztM0_level2.evt | modeM0/AS1A03_091T01_9000001296_09258cztM0_level2_quad_clean.evt |
| Size (bytes) | 689,578,560 | 121,104,000 |
| Size | 657.6 MB | 115.5 MB |
| Events in quadrant A | 6,329,536 | 749,653 |
| Events in quadrant B | 4,612,377 | 762,989 |
| Events in quadrant C | 4,484,210 | 748,765 |
| Events in quadrant D | 4,798,320 | 731,761 |
| Mode M0 | |||
|---|---|---|---|
| Quadrant | BADHDUFLAG | Total packets | Discarded packets |
| A | 0 | 25164 | 2 |
| B | 0 | 19956 | 2 |
| C | 0 | 19986 | 2 |
| D | 0 | 20973 | 2 |
| Mode M9 | |||
|---|---|---|---|
| Quadrant | BADHDUFLAG | Total packets | Discarded packets |
| A | 0 | 11 | 0 |
| B | 0 | 11 | 0 |
| C | 0 | 11 | 0 |
| D | 0 | 11 | 0 |
| Mode SS | |||
|---|---|---|---|
| Quadrant | BADHDUFLAG | Total packets | Discarded packets |
| A | 0 | 198 | 0 |
| B | 0 | 198 | 0 |
| C | 0 | 198 | 0 |
| D | 0 | 198 | 0 |
| Quadrant | Total seconds | Saturated seconds | Saturation percentage |
|---|---|---|---|
| A | 9734 | 267 | 2.742963% |
| B | 9734 | 141 | 1.448531% |
| C | 9734 | 109 | 1.119786% |
| D | 9734 | 152 | 1.561537% |
Noise dominated data is calculated using 1-second bins in cleaned event files. If a bin has >2000 counts, and if more than 50% of those come from <1% of pixels, then it is considered to be noise-dominated and hence unusable.
| Quadrant | # 1 sec bins | Bins with >0 counts | Bins with >2000 counts | High rate bins dominated by noise | Noise dominated (total time) | Noise dominated (detector-on time) | Marked lightcurve |
|---|---|---|---|---|---|---|---|
| A | 10769 | 9736 | 62 | 62 | 0.58% | 0.64% | 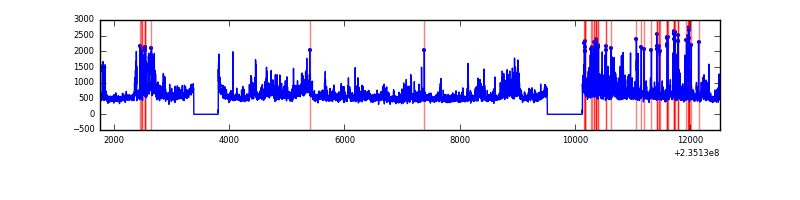 |
| B | 10769 | 9736 | 1 | 1 | 0.01% | 0.01% | 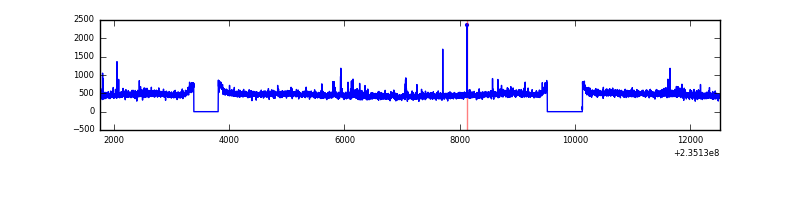 |
| C | 10769 | 9736 | 14 | 14 | 0.13% | 0.14% | 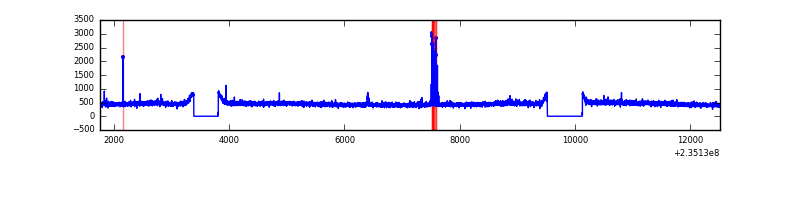 |
| D | 10769 | 9736 | 47 | 47 | 0.44% | 0.48% | 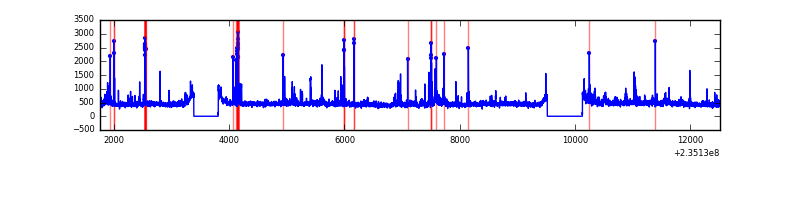 |
Top three noisy pixels from each quadrant. If the there are fewer than three noisy pixels in the level2.evt file, extra rows are filled as -1
| Pixel properties | Quadrant properties | ||||||
|---|---|---|---|---|---|---|---|
| Quadrant | DetID | PixID | Counts | Sigma | Mean | Median | Sigma |
| A | 8 | 5 | 1782502 | 7604.87 | 1151 | 1124 | 234.2 |
| A | 1 | 162 | 49228 | 205.36 | 1151 | 1124 | 234.2 |
| A | 15 | 174 | 23432 | 95.23 | 1151 | 1124 | 234.2 |
| B | 0 | 187 | 25927 | 111.33 | 1163 | 1135 | 222.7 |
| B | 0 | 214 | 25681 | 110.23 | 1163 | 1135 | 222.7 |
| B | 12 | 111 | 25559 | 109.68 | 1163 | 1135 | 222.7 |
| C | 14 | 234 | 71941 | 270.8 | 1128 | 1132 | 261.5 |
| C | 14 | 67 | 9391 | 31.58 | 1128 | 1132 | 261.5 |
| C | 13 | 61 | 8459 | 28.02 | 1128 | 1132 | 261.5 |
| D | 1 | 52 | 238448 | 849.57 | 1120 | 1090 | 279.4 |
| D | 2 | 136 | 157164 | 558.63 | 1120 | 1090 | 279.4 |
| D | 7 | 71 | 60577 | 212.92 | 1120 | 1090 | 279.4 |
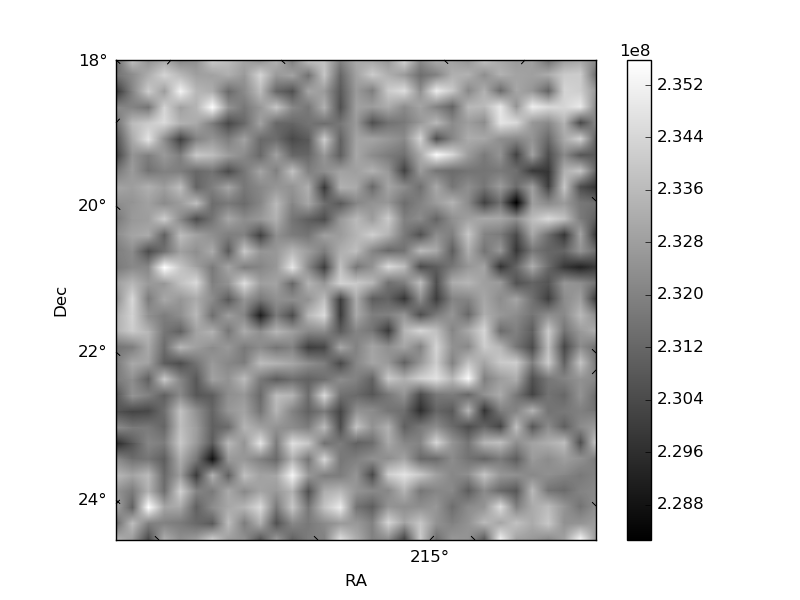
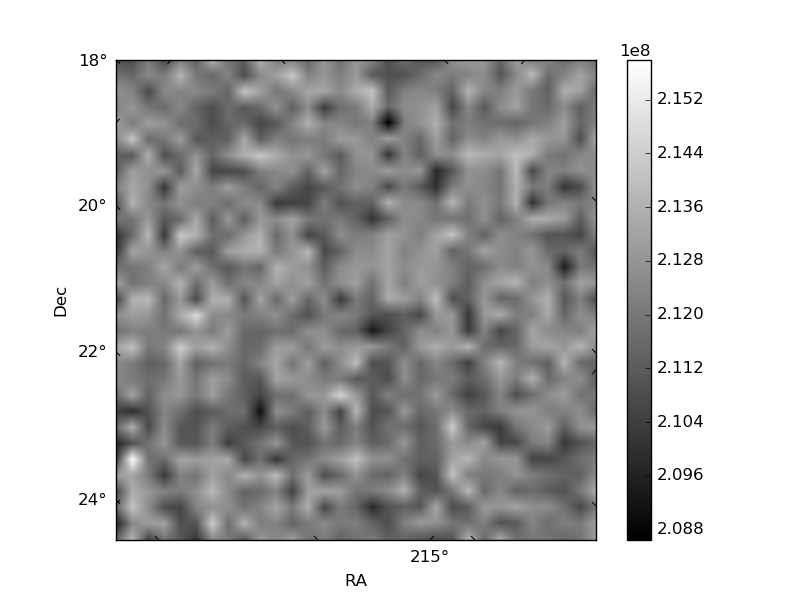
Histogram calculated using DETX and DETY for each event in the final _common_clean file
| Quadrant A | 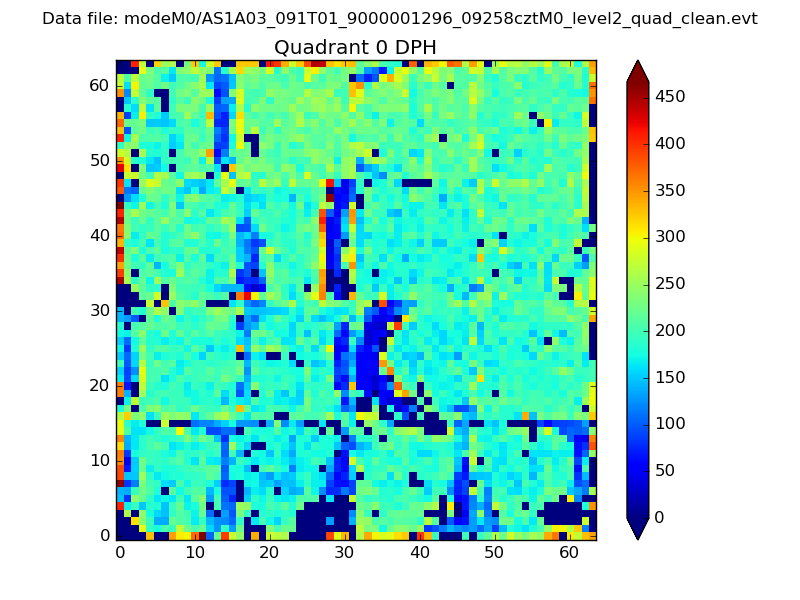 |
 |
Quadrant B |
|---|---|---|---|
| Quadrant D |  |
 |
Quadrant C |
| Plot type | Count rate plots | Images |
|---|---|---|
| Comparison with Poisson distribution Blue bars denote a histogram of data divided into 1 sec bins. Red curve is a Poisson curve with rate = median count rate of data. |
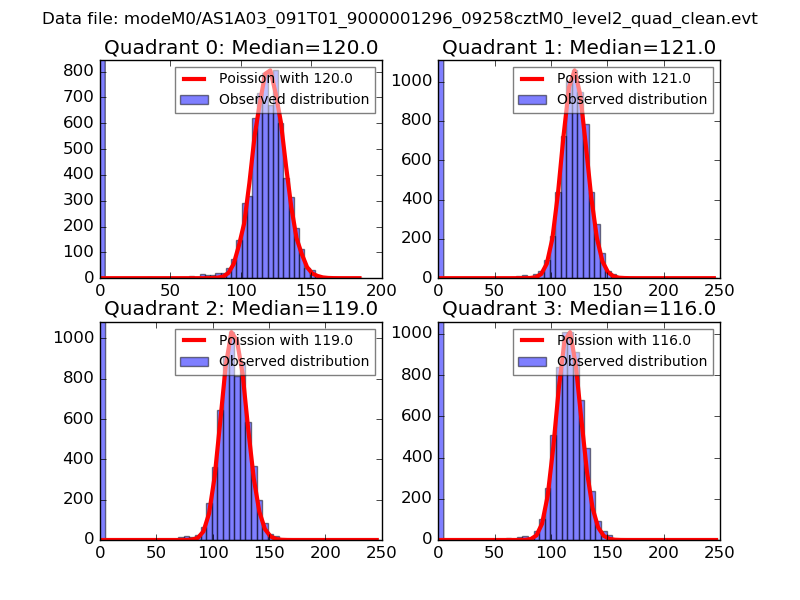 |
 |
| Quadrant-wise count rates Data is divided into 100 sec bins |
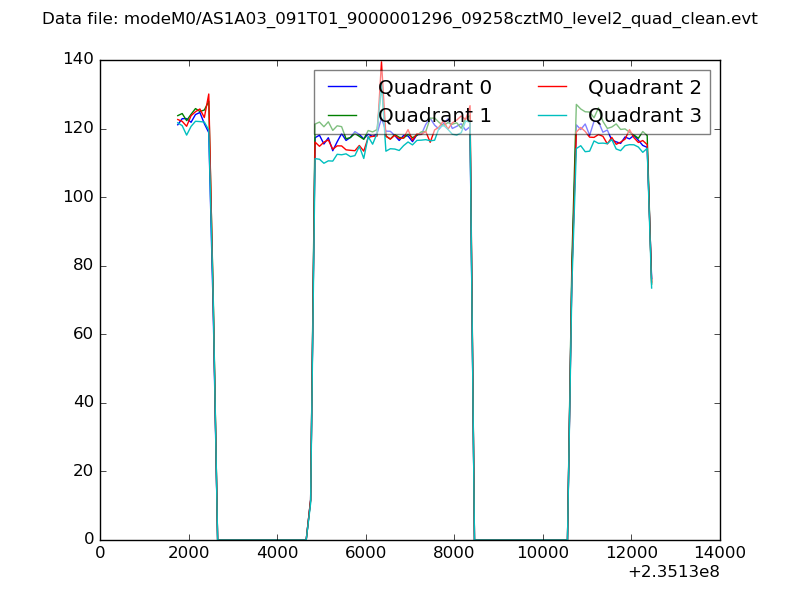 |
|
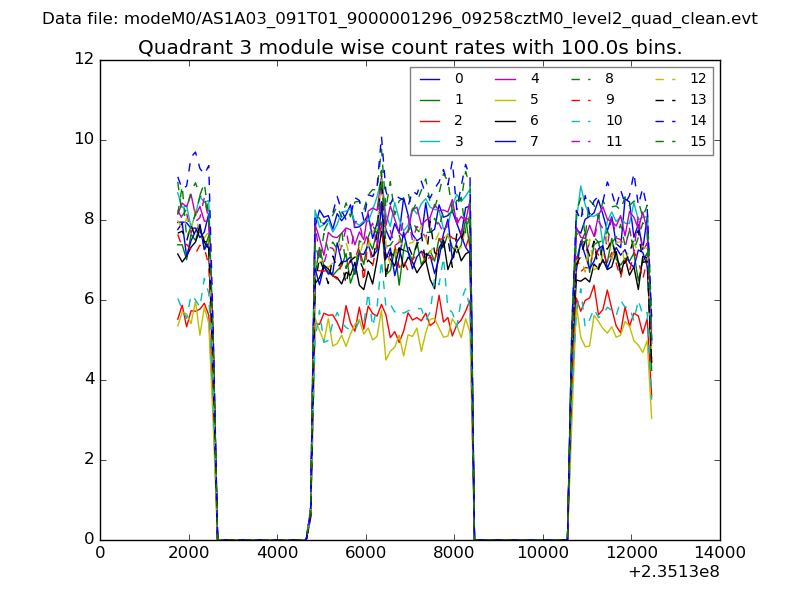
| Module-wise count rates for Quadrant A Data is divided into 100 sec bins |
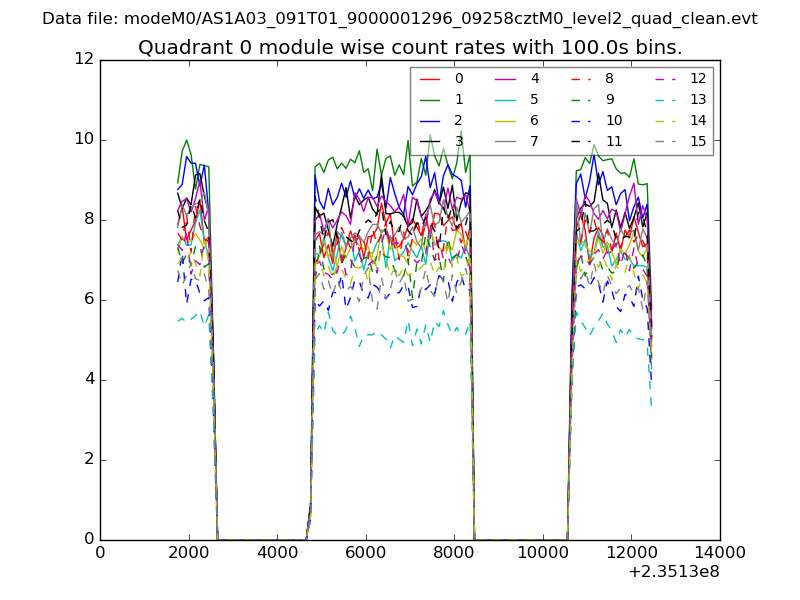 |
 |
| Module-wise count rates for Quadrant B Data is divided into 100 sec bins |
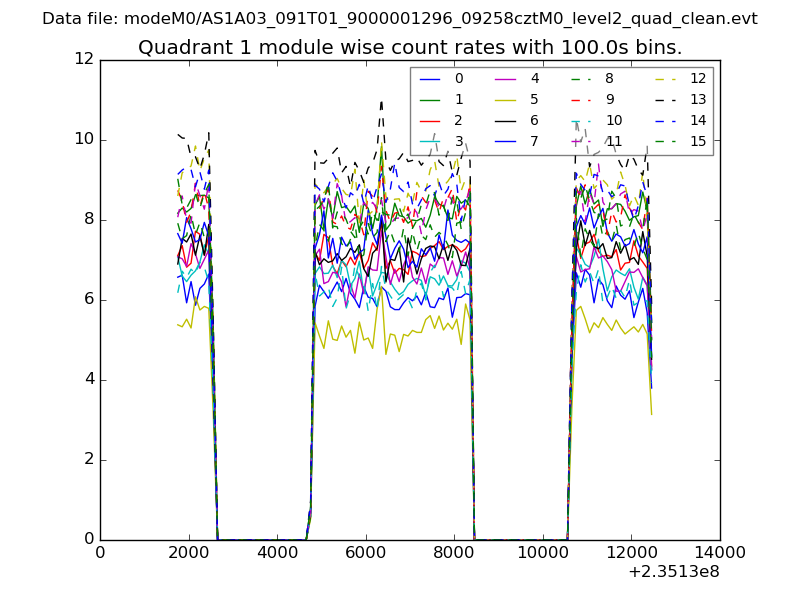 |
 |
| Module-wise count rates for Quadrant C Data is divided into 100 sec bins |
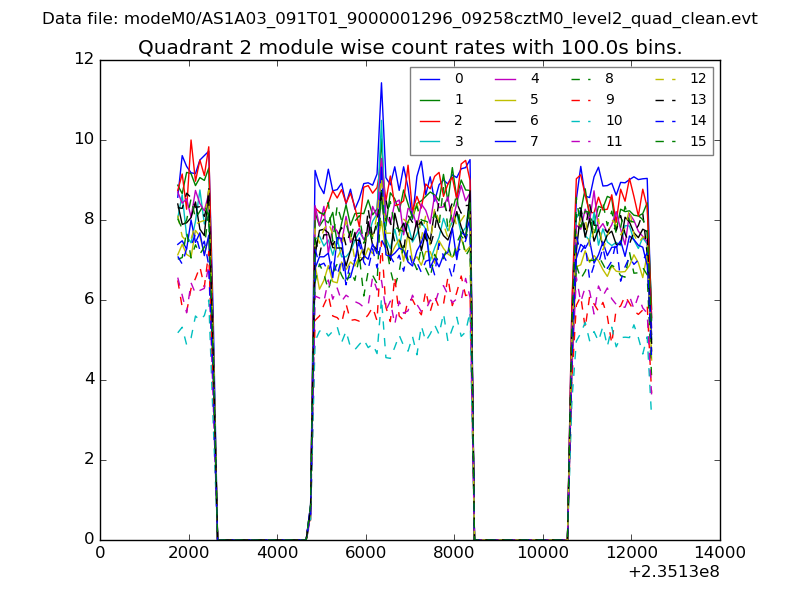 |
 |
| Module-wise count rates for Quadrant D Data is divided into 100 sec bins |
 |
 |
| Parameter | Plot |
|---|---|
| CZT HV Monitor | 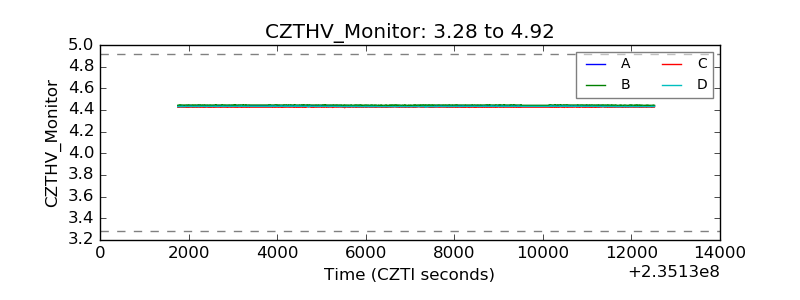 |
| D_VDD | 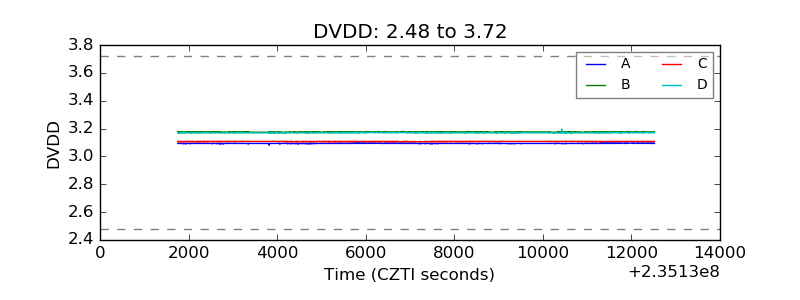 |
| Temperature 1 | 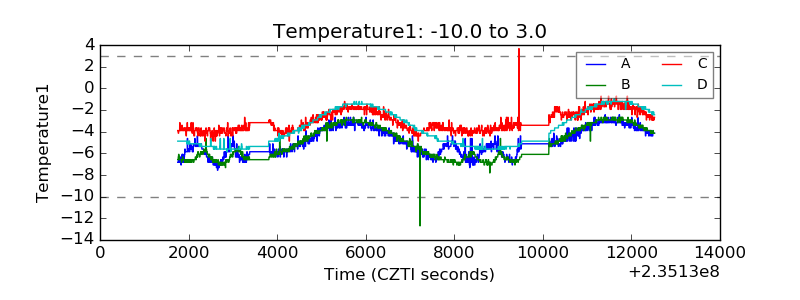 |
| Veto HV Monitor | 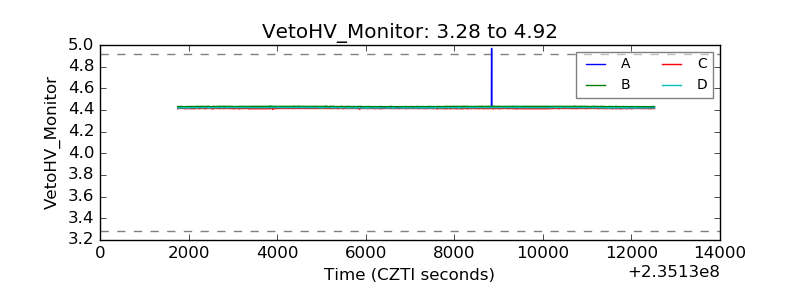 |
| Veto LLD | 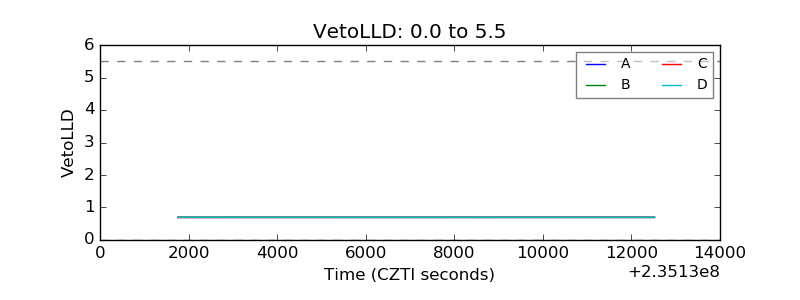 |
| Alpha Counter | 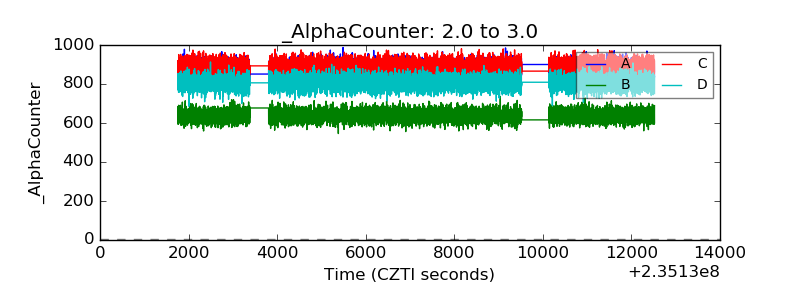 |
| _CPM_Rate | 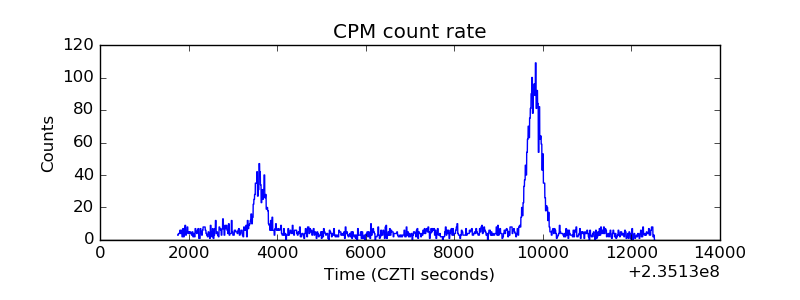 |
| CZT Counter | 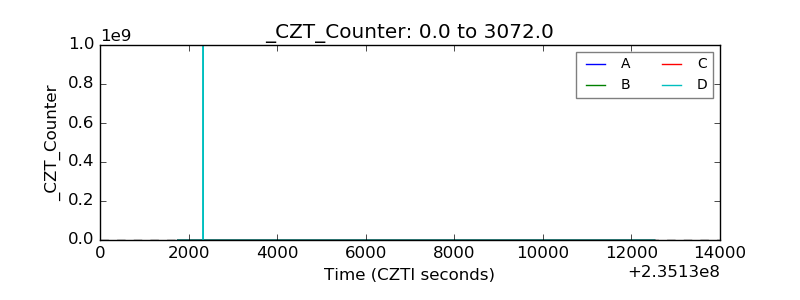 |
| +2.5 Volts monitor |  |
| +5 Volts monitor |  |
| _ROLL_ROT |  |
| _Roll_DEC | 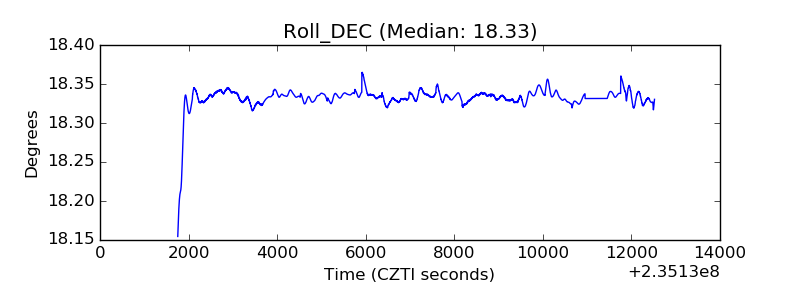 |
| _Roll_RA | 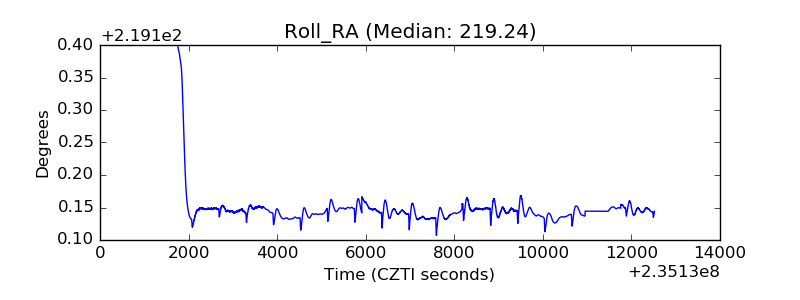 |
| Veto Counter | 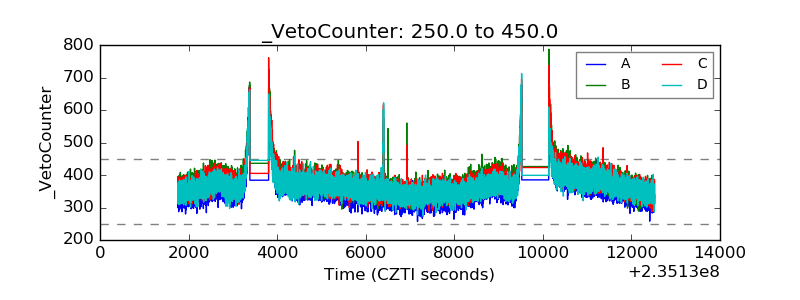 |