| Param | Original file | Final file |
|---|---|---|
| Filename | modeM0/AS1A03_091T04_9000001294cztM0_level2.fits | modeM0/AS1A03_091T04_9000001294cztM0_level2_quad_clean.evt |
| Size (bytes) | 100,468,800 | 100,825,920 |
| Size | 95.8 MB | 96.2 MB |
| Events in quadrant A | 592,436 | 596,761 |
| Events in quadrant B | 580,296 | 600,458 |
| Events in quadrant C | 592,274 | 565,267 |
| Events in quadrant D | 514,292 | 527,386 |
| Mode M0 | |||
|---|---|---|---|
| Quadrant | BADHDUFLAG | Total packets | Discarded packets |
| A | 0 | 24942 | 0 |
| B | 0 | 23235 | 0 |
| C | 0 | 22925 | 0 |
| D | 0 | 23898 | 0 |
| Mode SS | |||
|---|---|---|---|
| Quadrant | BADHDUFLAG | Total packets | Discarded packets |
| A | 0 | 226 | 0 |
| B | 0 | 226 | 0 |
| C | 0 | 226 | 0 |
| D | 0 | 226 | 0 |
| Mode M9 | |||
|---|---|---|---|
| Quadrant | BADHDUFLAG | Total packets | Discarded packets |
| A | 0 | 4 | 0 |
| B | 0 | 4 | 0 |
| C | 0 | 4 | 0 |
| D | 0 | 4 | 0 |
| Quadrant | Total seconds | Saturated seconds | Saturation percentage |
|---|---|---|---|
| A | 11024 | 490 | 4.444848% |
| B | 11023 | 450 | 4.082373% |
| C | 11024 | 340 | 3.084180% |
| D | 11024 | 373 | 3.383527% |
Noise dominated data is calculated using 1-second bins in cleaned event files. If a bin has >2000 counts, and if more than 50% of those come from <1% of pixels, then it is considered to be noise-dominated and hence unusable.
| Quadrant | # 1 sec bins | Bins with >0 counts | Bins with >2000 counts | High rate bins dominated by noise | Noise dominated (total time) | Noise dominated (detector-on time) | Marked lightcurve |
|---|---|---|---|---|---|---|---|
| A | 11344 | 11026 | 0 | 0 | 0.00% | 0.00% |  |
| B | 11344 | 11024 | 0 | 0 | 0.00% | 0.00% | 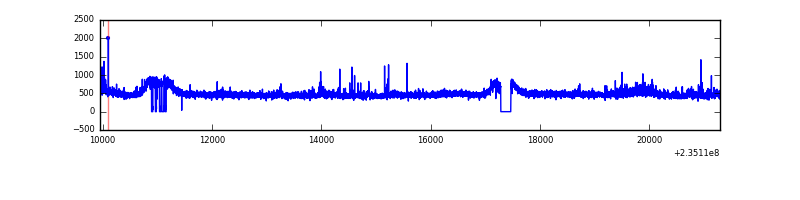 |
| C | 11344 | 11022 | 0 | 0 | 0.00% | 0.00% | 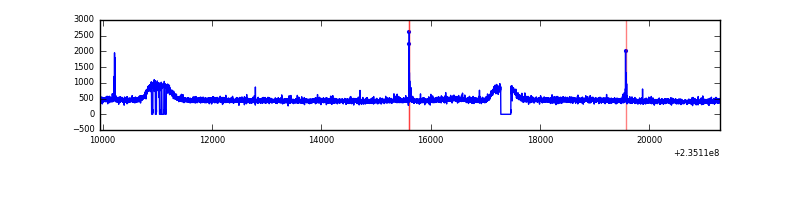 |
| D | 11344 | 11024 | 0 | 0 | 0.00% | 0.00% | 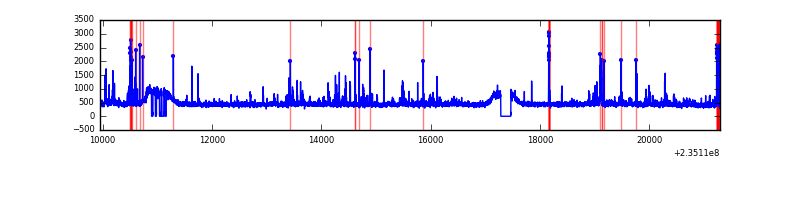 |
Top three noisy pixels from each quadrant. If the there are fewer than three noisy pixels in the level2.evt file, extra rows are filled as -1
| Pixel properties | Quadrant properties | ||||||
|---|---|---|---|---|---|---|---|
| Quadrant | DetID | PixID | Counts | Sigma | Mean | Median | Sigma |
| A | 0 | 29 | 603 | 11.18 | 154 | 143 | 41.1 |
| A | 7 | 110 | 527 | 9.33 | 154 | 143 | 41.1 |
| A | 9 | 19 | 450 | 7.46 | 154 | 143 | 41.1 |
| B | 2 | 9 | 495 | 10.65 | 152 | 144 | 33.0 |
| B | 12 | 226 | 417 | 8.28 | 152 | 144 | 33.0 |
| B | 14 | 254 | 403 | 7.86 | 152 | 144 | 33.0 |
| C | 2 | 191 | 416 | 6.41 | 156 | 144 | 42.4 |
| C | 12 | 241 | 403 | 6.1 | 156 | 144 | 42.4 |
| C | 3 | 158 | 392 | 5.85 | 156 | 144 | 42.4 |
| D | 6 | 231 | 391 | 6.19 | 146 | 132 | 41.9 |
| D | 1 | 19 | 388 | 6.11 | 146 | 132 | 41.9 |
| D | 7 | 5 | 369 | 5.66 | 146 | 132 | 41.9 |
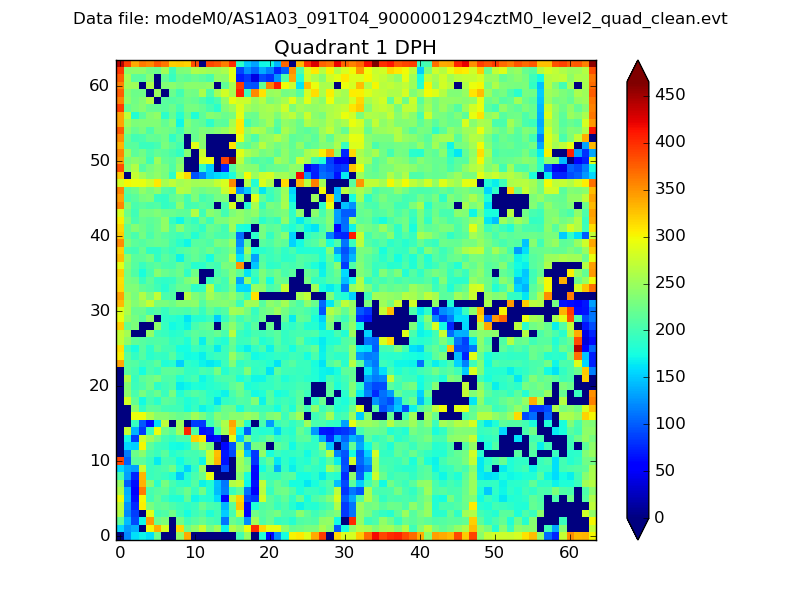
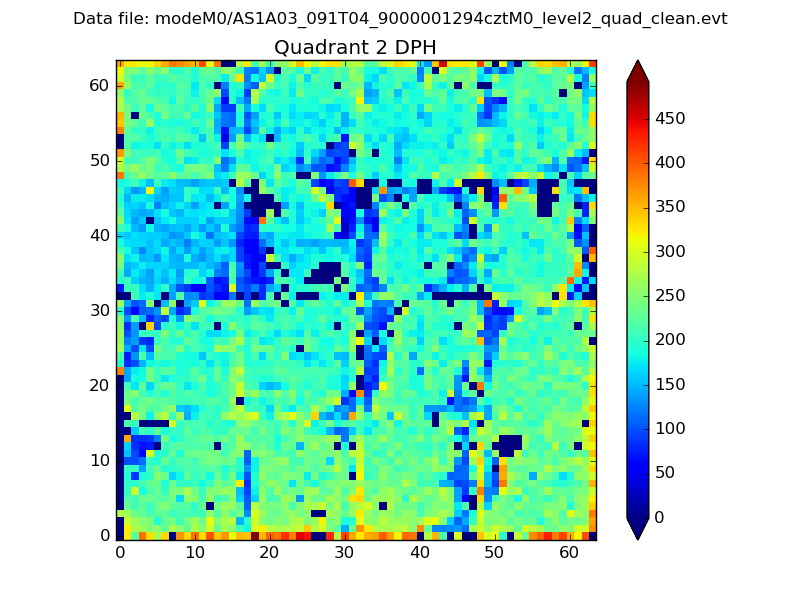
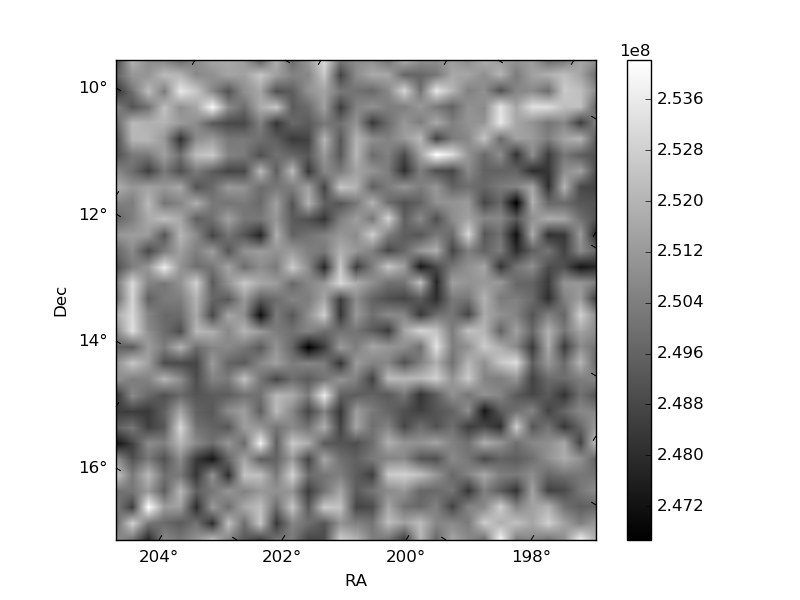
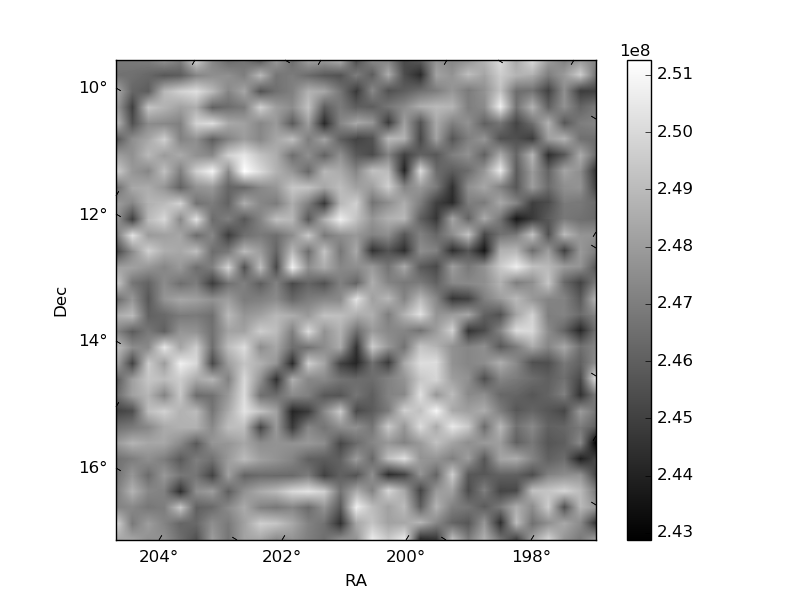
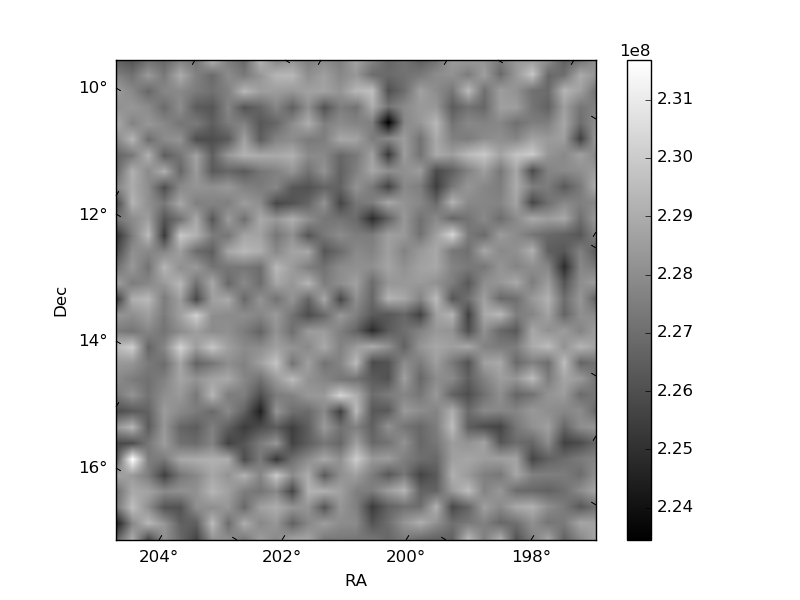
Histogram calculated using DETX and DETY for each event in the final _common_clean file
| Quadrant A | 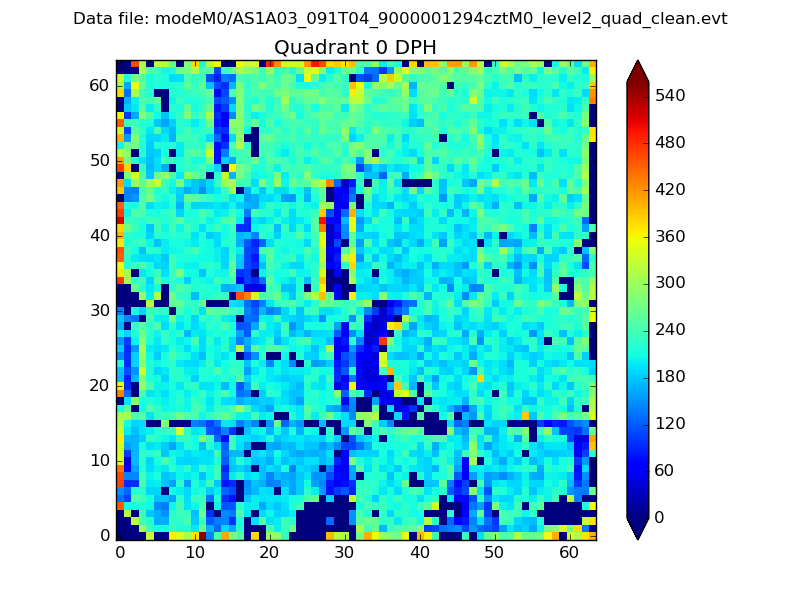 |
 |
Quadrant B |
|---|---|---|---|
| Quadrant D | 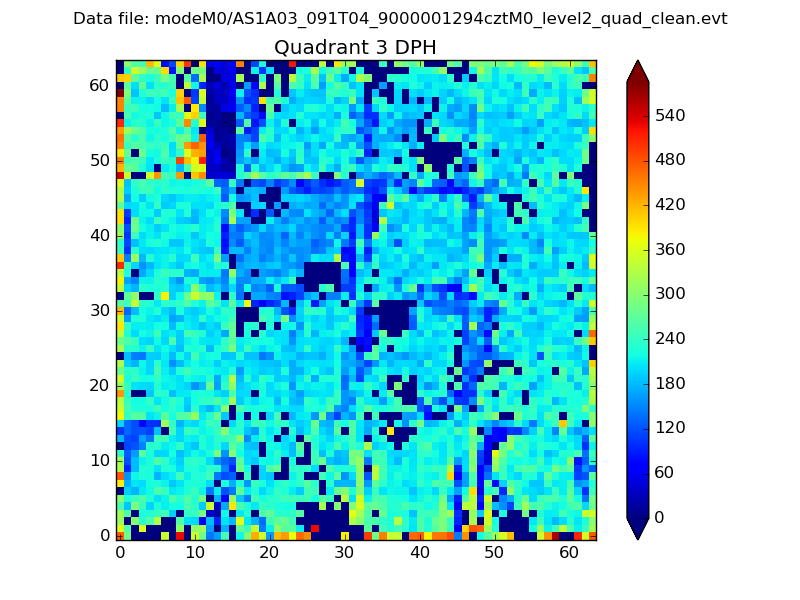 |
 |
Quadrant C |
| Plot type | Count rate plots | Images |
|---|---|---|
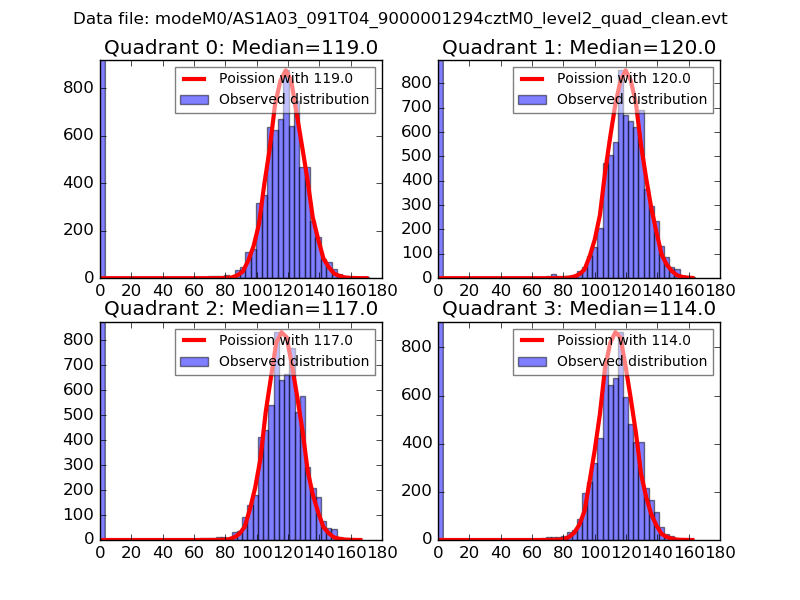
| Comparison with Poisson distribution Blue bars denote a histogram of data divided into 1 sec bins. Red curve is a Poisson curve with rate = median count rate of data. |
 |
 |
| Quadrant-wise count rates Data is divided into 100 sec bins |
 |
|
| Module-wise count rates for Quadrant A Data is divided into 100 sec bins |
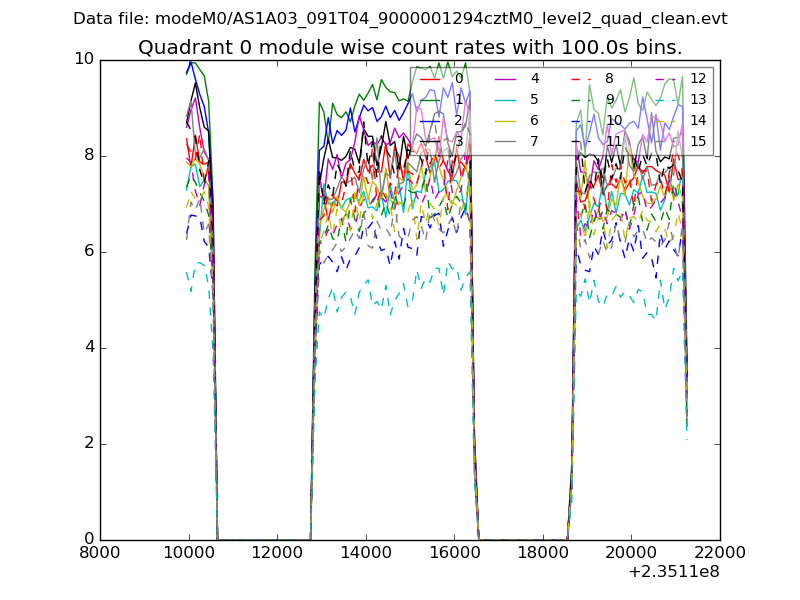 |
 |
| Module-wise count rates for Quadrant B Data is divided into 100 sec bins |
 |
 |
| Module-wise count rates for Quadrant C Data is divided into 100 sec bins |
 |
 |
| Module-wise count rates for Quadrant D Data is divided into 100 sec bins |
 |
 |
| Parameter | Plot |
|---|---|
| CZT HV Monitor |  |
| D_VDD | 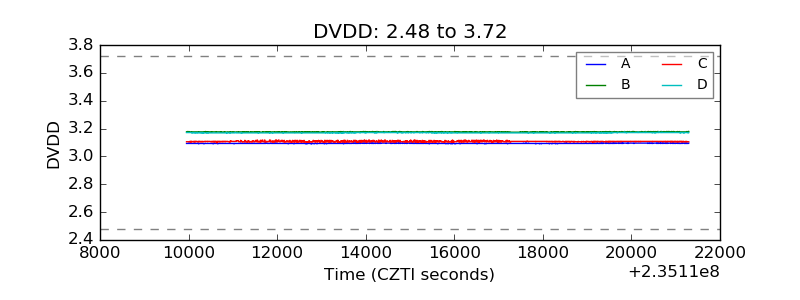 |
| Temperature 1 | 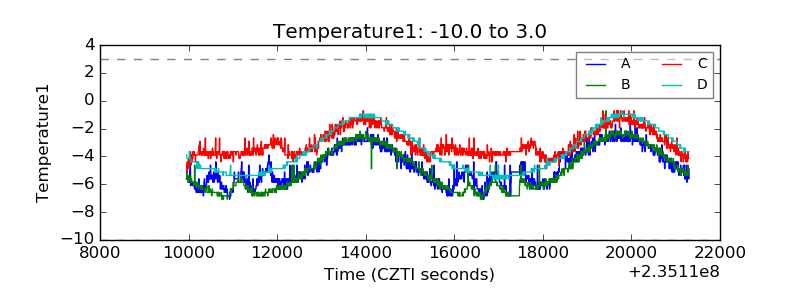 |
| Veto HV Monitor |  |
| Veto LLD | 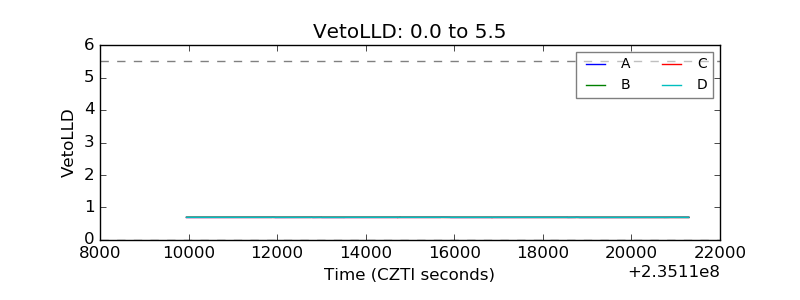 |
| Alpha Counter | 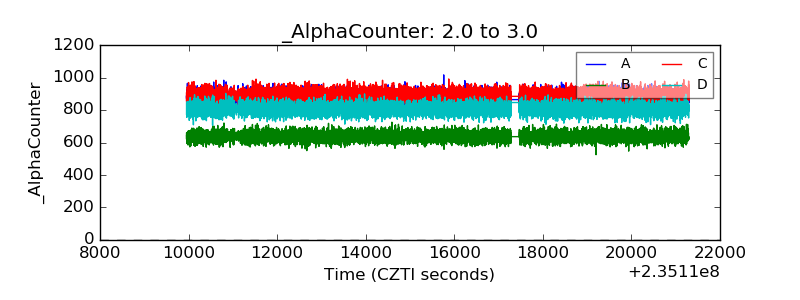 |
| _CPM_Rate | 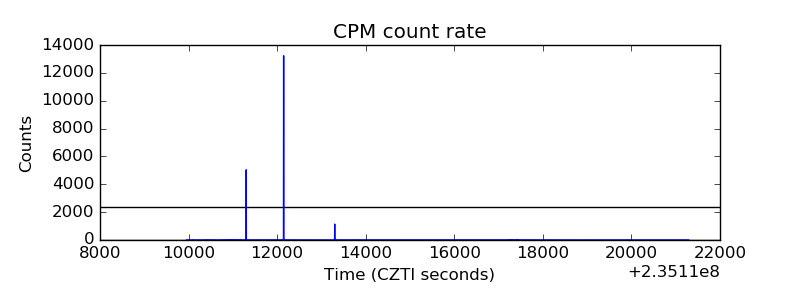 |
| CZT Counter |  |
| +2.5 Volts monitor | 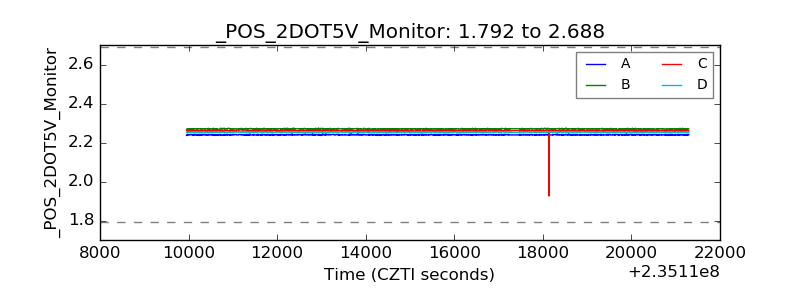 |
| +5 Volts monitor | 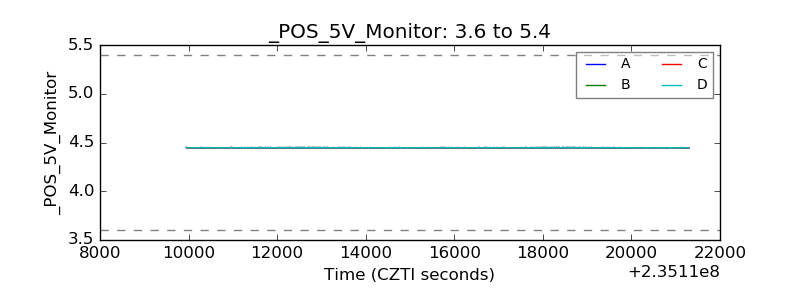 |
| _ROLL_ROT | 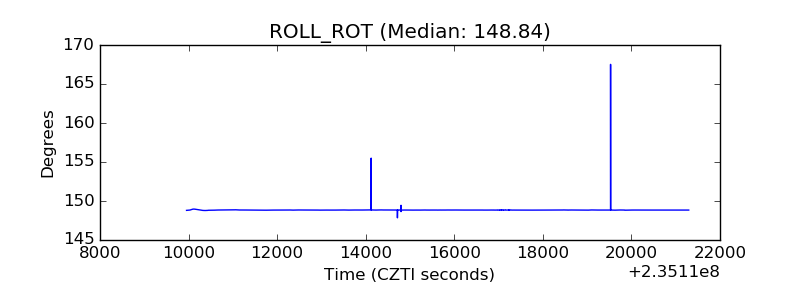 |
| _Roll_DEC |  |
| _Roll_RA | 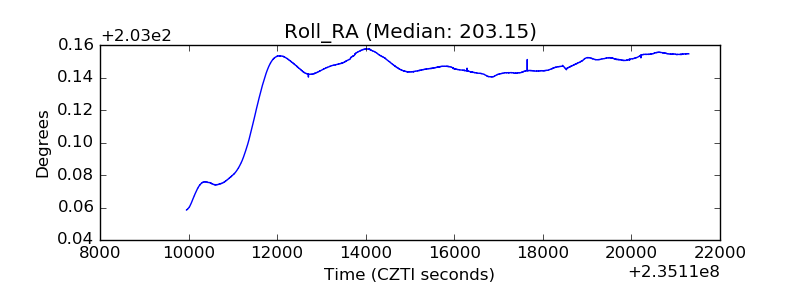 |
| Veto Counter | 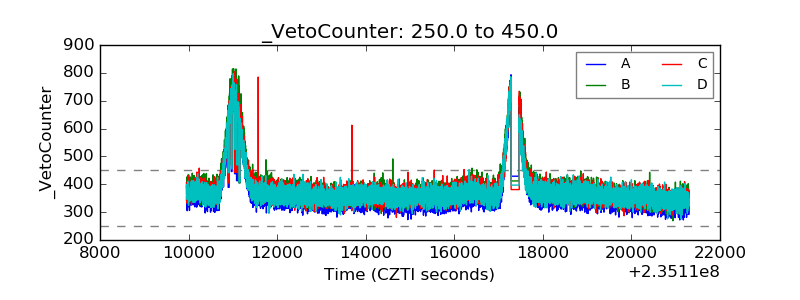 |