| Param | Original file | Final file |
|---|---|---|
| Filename | modeM0/AS1A03_091T04_9000001294_09253cztM0_level2.evt | modeM0/AS1A03_091T04_9000001294_09253cztM0_level2_quad_clean.evt |
| Size (bytes) | 67,328,640 | 6,909,120 |
| Size | 64.2 MB | 6.6 MB |
| Events in quadrant A | 516,479 | 33,105 |
| Events in quadrant B | 500,761 | 33,381 |
| Events in quadrant C | 476,433 | 33,251 |
| Events in quadrant D | 474,913 | 33,096 |
| Mode M0 | |||
|---|---|---|---|
| Quadrant | BADHDUFLAG | Total packets | Discarded packets |
| A | 0 | 6055 | 3972 |
| B | 0 | 5756 | 3681 |
| C | 0 | 5692 | 3654 |
| D | 0 | 5980 | 3892 |
| Mode SS | |||
|---|---|---|---|
| Quadrant | BADHDUFLAG | Total packets | Discarded packets |
| A | 0 | 56 | 32 |
| B | 0 | 56 | 34 |
| C | 0 | 56 | 26 |
| D | 0 | 56 | 22 |
| Mode M9 | |||
|---|---|---|---|
| Quadrant | BADHDUFLAG | Total packets | Discarded packets |
| A | 0 | 2 | 0 |
| B | 0 | 2 | 0 |
| C | 0 | 2 | 1 |
| D | 0 | 2 | 0 |
| Quadrant | Total seconds | Saturated seconds | Saturation percentage |
|---|---|---|---|
| A | 964 | 74 | 7.676349% |
| B | 954 | 71 | 7.442348% |
| C | 965 | 63 | 6.528497% |
| D | 966 | 66 | 6.832298% |
Noise dominated data is calculated using 1-second bins in cleaned event files. If a bin has >2000 counts, and if more than 50% of those come from <1% of pixels, then it is considered to be noise-dominated and hence unusable.
| Quadrant | # 1 sec bins | Bins with >0 counts | Bins with >2000 counts | High rate bins dominated by noise | Noise dominated (total time) | Noise dominated (detector-on time) | Marked lightcurve |
|---|---|---|---|---|---|---|---|
| A | 2764 | 1363 | 0 | 0 | 0.00% | 0.00% | 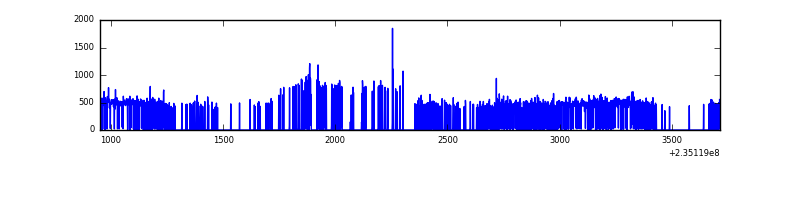 |
| B | 2762 | 1372 | 0 | 0 | 0.00% | 0.00% | 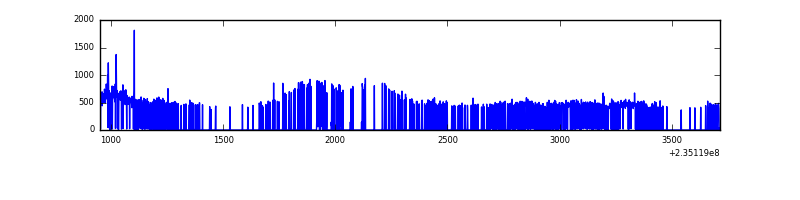 |
| C | 2764 | 1378 | 0 | 0 | 0.00% | 0.00% | 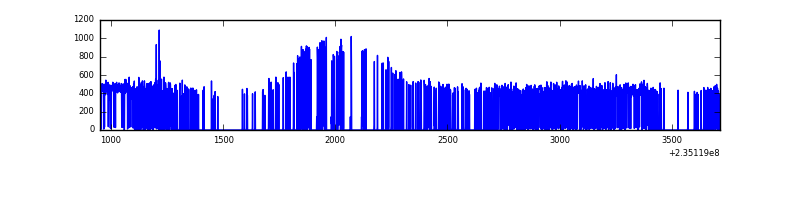 |
| D | 2761 | 1394 | 0 | 0 | 0.00% | 0.00% | 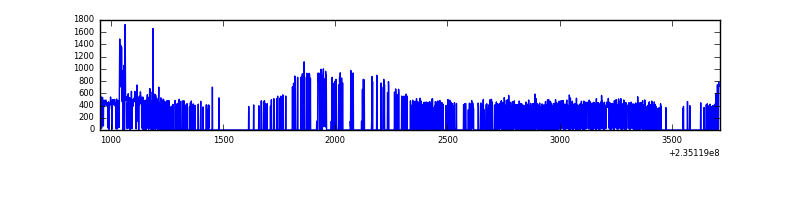 |
Top three noisy pixels from each quadrant. If the there are fewer than three noisy pixels in the level2.evt file, extra rows are filled as -1
| Pixel properties | Quadrant properties | ||||||
|---|---|---|---|---|---|---|---|
| Quadrant | DetID | PixID | Counts | Sigma | Mean | Median | Sigma |
| A | 8 | 5 | 37917 | 1372.46 | 121 | 118 | 27.5 |
| A | 15 | 174 | 4455 | 157.47 | 121 | 118 | 27.5 |
| A | 1 | 162 | 3400 | 119.17 | 121 | 118 | 27.5 |
| B | 0 | 219 | 6953 | 258.87 | 122 | 119 | 26.4 |
| B | 0 | 214 | 6607 | 245.77 | 122 | 119 | 26.4 |
| B | 0 | 213 | 4237 | 155.99 | 122 | 119 | 26.4 |
| C | 14 | 234 | 1893 | 57.94 | 120 | 121 | 30.6 |
| C | 8 | 128 | 1509 | 45.39 | 120 | 121 | 30.6 |
| C | 13 | 61 | 904 | 25.6 | 120 | 121 | 30.6 |
| D | 2 | 136 | 12101 | 364.58 | 117 | 113 | 32.9 |
| D | 7 | 71 | 8940 | 268.45 | 117 | 113 | 32.9 |
| D | 1 | 52 | 4085 | 120.8 | 117 | 113 | 32.9 |
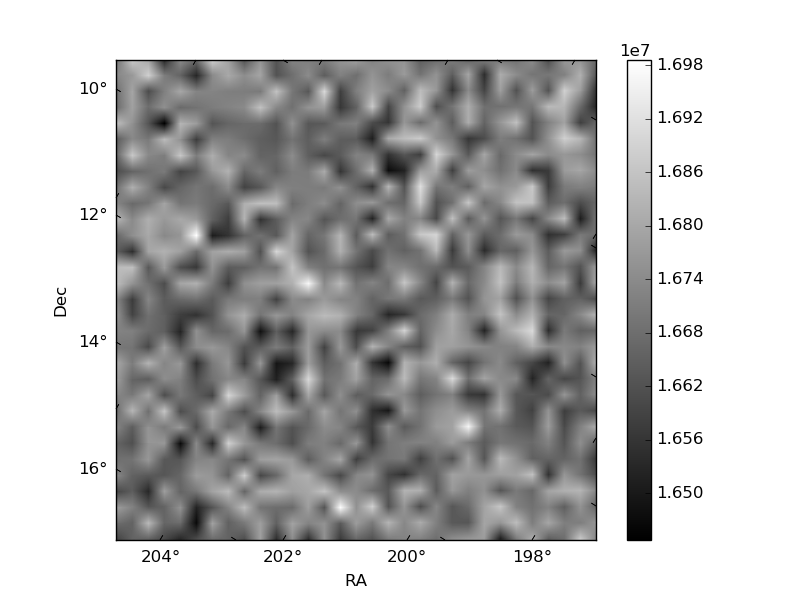
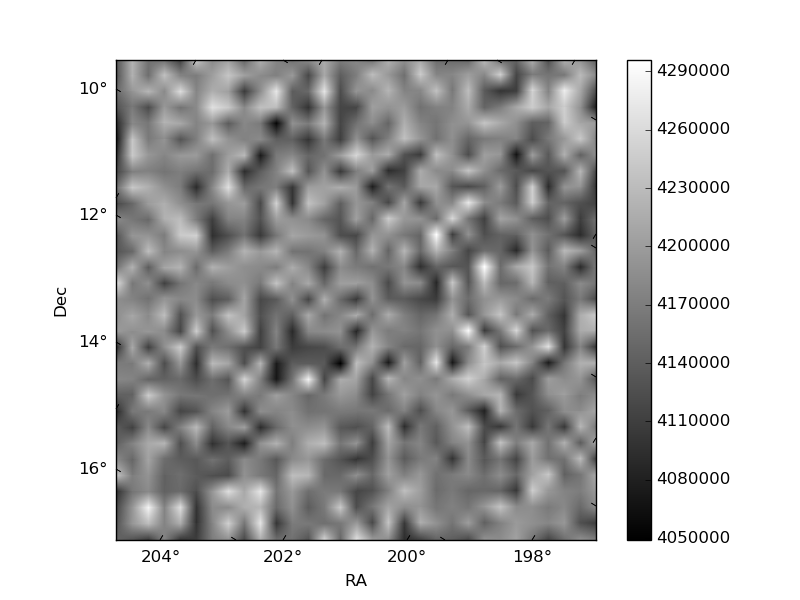
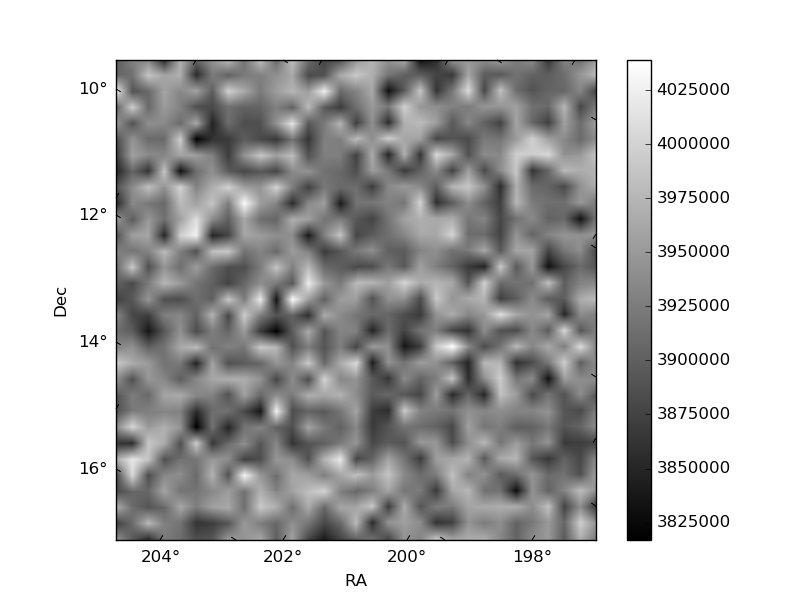
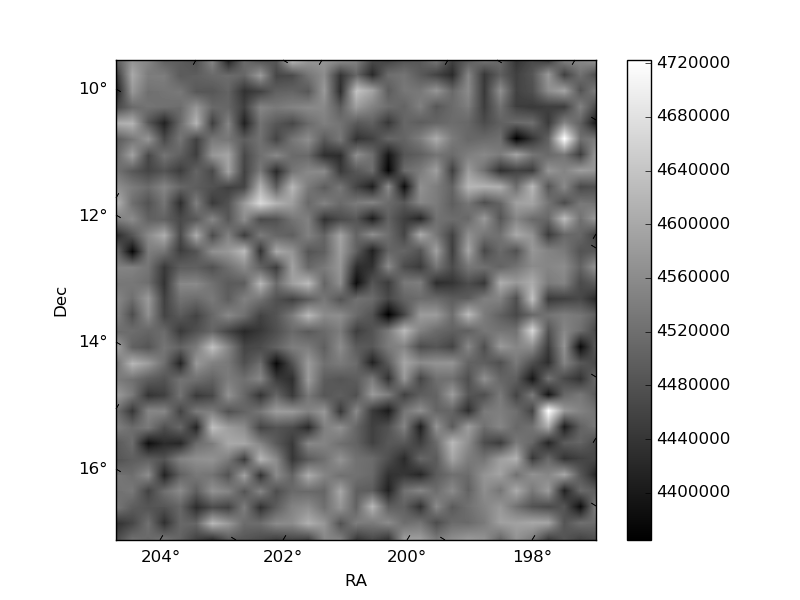
Histogram calculated using DETX and DETY for each event in the final _common_clean file
| Quadrant A | 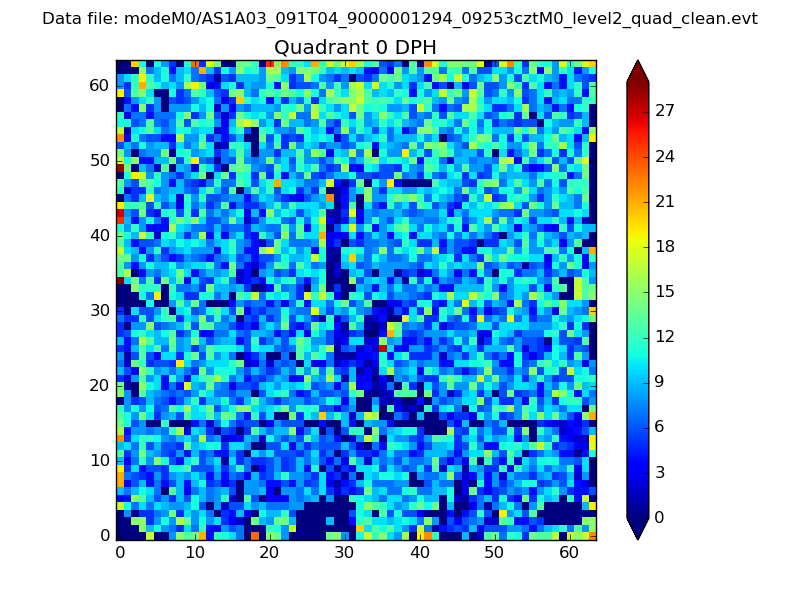 |
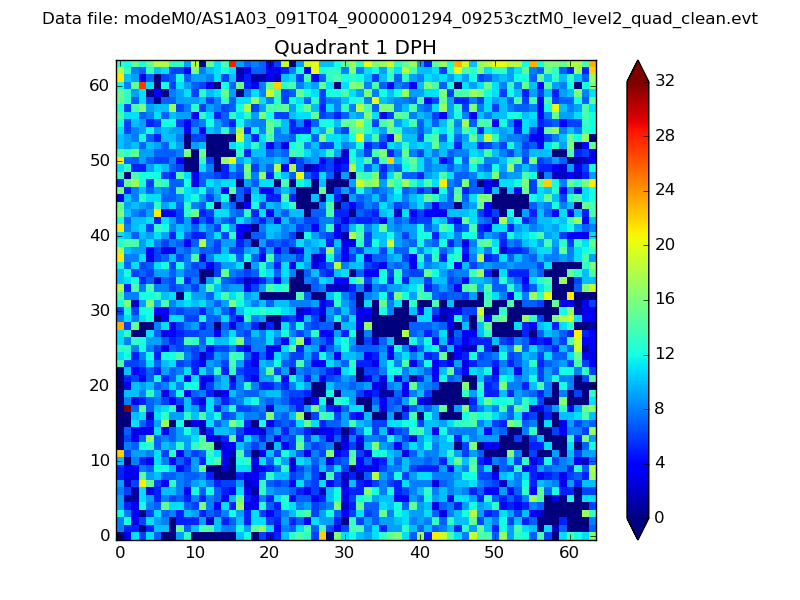 |
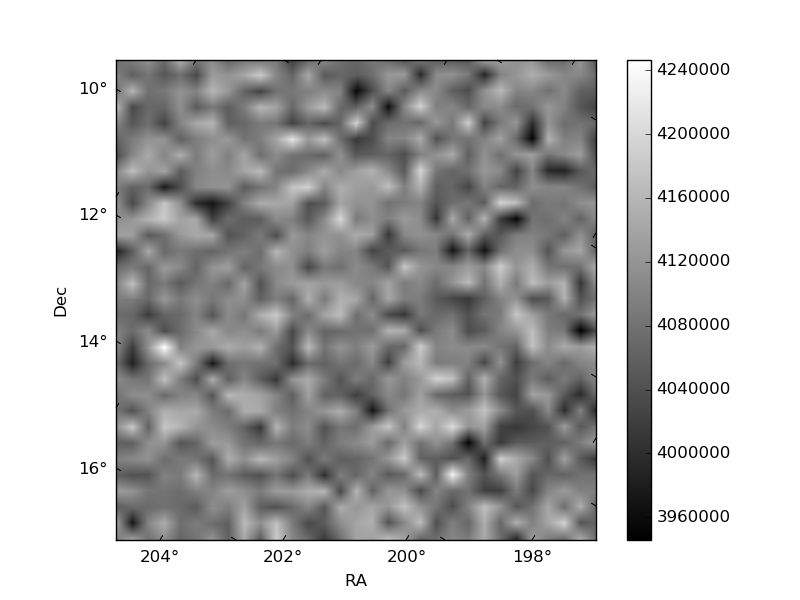
Quadrant B |
|---|---|---|---|
| Quadrant D | 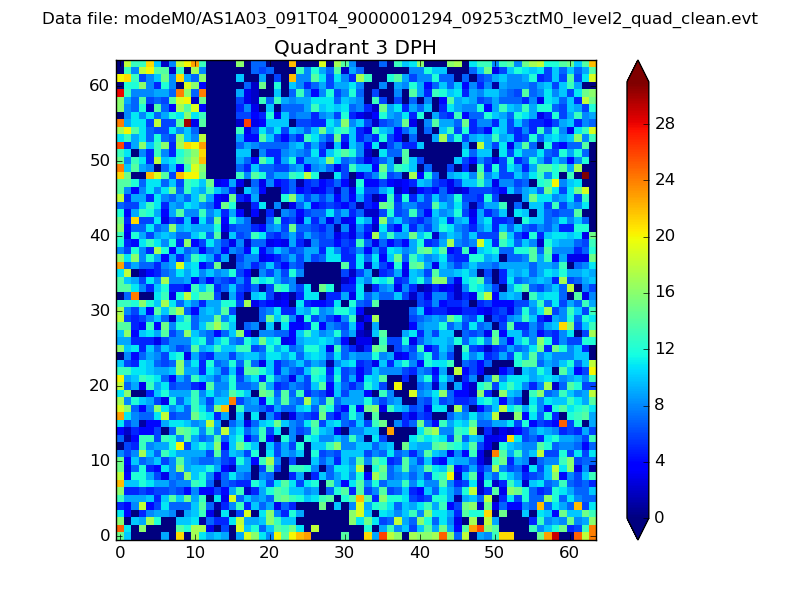 |
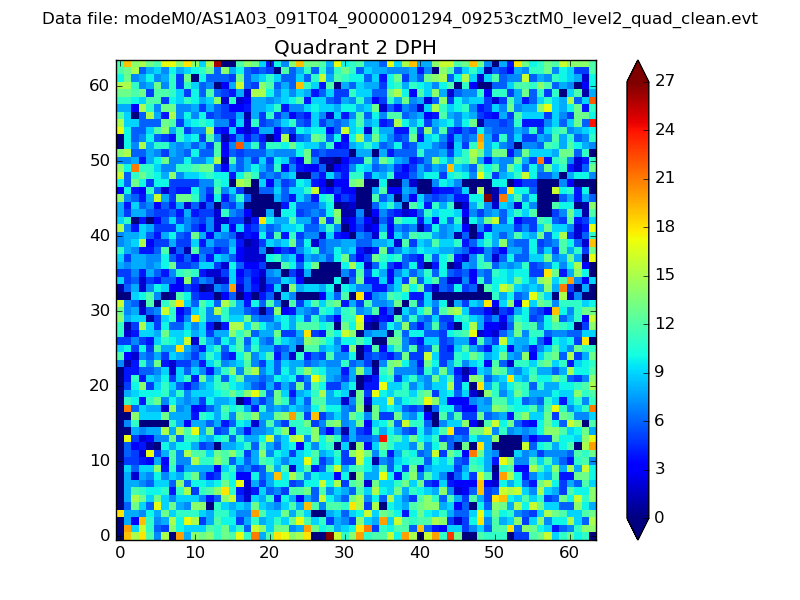 |
Quadrant C |
| Plot type | Count rate plots | Images |
|---|---|---|
| Comparison with Poisson distribution Blue bars denote a histogram of data divided into 1 sec bins. Red curve is a Poisson curve with rate = median count rate of data. |
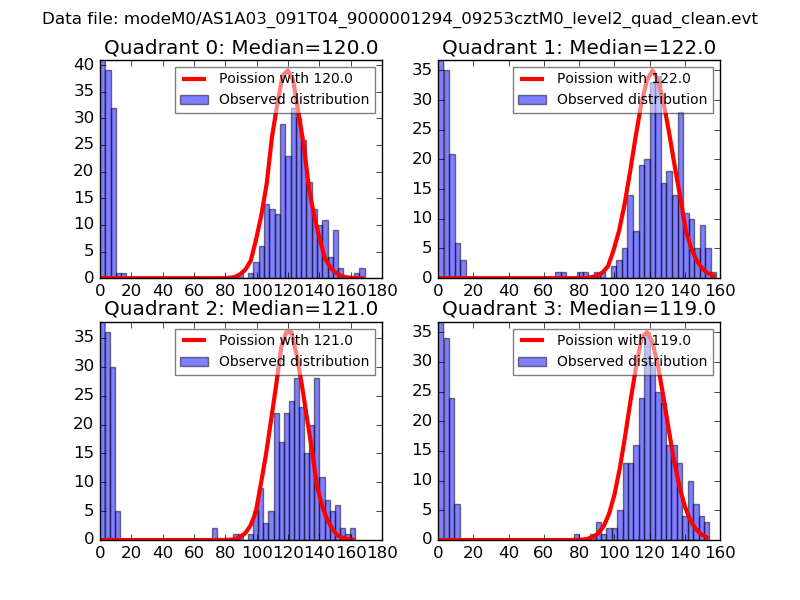 |
 |
| Quadrant-wise count rates Data is divided into 100 sec bins |
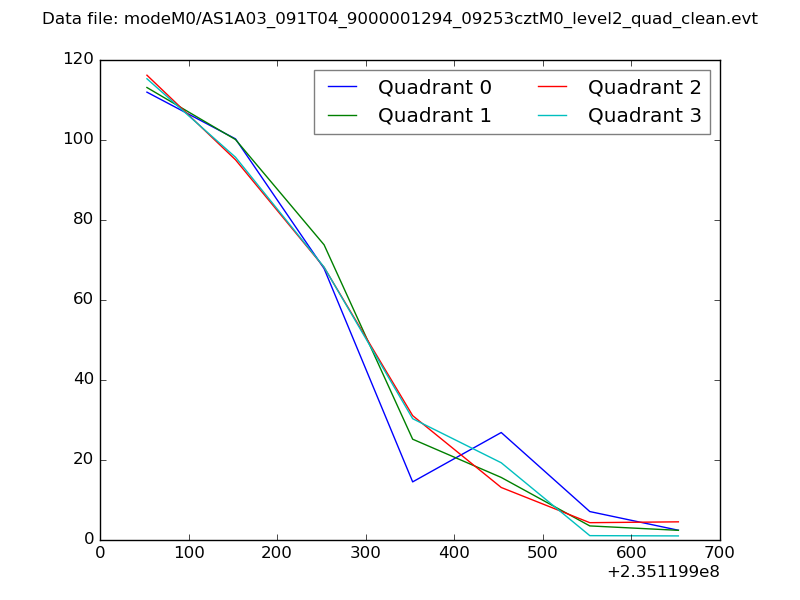 |
|
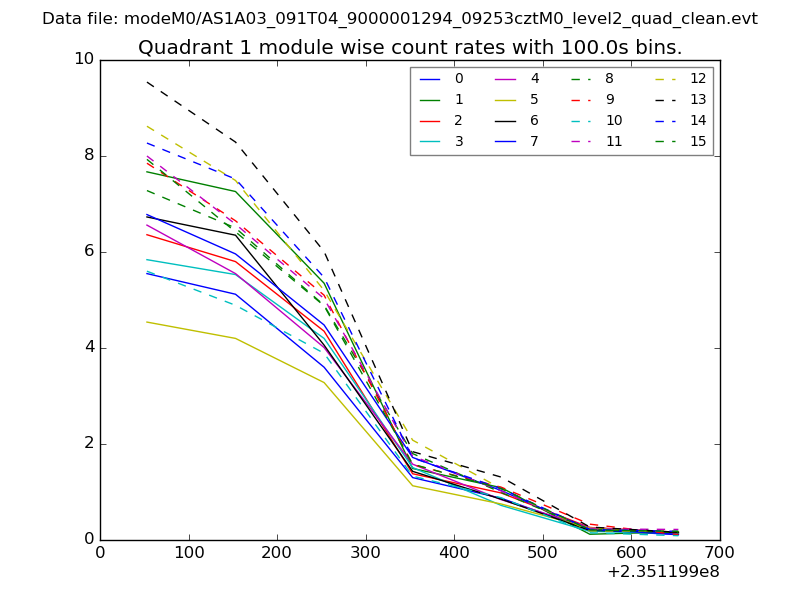
| Module-wise count rates for Quadrant A Data is divided into 100 sec bins |
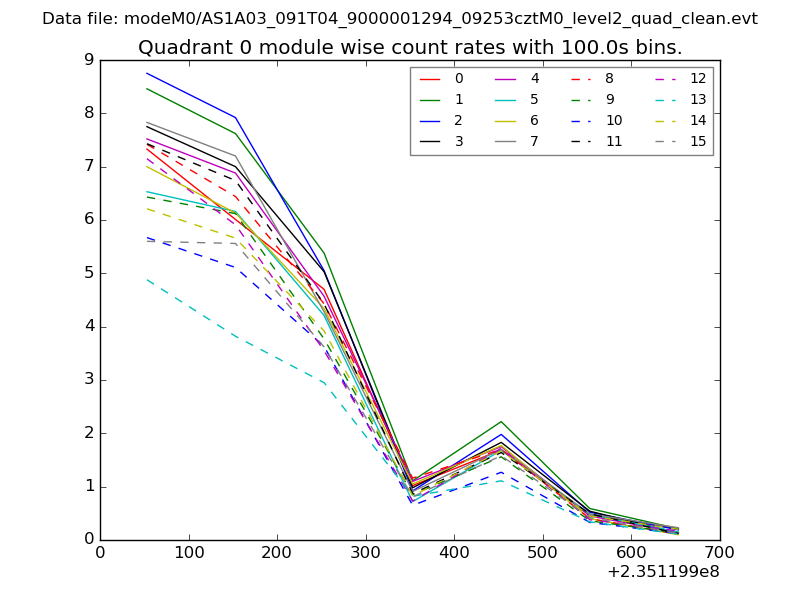 |
 |
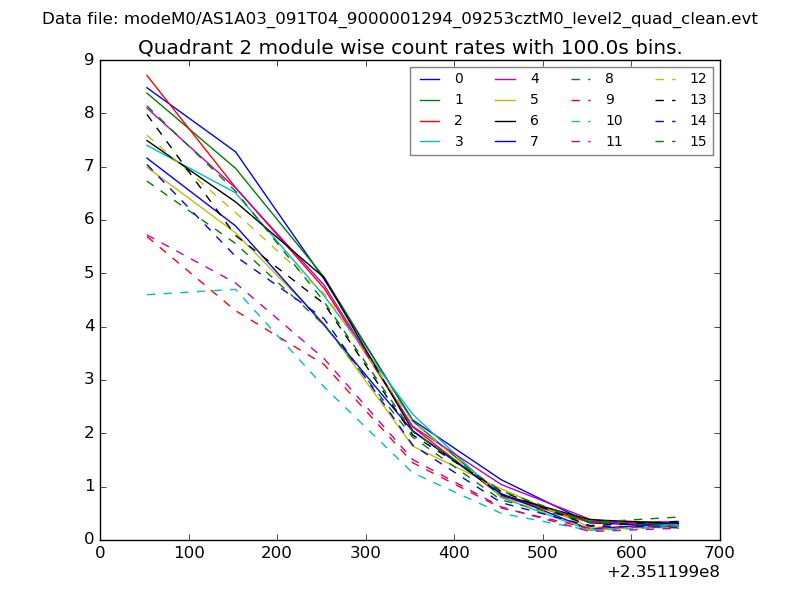
| Module-wise count rates for Quadrant B Data is divided into 100 sec bins |
 |
 |
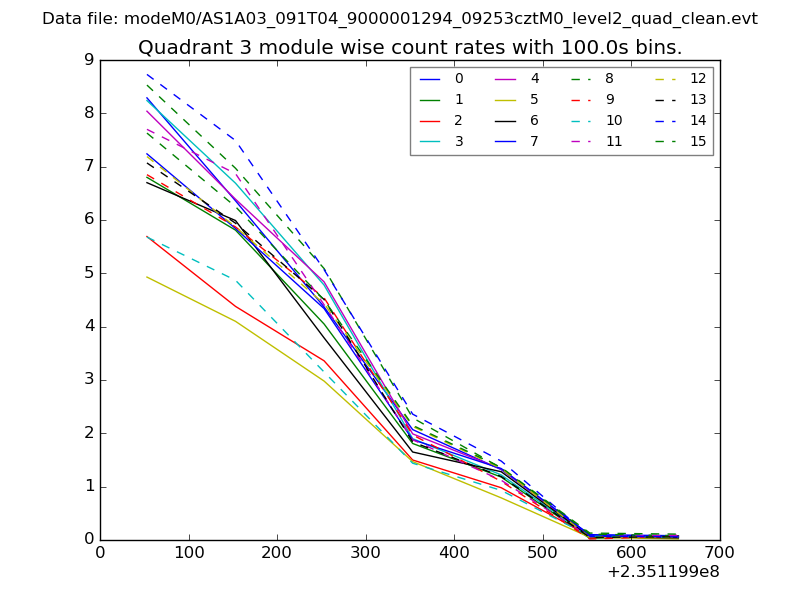
| Module-wise count rates for Quadrant C Data is divided into 100 sec bins |
 |
 |
| Module-wise count rates for Quadrant D Data is divided into 100 sec bins |
 |
 |
| Parameter | Plot |
|---|---|
| CZT HV Monitor | 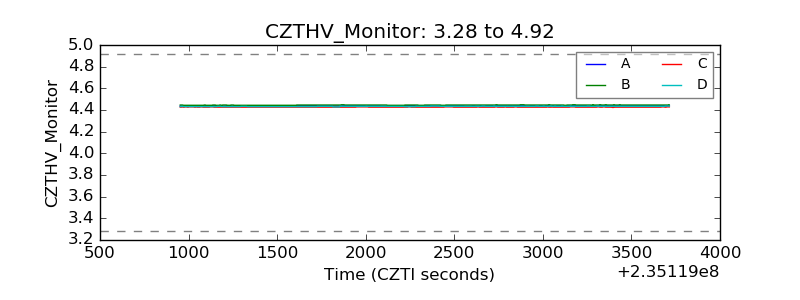 |
| D_VDD | 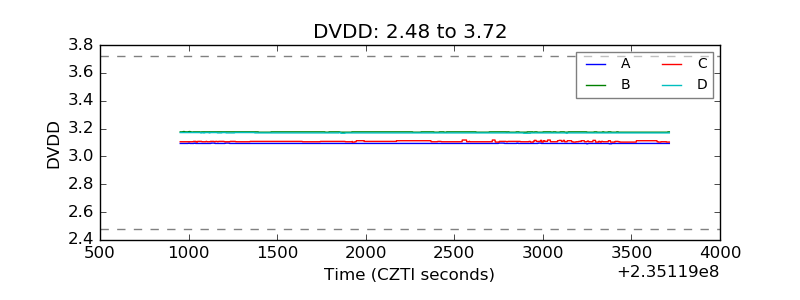 |
| Temperature 1 | 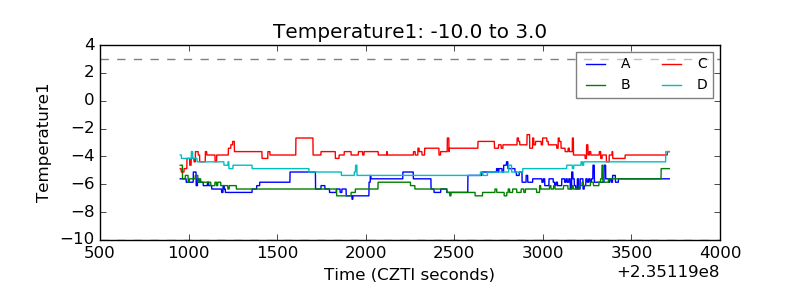 |
| Veto HV Monitor | 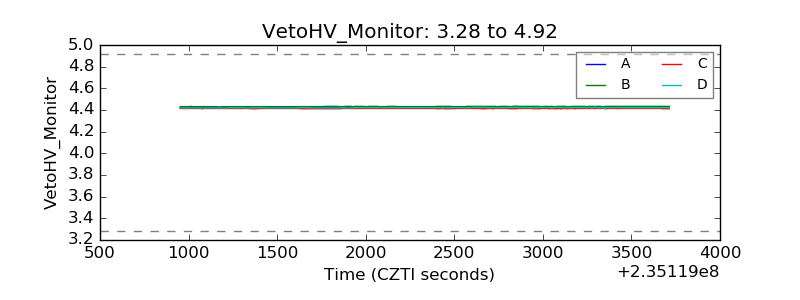 |
| Veto LLD | 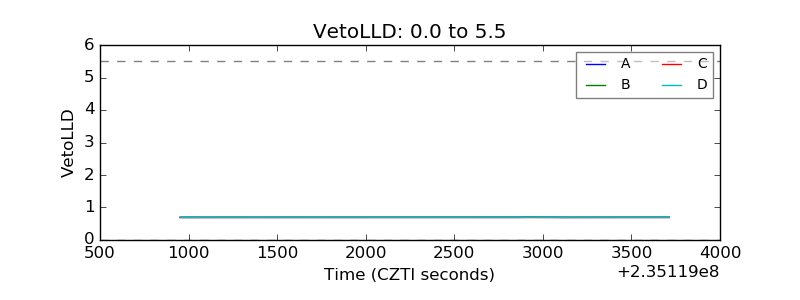 |
| Alpha Counter | 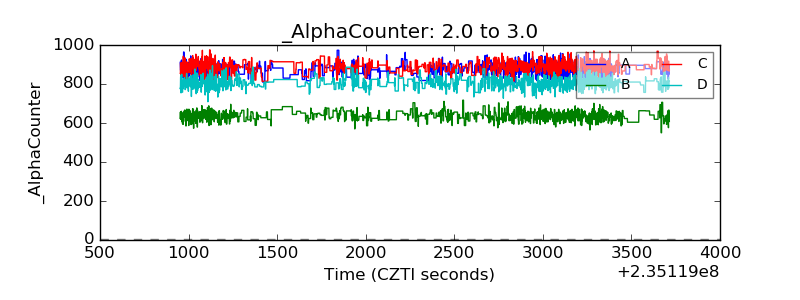 |
| _CPM_Rate | 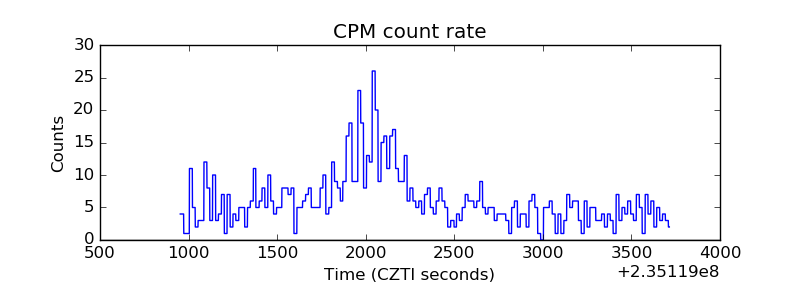 |
| CZT Counter | 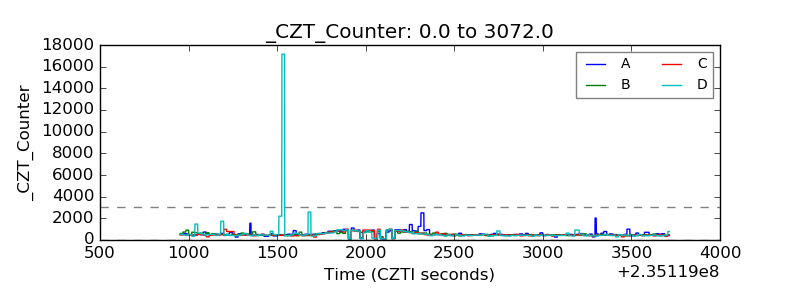 |
| +2.5 Volts monitor |  |
| +5 Volts monitor | 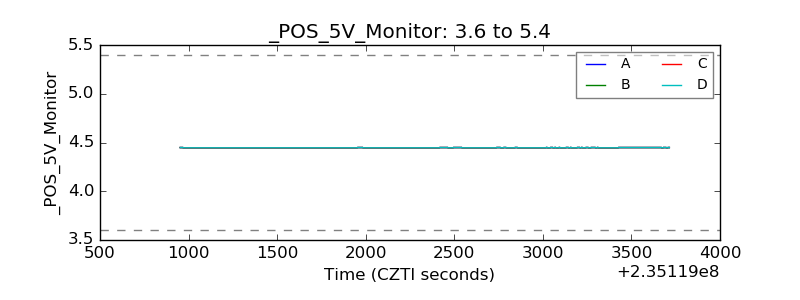 |
| _ROLL_ROT | 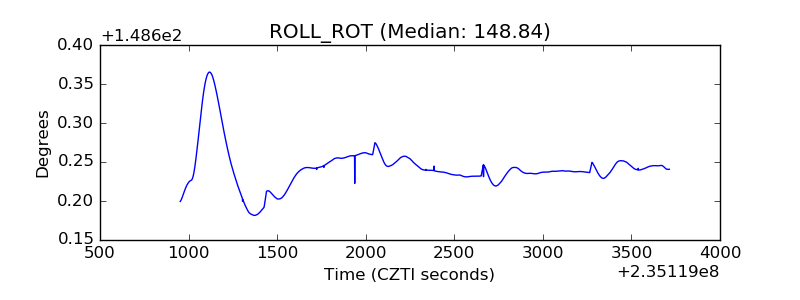 |
| _Roll_DEC | 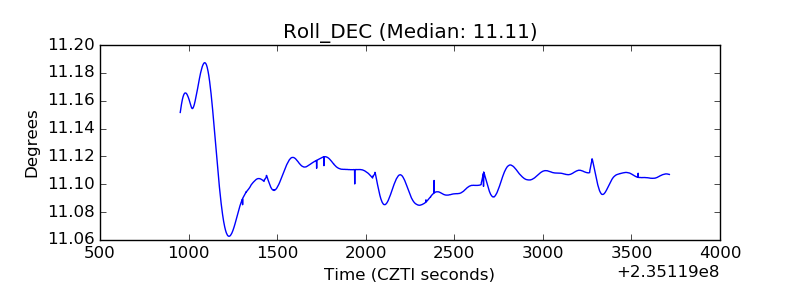 |
| _Roll_RA | 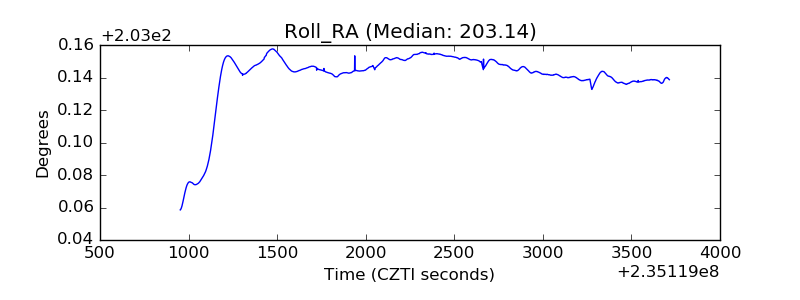 |
| Veto Counter | 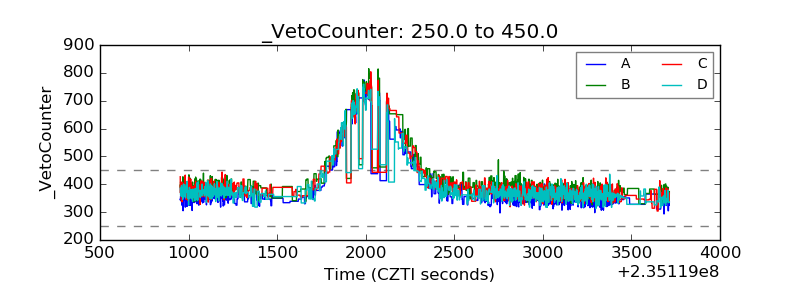 |