| Param | Original file | Final file |
|---|---|---|
| Filename | modeM0/AS1A03_091T04_9000001294_09257cztM0_level2.evt | modeM0/AS1A03_091T04_9000001294_09257cztM0_level2_quad_clean.evt |
| Size (bytes) | 490,504,320 | 82,831,680 |
| Size | 467.8 MB | 79.0 MB |
| Events in quadrant A | 3,864,769 | 499,436 |
| Events in quadrant B | 3,603,699 | 516,294 |
| Events in quadrant C | 3,344,806 | 500,057 |
| Events in quadrant D | 3,545,747 | 485,594 |
| Mode M0 | |||
|---|---|---|---|
| Quadrant | BADHDUFLAG | Total packets | Discarded packets |
| A | 0 | 22029 | 6125 |
| B | 0 | 20808 | 5420 |
| C | 0 | 20494 | 5449 |
| D | 0 | 21480 | 5782 |
| Mode SS | |||
|---|---|---|---|
| Quadrant | BADHDUFLAG | Total packets | Discarded packets |
| A | 0 | 202 | 54 |
| B | 0 | 204 | 54 |
| C | 0 | 202 | 50 |
| D | 0 | 201 | 51 |
| Mode M9 | |||
|---|---|---|---|
| Quadrant | BADHDUFLAG | Total packets | Discarded packets |
| A | 0 | 2 | 0 |
| B | 0 | 2 | 0 |
| C | 0 | 2 | 0 |
| D | 0 | 2 | 0 |
| Quadrant | Total seconds | Saturated seconds | Saturation percentage |
|---|---|---|---|
| A | 7216 | 242 | 3.353659% |
| B | 7302 | 234 | 3.204601% |
| C | 7270 | 171 | 2.352132% |
| D | 7287 | 195 | 2.675998% |
Noise dominated data is calculated using 1-second bins in cleaned event files. If a bin has >2000 counts, and if more than 50% of those come from <1% of pixels, then it is considered to be noise-dominated and hence unusable.
| Quadrant | # 1 sec bins | Bins with >0 counts | Bins with >2000 counts | High rate bins dominated by noise | Noise dominated (total time) | Noise dominated (detector-on time) | Marked lightcurve |
|---|---|---|---|---|---|---|---|
| A | 11344 | 7882 | 6 | 6 | 0.05% | 0.08% | 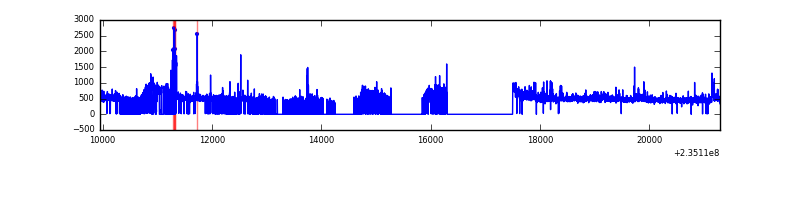 |
| B | 11344 | 7959 | 1 | 1 | 0.01% | 0.01% | 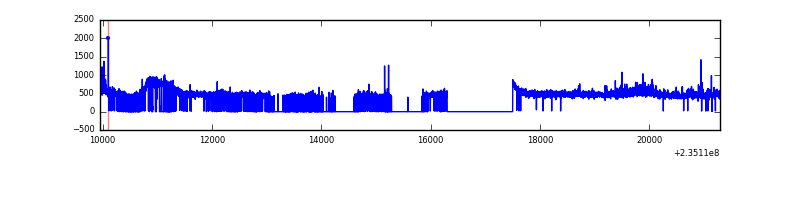 |
| C | 11344 | 7956 | 1 | 1 | 0.01% | 0.01% | 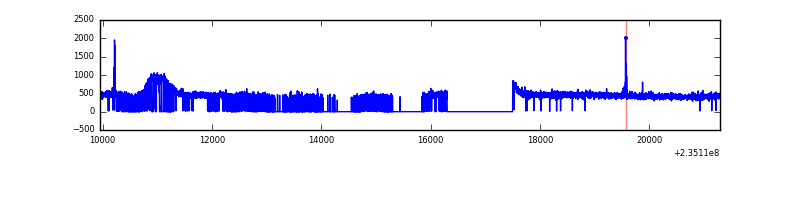 |
| D | 11344 | 7946 | 32 | 32 | 0.28% | 0.40% | 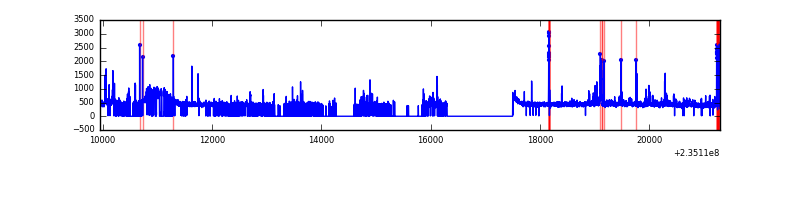 |
Top three noisy pixels from each quadrant. If the there are fewer than three noisy pixels in the level2.evt file, extra rows are filled as -1
| Pixel properties | Quadrant properties | ||||||
|---|---|---|---|---|---|---|---|
| Quadrant | DetID | PixID | Counts | Sigma | Mean | Median | Sigma |
| A | 8 | 5 | 420649 | 2337.94 | 863 | 842 | 179.6 |
| A | 15 | 174 | 55070 | 302.0 | 863 | 842 | 179.6 |
| A | 1 | 162 | 33361 | 181.1 | 863 | 842 | 179.6 |
| B | 0 | 219 | 45577 | 262.1 | 878 | 857 | 170.6 |
| B | 0 | 187 | 41490 | 238.14 | 878 | 857 | 170.6 |
| B | 0 | 214 | 33471 | 191.14 | 878 | 857 | 170.6 |
| C | 14 | 234 | 18212 | 87.06 | 849 | 849 | 199.4 |
| C | 8 | 128 | 6854 | 30.11 | 849 | 849 | 199.4 |
| C | 13 | 61 | 6310 | 27.38 | 849 | 849 | 199.4 |
| D | 1 | 52 | 131086 | 591.51 | 847 | 822 | 220.2 |
| D | 2 | 136 | 93918 | 422.74 | 847 | 822 | 220.2 |
| D | 7 | 71 | 52291 | 233.71 | 847 | 822 | 220.2 |
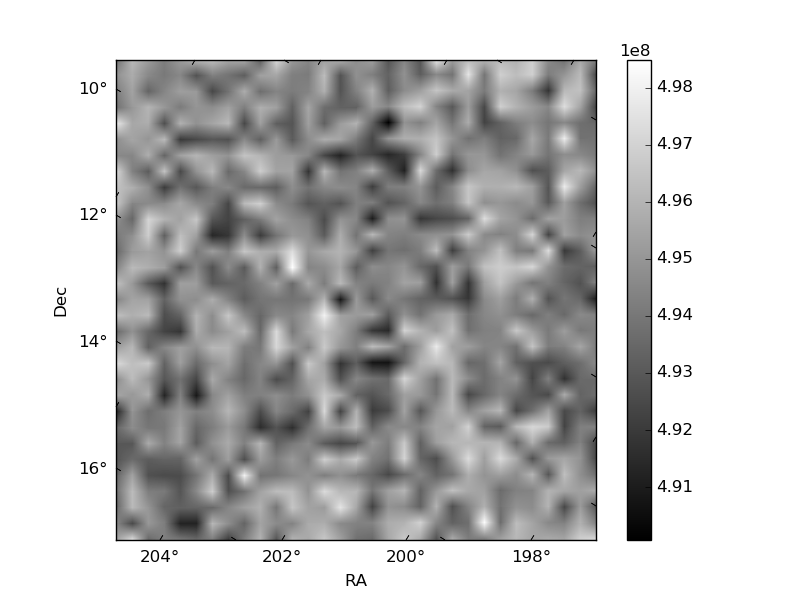
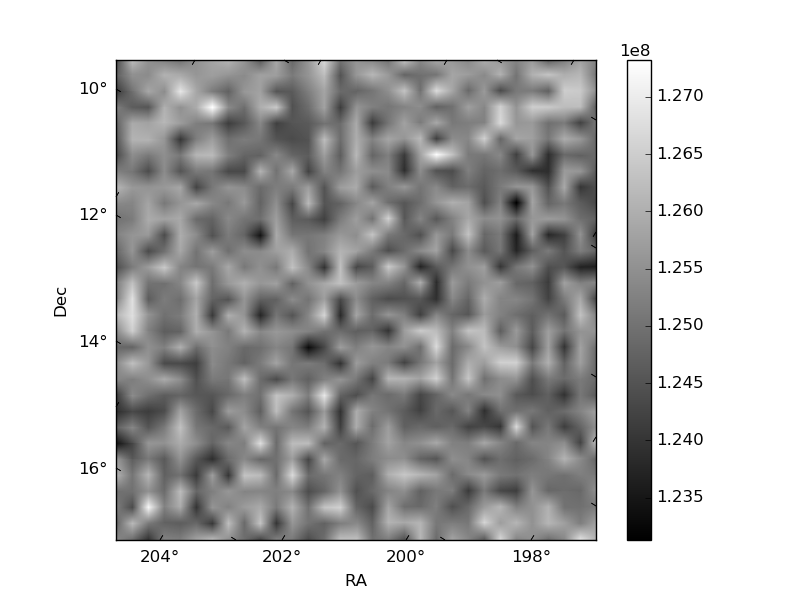
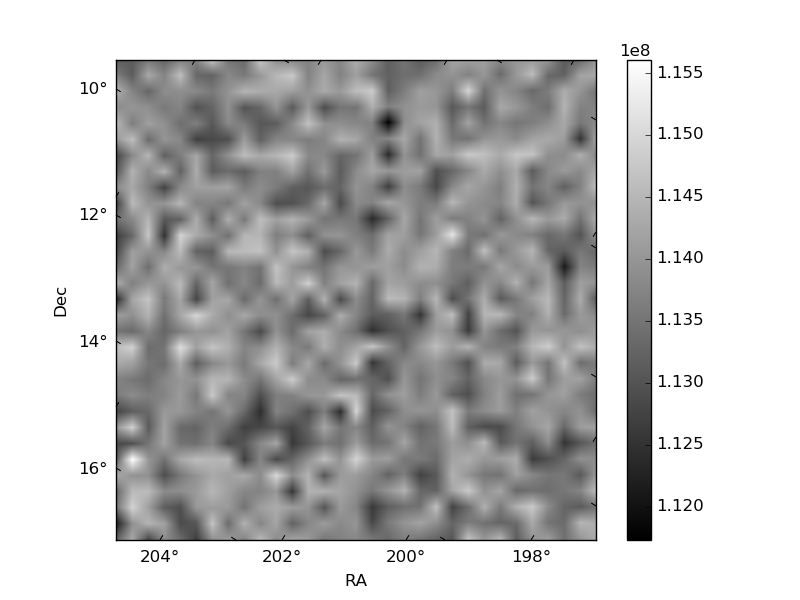
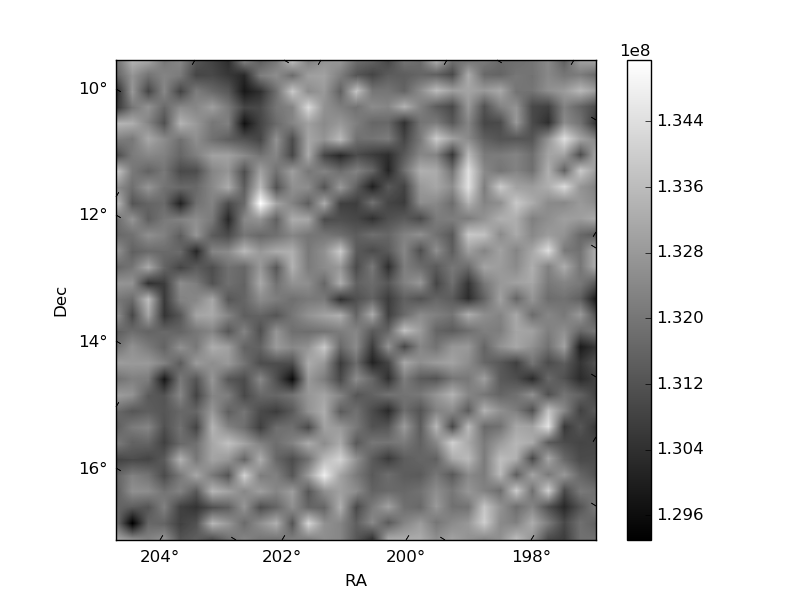
Histogram calculated using DETX and DETY for each event in the final _common_clean file
| Quadrant A | 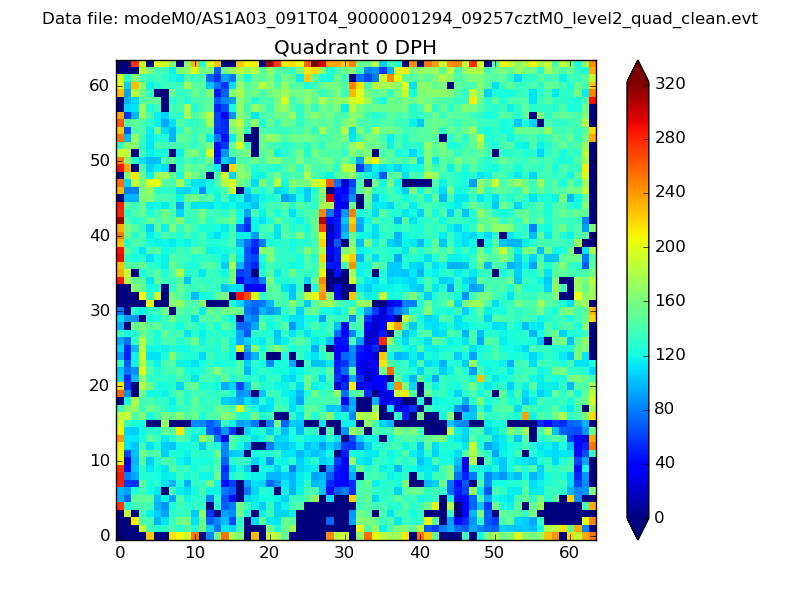 |
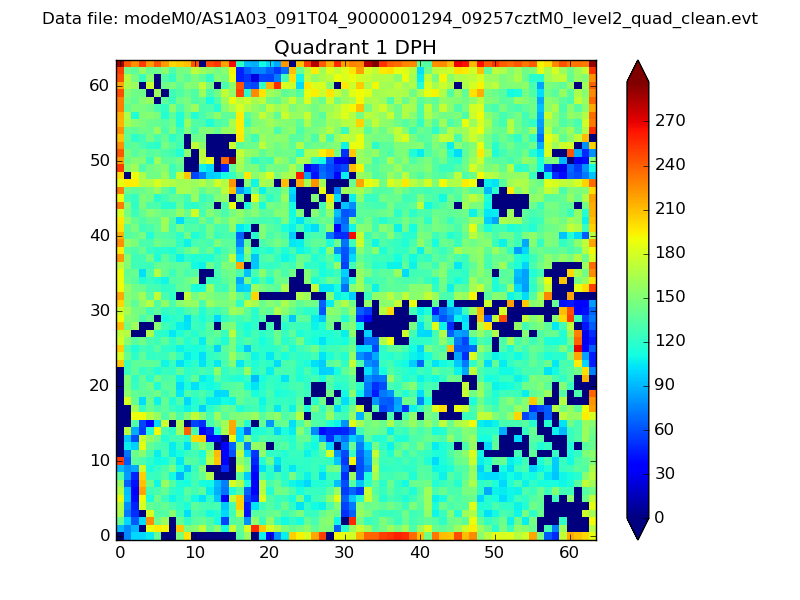 |
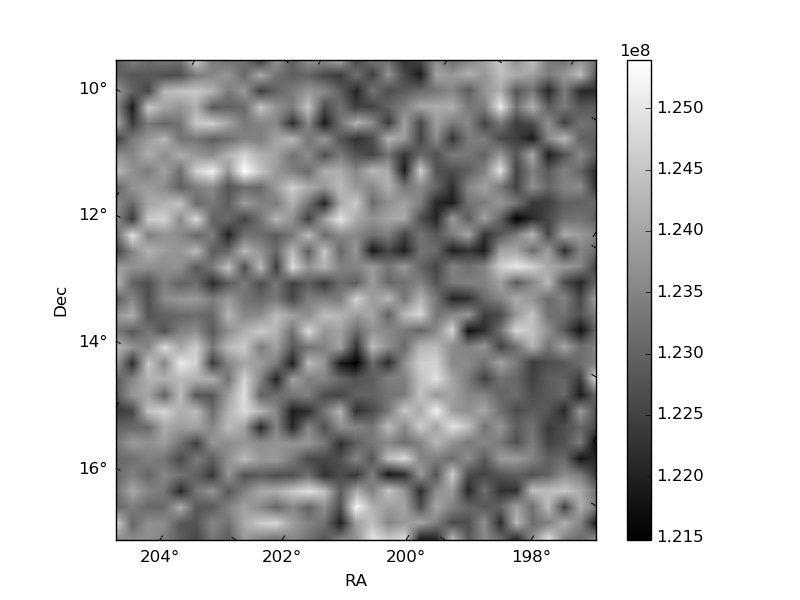
Quadrant B |
|---|---|---|---|
| Quadrant D | 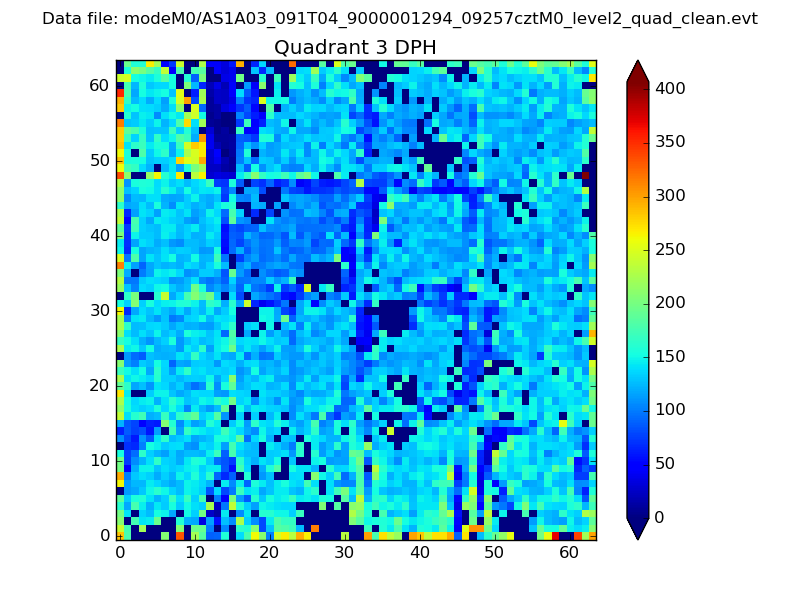 |
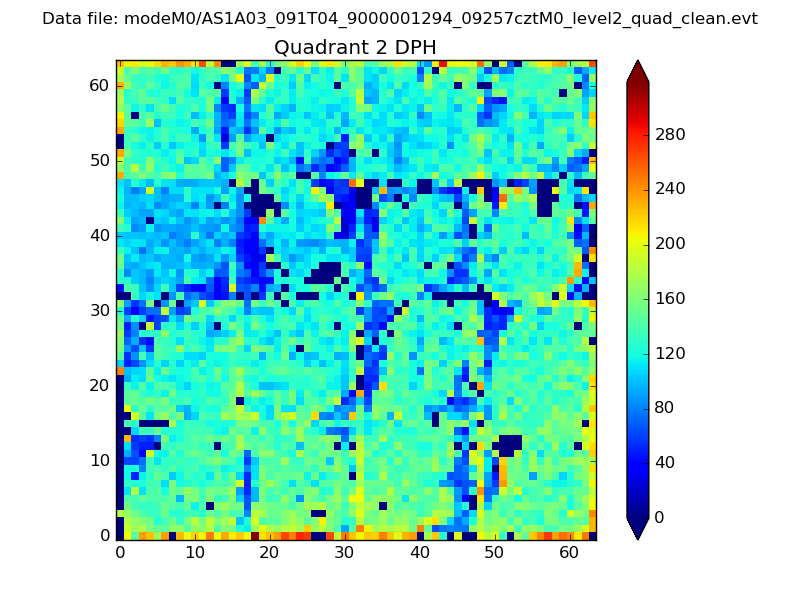 |
Quadrant C |
| Plot type | Count rate plots | Images |
|---|---|---|
| Comparison with Poisson distribution Blue bars denote a histogram of data divided into 1 sec bins. Red curve is a Poisson curve with rate = median count rate of data. |
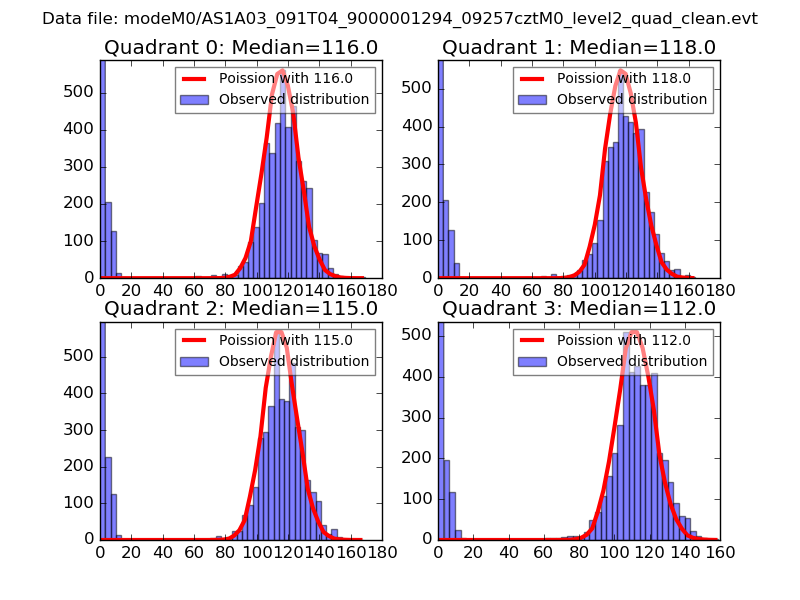 |
 |
| Quadrant-wise count rates Data is divided into 100 sec bins |
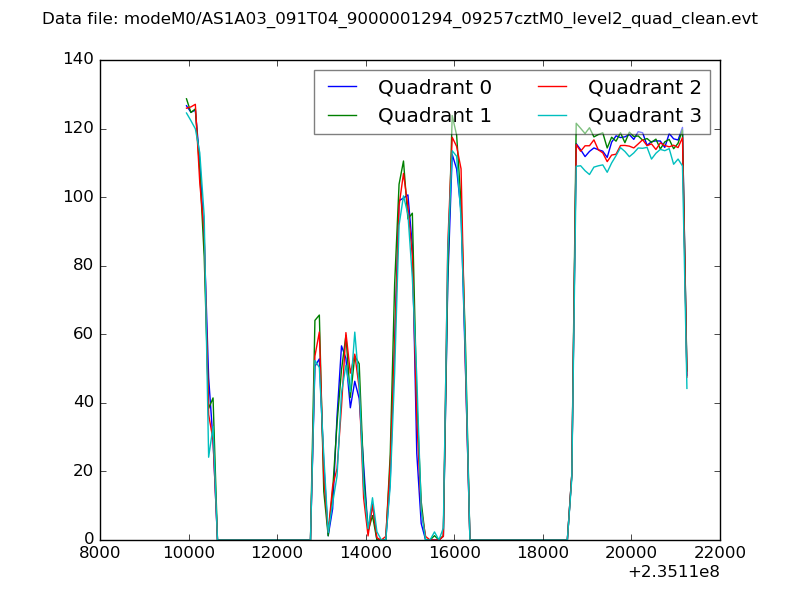 |
|
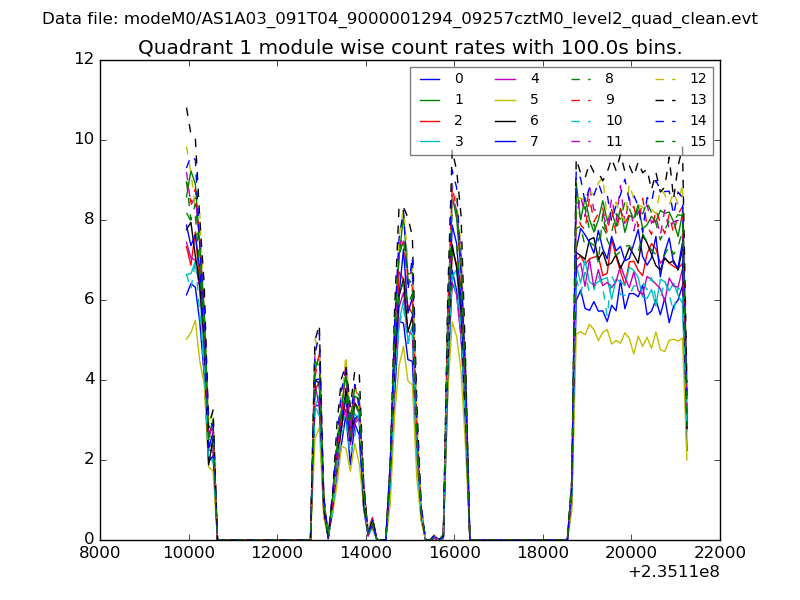
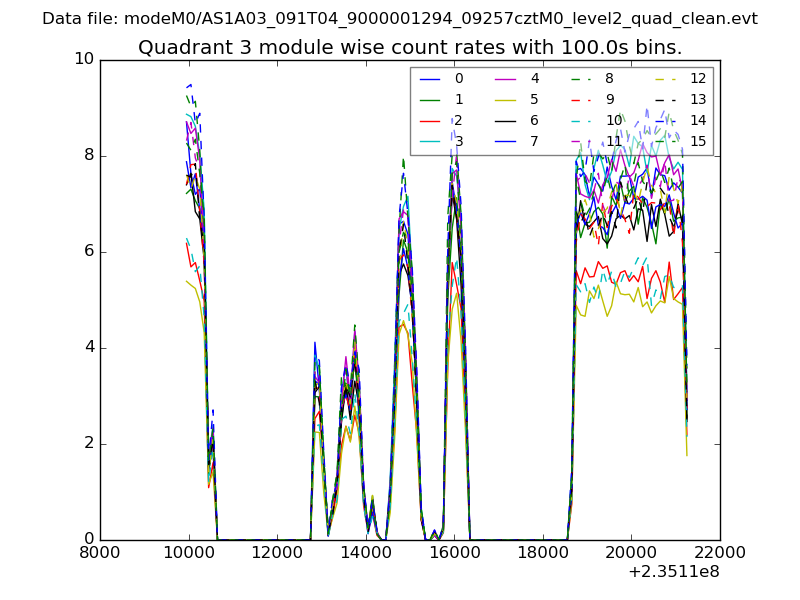
| Module-wise count rates for Quadrant A Data is divided into 100 sec bins |
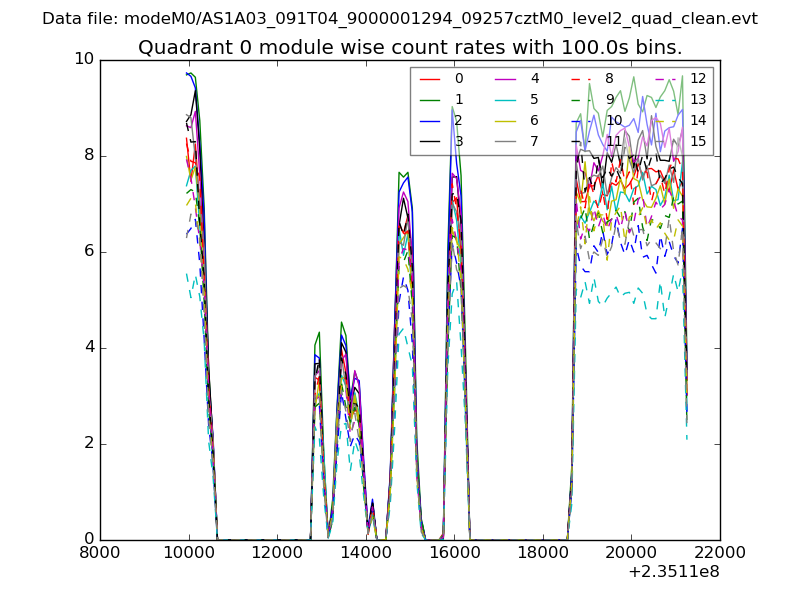 |
 |
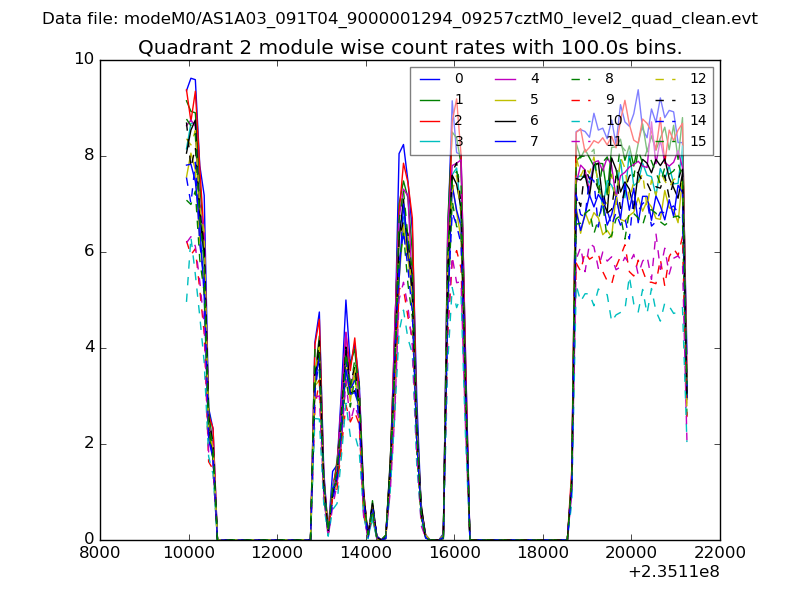
| Module-wise count rates for Quadrant B Data is divided into 100 sec bins |
 |
 |
| Module-wise count rates for Quadrant C Data is divided into 100 sec bins |
 |
 |
| Module-wise count rates for Quadrant D Data is divided into 100 sec bins |
 |
 |
| Parameter | Plot |
|---|---|
| CZT HV Monitor | 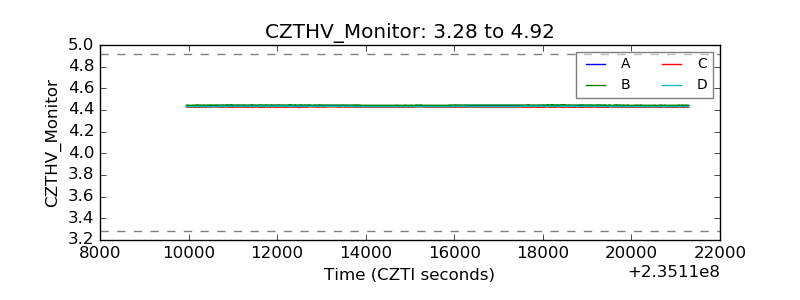 |
| D_VDD | 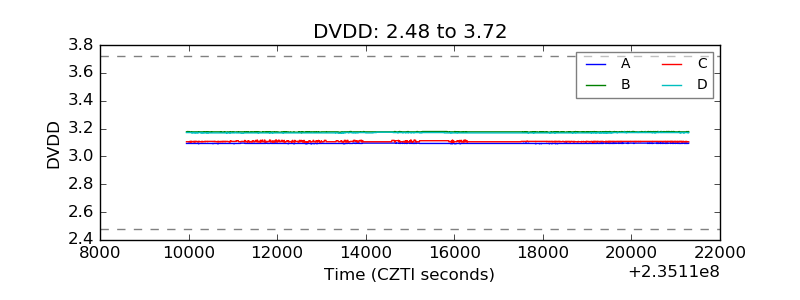 |
| Temperature 1 | 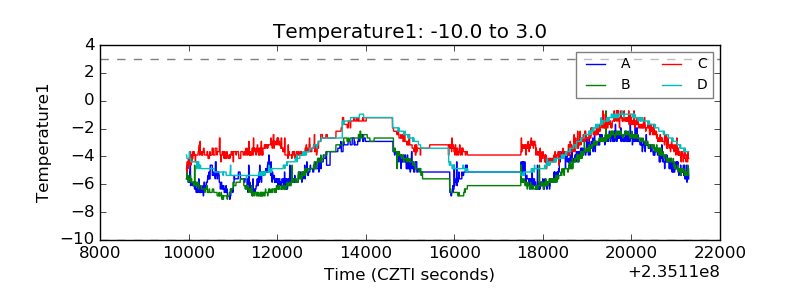 |
| Veto HV Monitor | 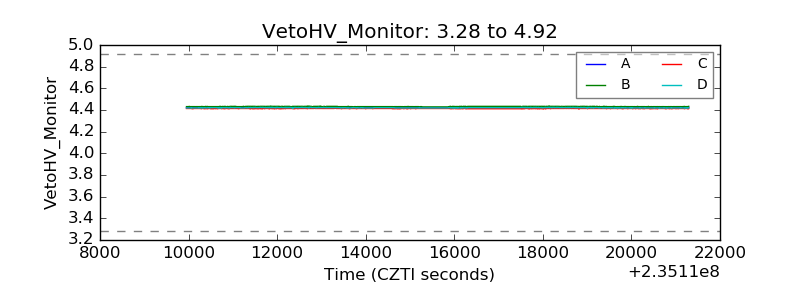 |
| Veto LLD | 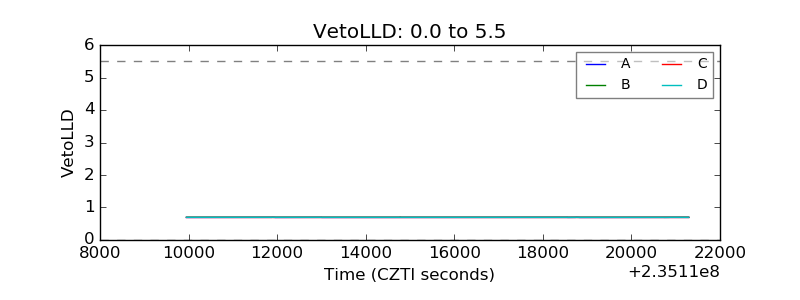 |
| Alpha Counter | 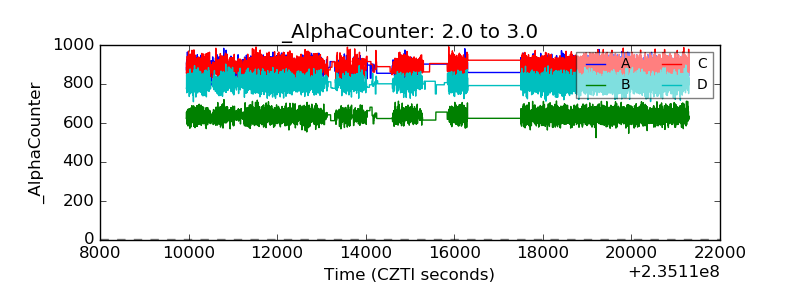 |
| _CPM_Rate | 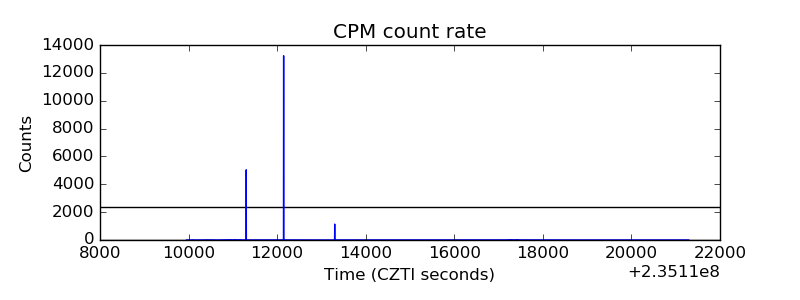 |
| CZT Counter | 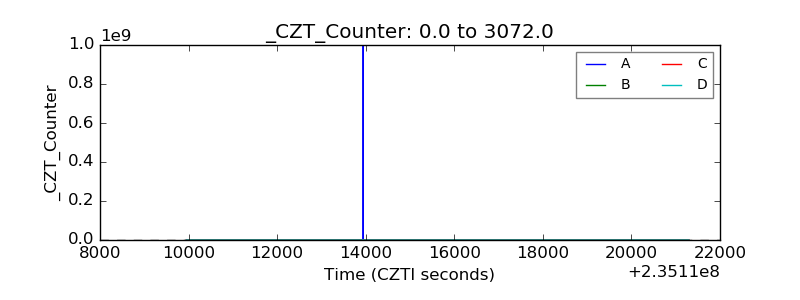 |
| +2.5 Volts monitor |  |
| +5 Volts monitor |  |
| _ROLL_ROT | 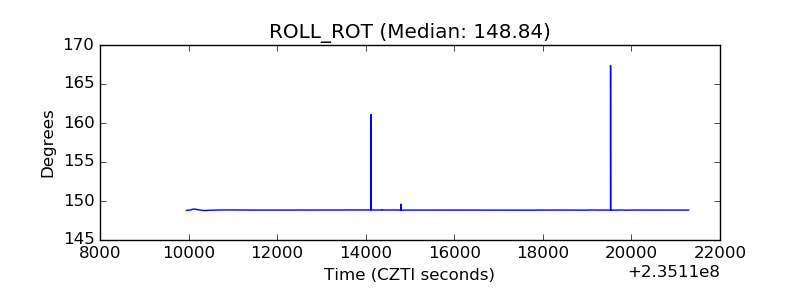 |
| _Roll_DEC | 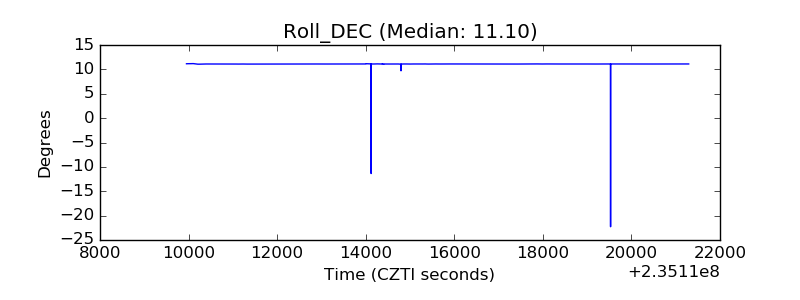 |
| _Roll_RA | 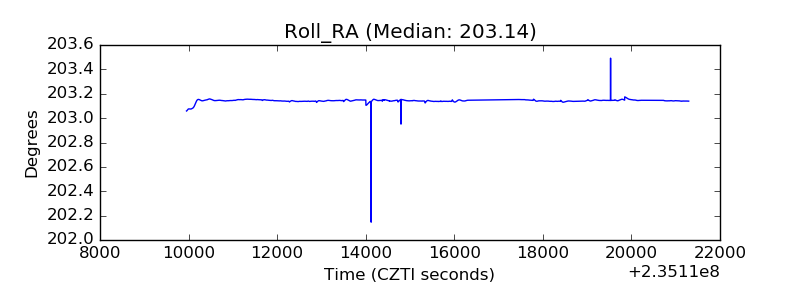 |
| Veto Counter | 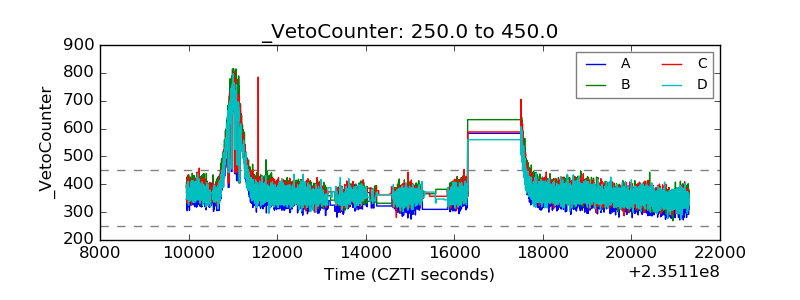 |