| Param | Original file | Final file |
|---|---|---|
| Filename | modeM0/AS1A03_091T05_9000001300cztM0_level2.fits | modeM0/AS1A03_091T05_9000001300cztM0_level2_quad_clean.evt |
| Size (bytes) | 325,126,080 | 274,536,000 |
| Size | 310.1 MB | 261.8 MB |
| Events in quadrant A | 1,938,116 | 1,536,077 |
| Events in quadrant B | 1,928,182 | 1,587,563 |
| Events in quadrant C | 1,948,178 | 1,488,234 |
| Events in quadrant D | 1,678,742 | 1,348,867 |
| Mode SS | |||
|---|---|---|---|
| Quadrant | BADHDUFLAG | Total packets | Discarded packets |
| A | 0 | 698 | 0 |
| B | 0 | 690 | 0 |
| C | 0 | 698 | 0 |
| D | 0 | 698 | 0 |
| Mode M0 | |||
|---|---|---|---|
| Quadrant | BADHDUFLAG | Total packets | Discarded packets |
| A | 0 | 88343 | 0 |
| B | 0 | 73297 | 0 |
| C | 0 | 70809 | 0 |
| D | 0 | 78326 | 0 |
| Mode M9 | |||
|---|---|---|---|
| Quadrant | BADHDUFLAG | Total packets | Discarded packets |
| A | 0 | 62 | 0 |
| B | 0 | 62 | 0 |
| C | 0 | 62 | 0 |
| D | 0 | 62 | 0 |
| Quadrant | Total seconds | Saturated seconds | Saturation percentage |
|---|---|---|---|
| A | 34231 | 1422 | 4.154129% |
| B | 34252 | 635 | 1.853906% |
| C | 34262 | 348 | 1.015703% |
| D | 34248 | 690 | 2.014716% |
Noise dominated data is calculated using 1-second bins in cleaned event files. If a bin has >2000 counts, and if more than 50% of those come from <1% of pixels, then it is considered to be noise-dominated and hence unusable.
| Quadrant | # 1 sec bins | Bins with >0 counts | Bins with >2000 counts | High rate bins dominated by noise | Noise dominated (total time) | Noise dominated (detector-on time) | Marked lightcurve |
|---|---|---|---|---|---|---|---|
| A | 40419 | 34320 | 0 | 0 | 0.00% | 0.00% |  |
| B | 40419 | 34323 | 0 | 0 | 0.00% | 0.00% | 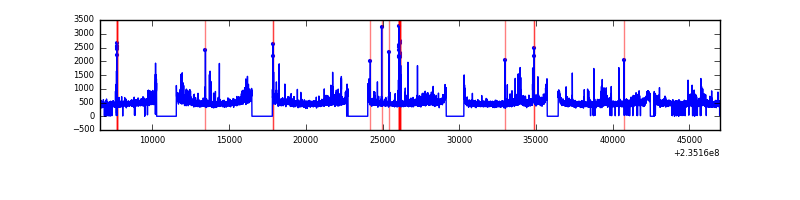 |
| C | 40419 | 34328 | 0 | 0 | 0.00% | 0.00% |  |
| D | 40419 | 34317 | 0 | 0 | 0.00% | 0.00% |  |
Top three noisy pixels from each quadrant. If the there are fewer than three noisy pixels in the level2.evt file, extra rows are filled as -1
| Pixel properties | Quadrant properties | ||||||
|---|---|---|---|---|---|---|---|
| Quadrant | DetID | PixID | Counts | Sigma | Mean | Median | Sigma |
| A | 0 | 29 | 1830 | 10.68 | 504 | 471 | 127.3 |
| A | 7 | 110 | 1626 | 9.08 | 504 | 471 | 127.3 |
| A | 9 | 19 | 1452 | 7.71 | 504 | 471 | 127.3 |
| B | 2 | 9 | 1666 | 11.77 | 507 | 482 | 100.6 |
| B | 2 | 8 | 1303 | 8.16 | 507 | 482 | 100.6 |
| B | 3 | 17 | 1293 | 8.06 | 507 | 482 | 100.6 |
| C | 1 | 80 | 1428 | 7.01 | 514 | 477 | 135.8 |
| C | 1 | 81 | 1376 | 6.62 | 514 | 477 | 135.8 |
| C | 2 | 191 | 1322 | 6.22 | 514 | 477 | 135.8 |
| D | 6 | 231 | 1230 | 6.15 | 477 | 432 | 129.9 |
| D | 3 | 14 | 1229 | 6.14 | 477 | 432 | 129.9 |
| D | 7 | 3 | 1216 | 6.04 | 477 | 432 | 129.9 |
Histogram calculated using DETX and DETY for each event in the final _common_clean file
| Quadrant A | 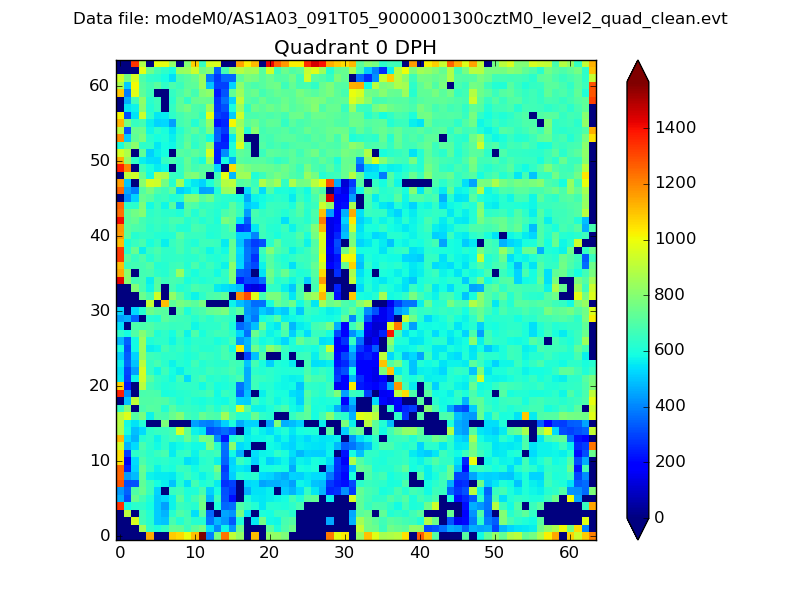 |
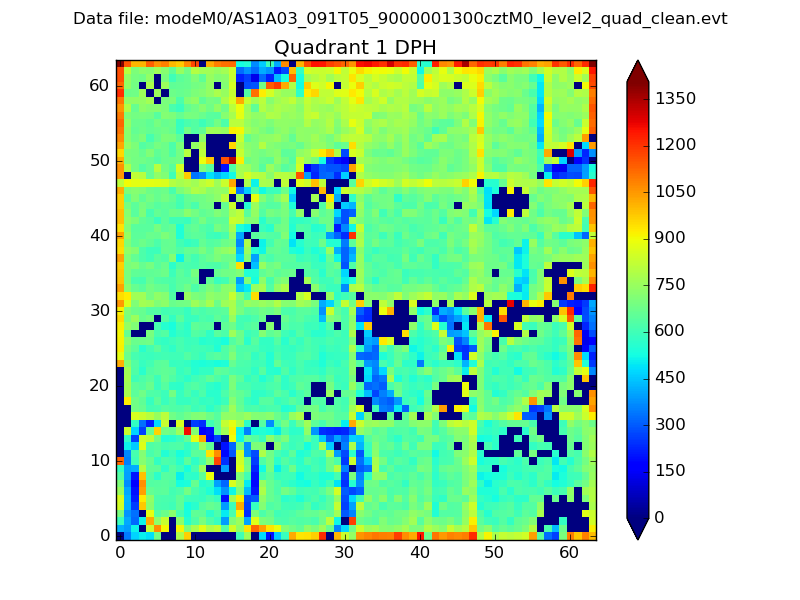 |
Quadrant B |
|---|---|---|---|
| Quadrant D |  |
 |
Quadrant C |
| Plot type | Count rate plots | Images |
|---|---|---|
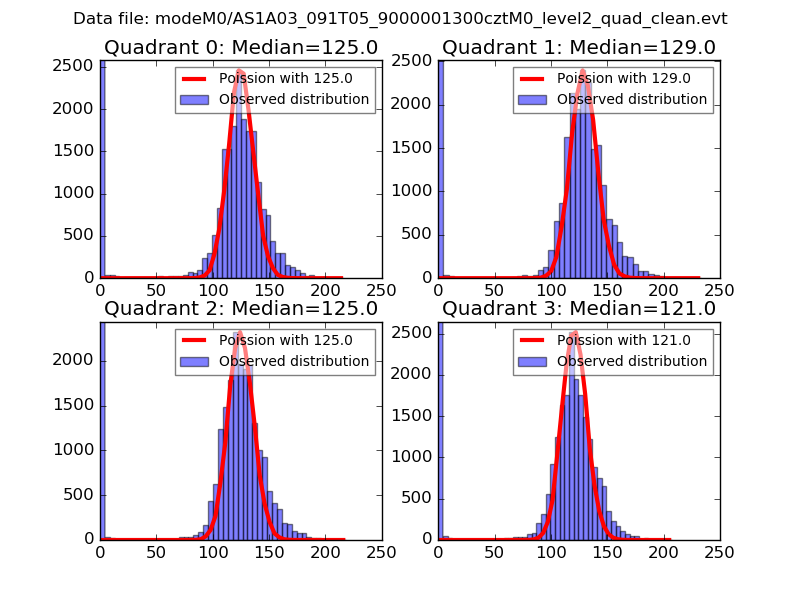
| Comparison with Poisson distribution Blue bars denote a histogram of data divided into 1 sec bins. Red curve is a Poisson curve with rate = median count rate of data. |
 |
 |
| Quadrant-wise count rates Data is divided into 100 sec bins |
 |
|
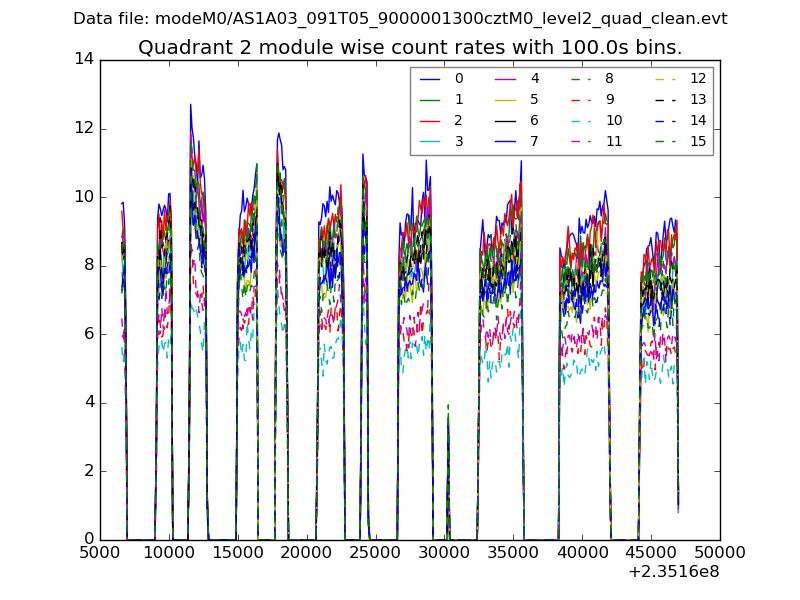
| Module-wise count rates for Quadrant A Data is divided into 100 sec bins |
 |
 |
| Module-wise count rates for Quadrant B Data is divided into 100 sec bins |
 |
 |
| Module-wise count rates for Quadrant C Data is divided into 100 sec bins |
 |
 |
| Module-wise count rates for Quadrant D Data is divided into 100 sec bins |
 |
 |
| Parameter | Plot |
|---|---|
| CZT HV Monitor |  |
| D_VDD |  |
| Temperature 1 |  |
| Veto HV Monitor |  |
| Veto LLD | 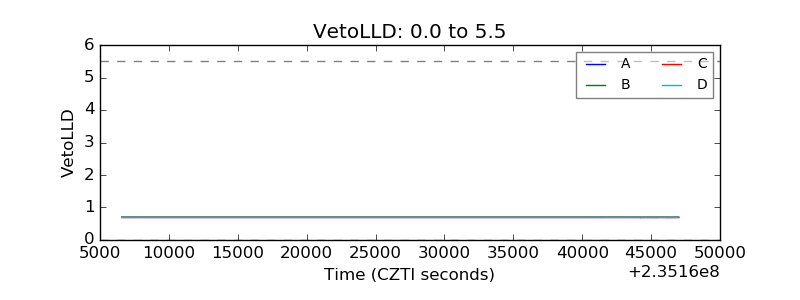 |
| Alpha Counter |  |
| _CPM_Rate |  |
| CZT Counter |  |
| +2.5 Volts monitor |  |
| +5 Volts monitor |  |
| _ROLL_ROT |  |
| _Roll_DEC |  |
| _Roll_RA |  |
| Veto Counter | 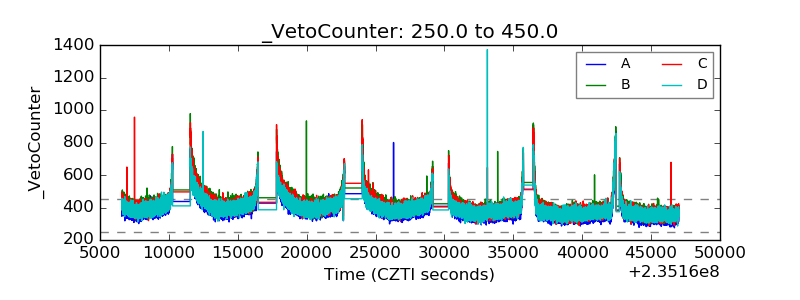 |