| Param | Original file | Final file |
|---|---|---|
| Filename | modeM0/AS1A03_091T05_9000001300_09262cztM0_level2.evt | modeM0/AS1A03_091T05_9000001300_09262cztM0_level2_quad_clean.evt |
| Size (bytes) | 400,216,320 | 59,996,160 |
| Size | 381.7 MB | 57.2 MB |
| Events in quadrant A | 4,293,416 | 355,196 |
| Events in quadrant B | 2,514,205 | 386,066 |
| Events in quadrant C | 2,413,973 | 372,936 |
| Events in quadrant D | 2,563,731 | 356,430 |
| Mode SS | |||
|---|---|---|---|
| Quadrant | BADHDUFLAG | Total packets | Discarded packets |
| A | 0 | 102 | 0 |
| B | 0 | 102 | 0 |
| C | 0 | 102 | 0 |
| D | 0 | 102 | 0 |
| Mode M0 | |||
|---|---|---|---|
| Quadrant | BADHDUFLAG | Total packets | Discarded packets |
| A | 0 | 16282 | 126 |
| B | 0 | 10721 | 66 |
| C | 0 | 10428 | 58 |
| D | 0 | 11090 | 70 |
| Mode M9 | |||
|---|---|---|---|
| Quadrant | BADHDUFLAG | Total packets | Discarded packets |
| A | 0 | 13 | 0 |
| B | 0 | 13 | 0 |
| C | 0 | 13 | 0 |
| D | 0 | 13 | 0 |
| Quadrant | Total seconds | Saturated seconds | Saturation percentage |
|---|---|---|---|
| A | 4919 | 440 | 8.944908% |
| B | 4923 | 54 | 1.096892% |
| C | 4927 | 18 | 0.365334% |
| D | 4927 | 46 | 0.933631% |
Noise dominated data is calculated using 1-second bins in cleaned event files. If a bin has >2000 counts, and if more than 50% of those come from <1% of pixels, then it is considered to be noise-dominated and hence unusable.
| Quadrant | # 1 sec bins | Bins with >0 counts | Bins with >2000 counts | High rate bins dominated by noise | Noise dominated (total time) | Noise dominated (detector-on time) | Marked lightcurve |
|---|---|---|---|---|---|---|---|
| A | 6244 | 4953 | 379 | 379 | 6.07% | 7.65% |  |
| B | 6244 | 4953 | 5 | 5 | 0.08% | 0.10% |  |
| C | 6244 | 4953 | 5 | 5 | 0.08% | 0.10% |  |
| D | 6244 | 4954 | 39 | 39 | 0.62% | 0.79% |  |
Top three noisy pixels from each quadrant. If the there are fewer than three noisy pixels in the level2.evt file, extra rows are filled as -1
| Pixel properties | Quadrant properties | ||||||
|---|---|---|---|---|---|---|---|
| Quadrant | DetID | PixID | Counts | Sigma | Mean | Median | Sigma |
| A | 5 | 16 | 1406314 | 11935.87 | 579 | 569 | 117.8 |
| A | 8 | 5 | 445161 | 3774.93 | 579 | 569 | 117.8 |
| A | 4 | 2 | 160262 | 1355.92 | 579 | 569 | 117.8 |
| B | 0 | 214 | 40758 | 348.43 | 607 | 591 | 115.3 |
| B | 0 | 245 | 30614 | 260.44 | 607 | 591 | 115.3 |
| B | 0 | 219 | 30513 | 259.56 | 607 | 591 | 115.3 |
| C | 9 | 68 | 87108 | 638.12 | 584 | 588 | 135.6 |
| C | 14 | 234 | 42789 | 311.25 | 584 | 588 | 135.6 |
| C | 8 | 222 | 4902 | 31.82 | 584 | 588 | 135.6 |
| D | 2 | 136 | 194098 | 1322.44 | 574 | 558 | 146.4 |
| D | 1 | 52 | 109954 | 747.49 | 574 | 558 | 146.4 |
| D | 7 | 71 | 28383 | 190.13 | 574 | 558 | 146.4 |
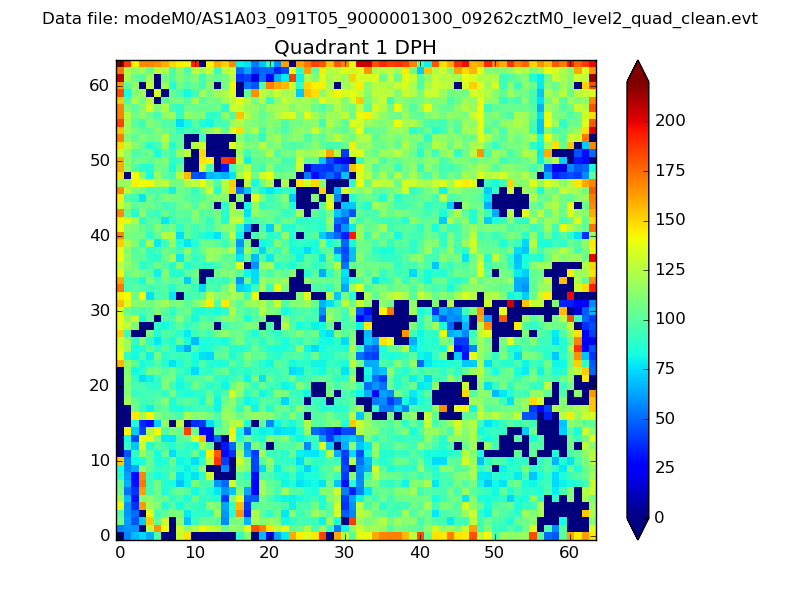
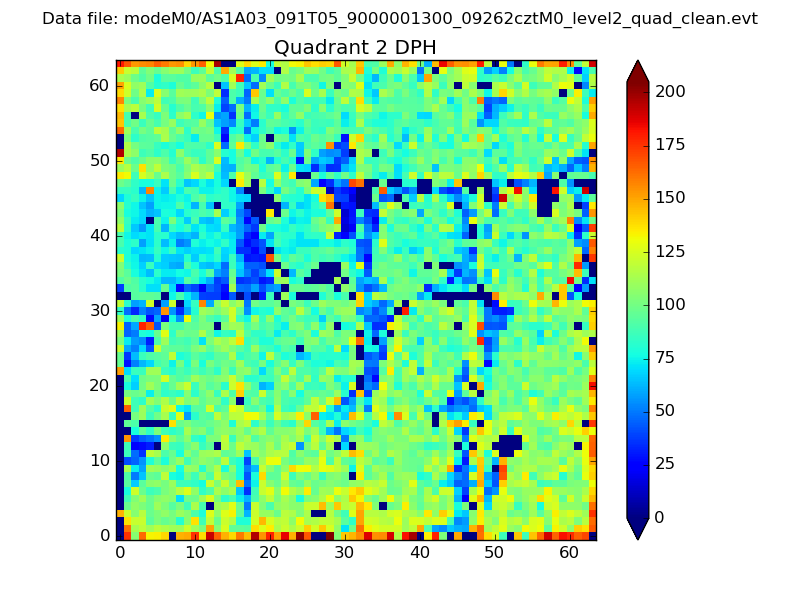
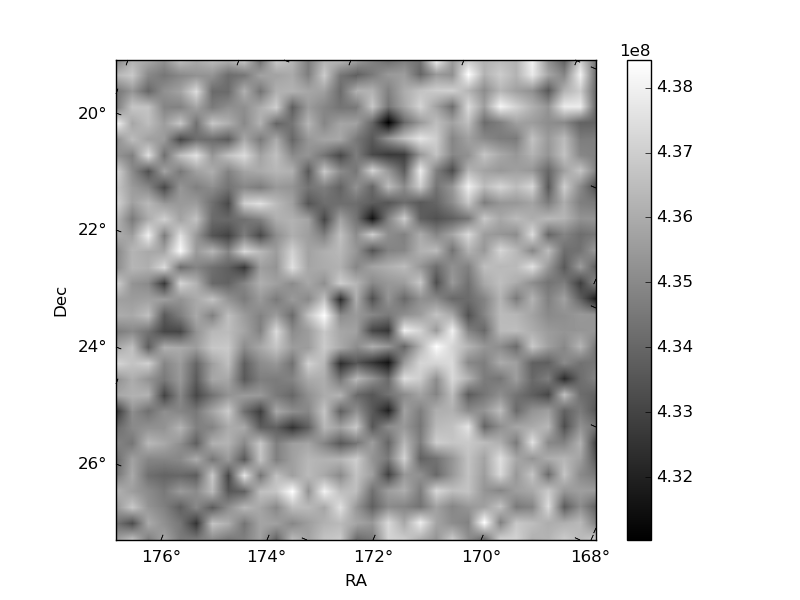
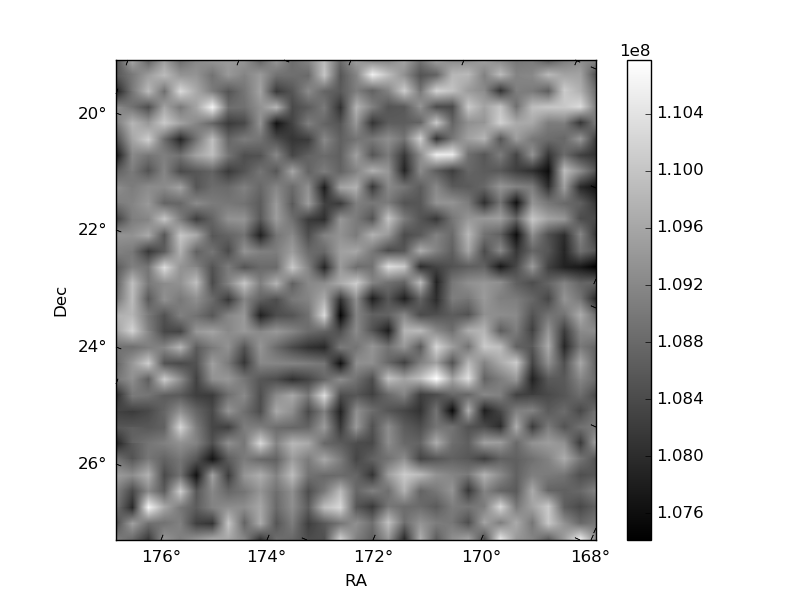
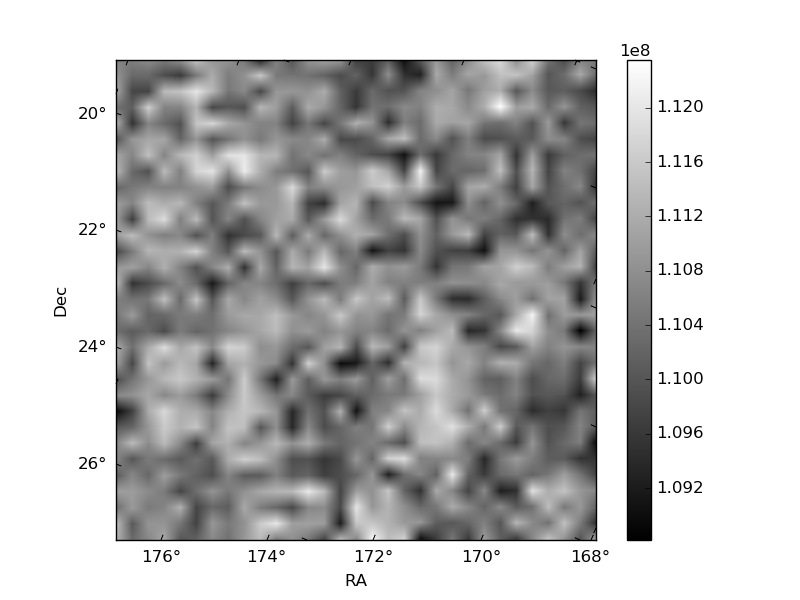
Histogram calculated using DETX and DETY for each event in the final _common_clean file
| Quadrant A |  |
 |
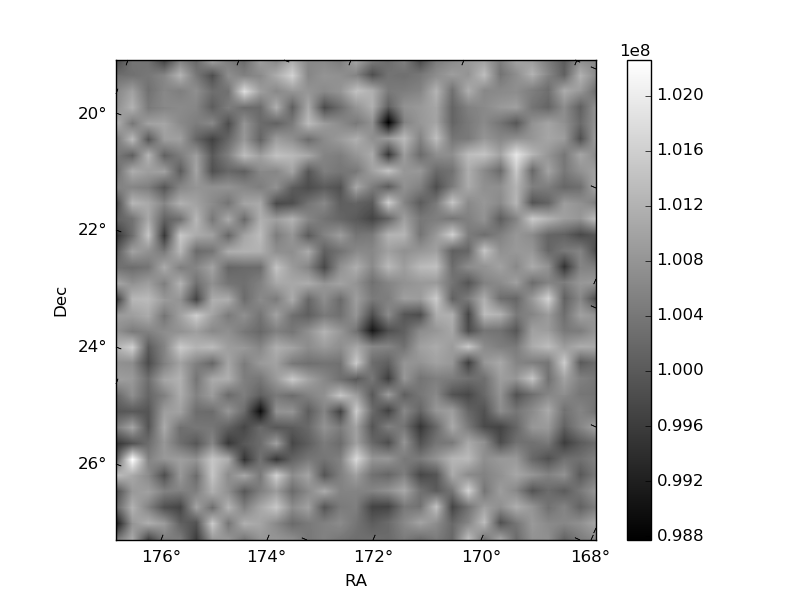
Quadrant B |
|---|---|---|---|
| Quadrant D | 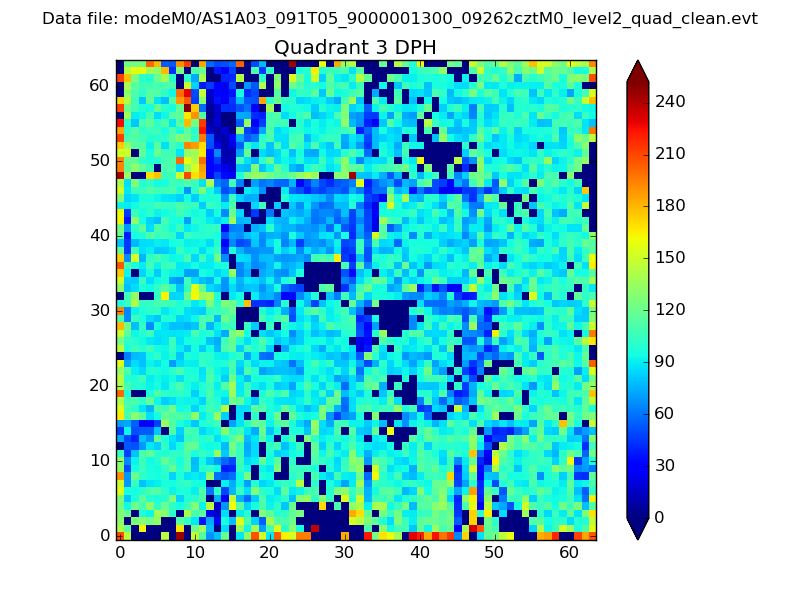 |
 |
Quadrant C |
| Plot type | Count rate plots | Images |
|---|---|---|
| Comparison with Poisson distribution Blue bars denote a histogram of data divided into 1 sec bins. Red curve is a Poisson curve with rate = median count rate of data. |
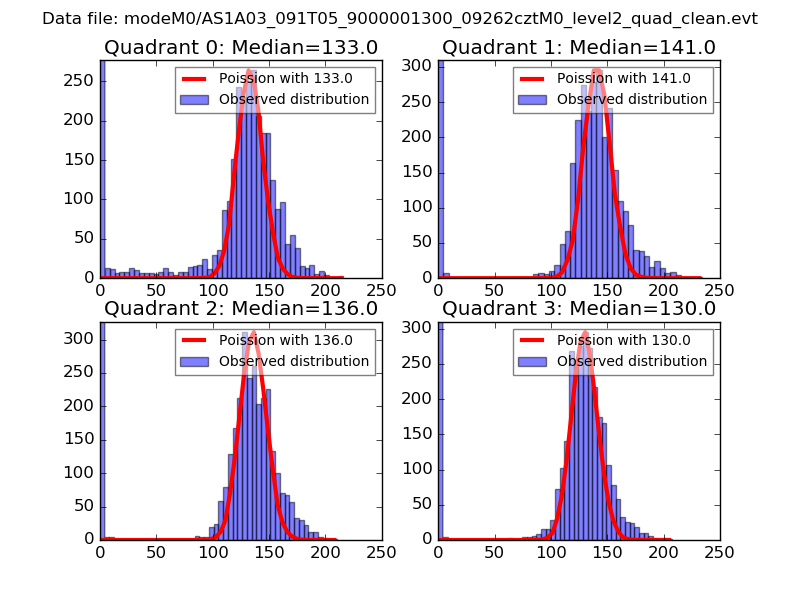 |
 |
| Quadrant-wise count rates Data is divided into 100 sec bins |
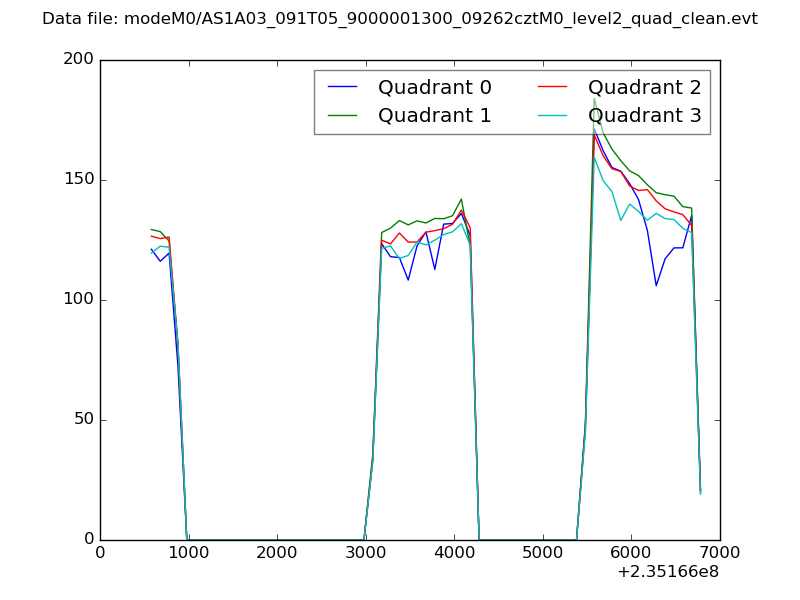 |
|
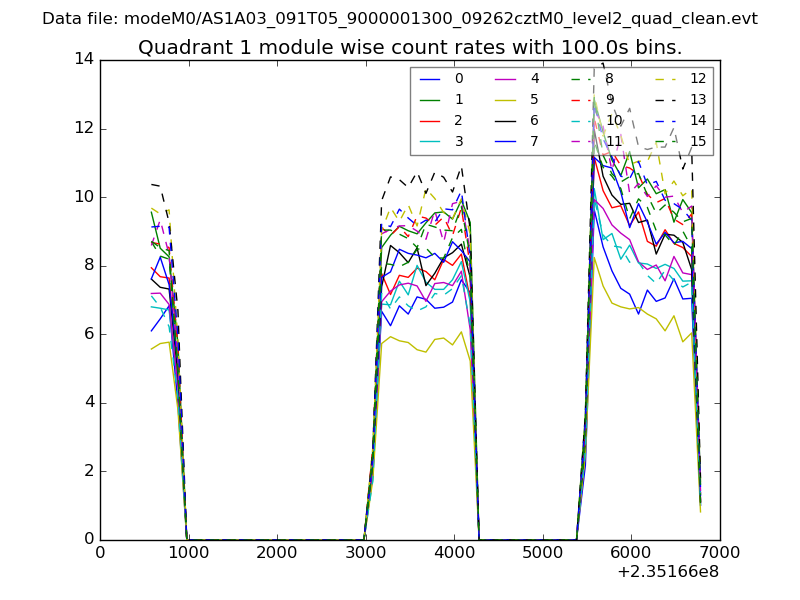
| Module-wise count rates for Quadrant A Data is divided into 100 sec bins |
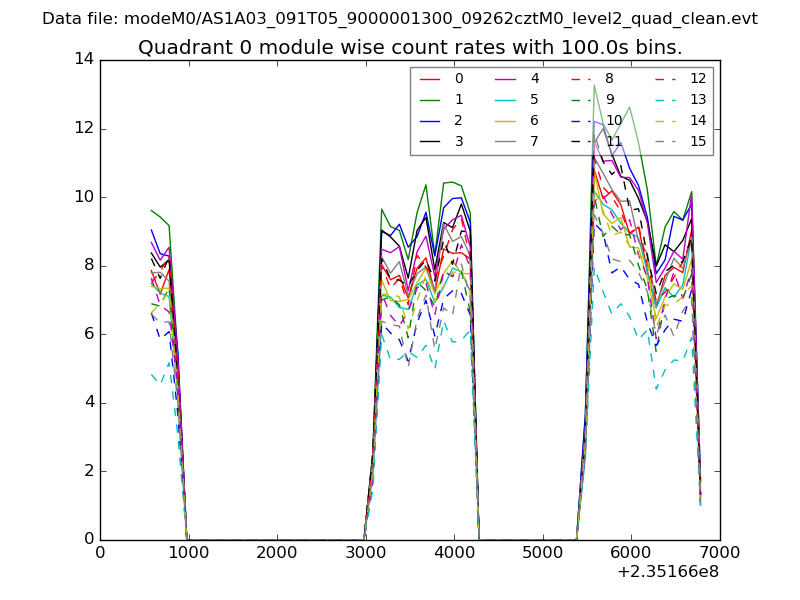 |
 |
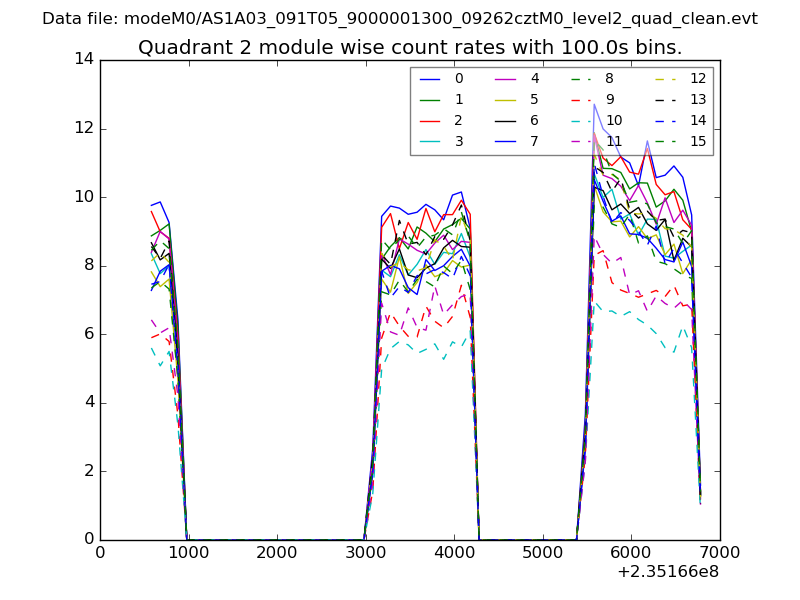
| Module-wise count rates for Quadrant B Data is divided into 100 sec bins |
 |
 |
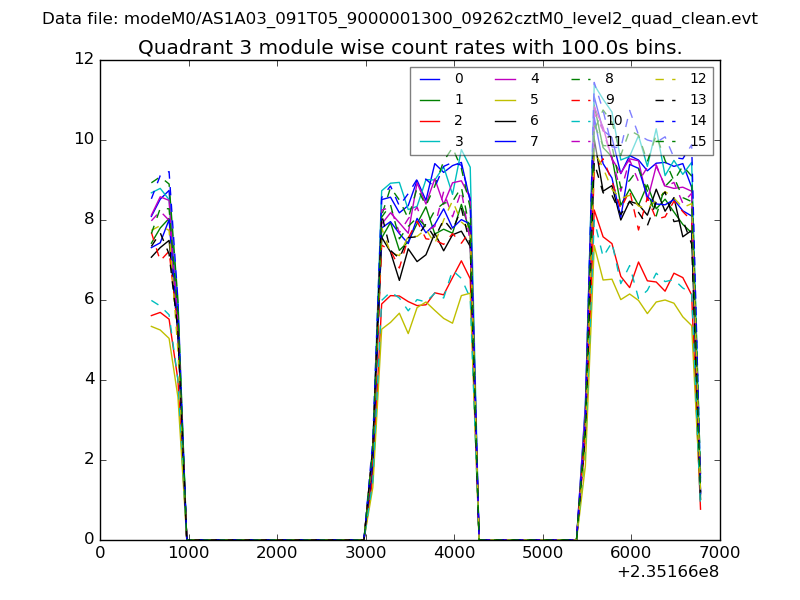
| Module-wise count rates for Quadrant C Data is divided into 100 sec bins |
 |
 |
| Module-wise count rates for Quadrant D Data is divided into 100 sec bins |
 |
 |
| Parameter | Plot |
|---|---|
| CZT HV Monitor |  |
| D_VDD | 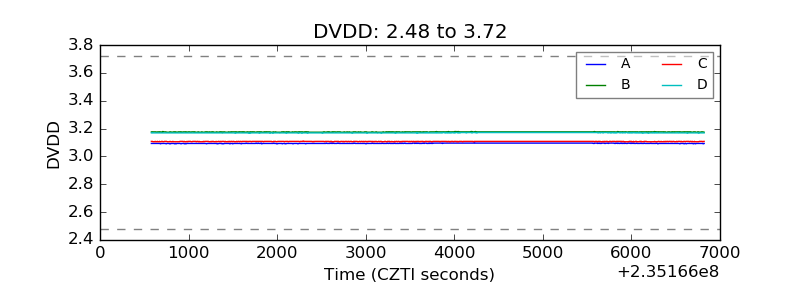 |
| Temperature 1 | 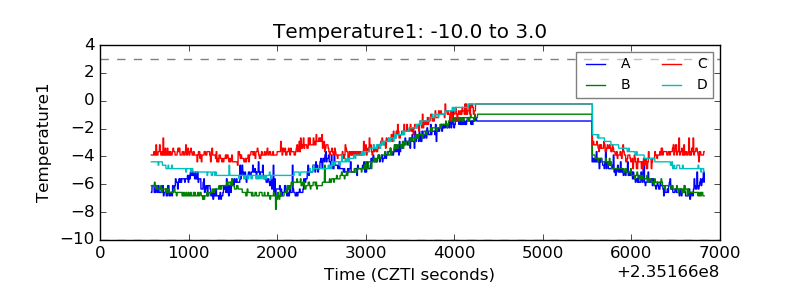 |
| Veto HV Monitor | 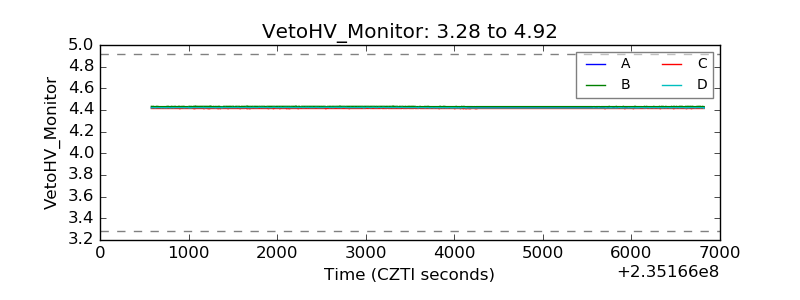 |
| Veto LLD |  |
| Alpha Counter | 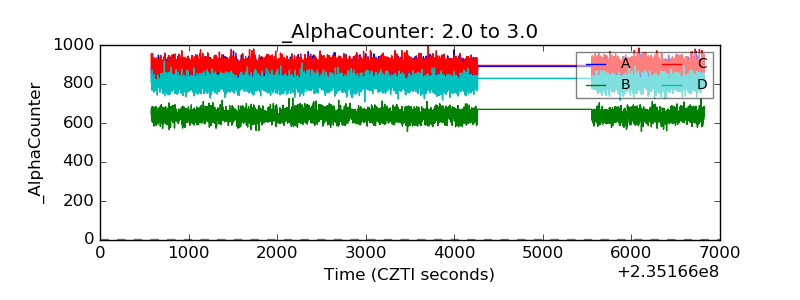 |
| _CPM_Rate | 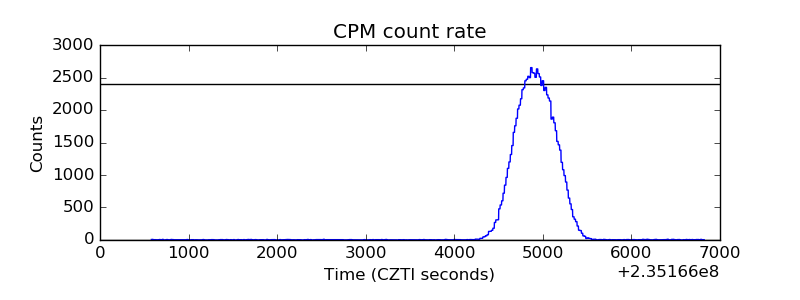 |
| CZT Counter | 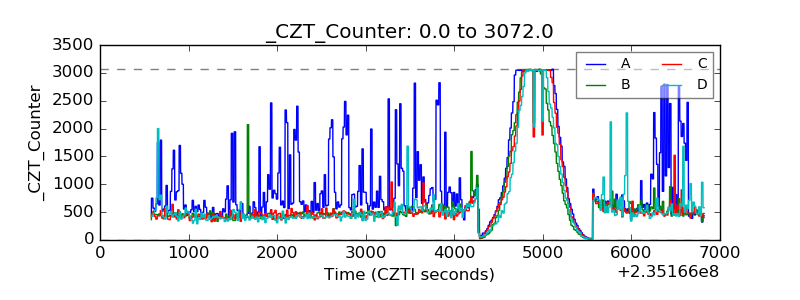 |
| +2.5 Volts monitor |  |
| +5 Volts monitor |  |
| _ROLL_ROT | 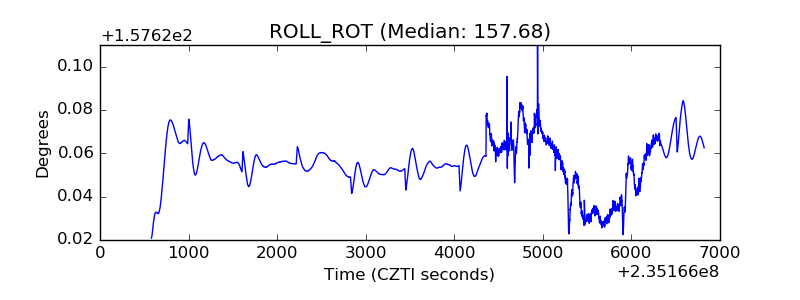 |
| _Roll_DEC | 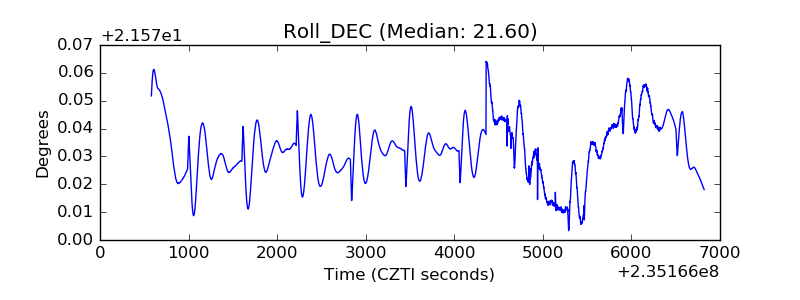 |
| _Roll_RA | 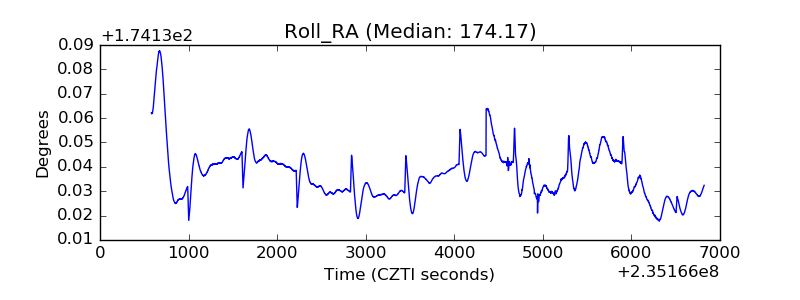 |
| Veto Counter | 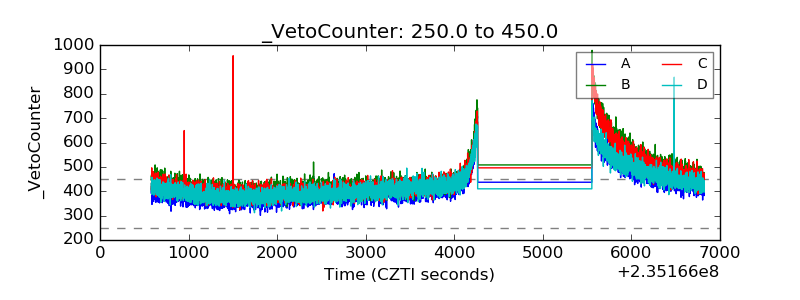 |