| Param | Original file | Final file |
|---|---|---|
| Filename | modeM0/AS1A03_091T05_9000001300_09263cztM0_level2.evt | modeM0/AS1A03_091T05_9000001300_09263cztM0_level2_quad_clean.evt |
| Size (bytes) | 98,389,440 | 22,682,880 |
| Size | 93.8 MB | 21.6 MB |
| Events in quadrant A | 779,400 | 141,506 |
| Events in quadrant B | 734,772 | 152,901 |
| Events in quadrant C | 689,395 | 151,247 |
| Events in quadrant D | 679,455 | 138,355 |
| Mode SS | |||
|---|---|---|---|
| Quadrant | BADHDUFLAG | Total packets | Discarded packets |
| A | 0 | 118 | 86 |
| B | 0 | 110 | 85 |
| C | 0 | 114 | 84 |
| D | 0 | 117 | 83 |
| Mode M0 | |||
|---|---|---|---|
| Quadrant | BADHDUFLAG | Total packets | Discarded packets |
| A | 0 | 15202 | 12088 |
| B | 0 | 12739 | 9749 |
| C | 0 | 12001 | 9105 |
| D | 0 | 13387 | 10498 |
| Mode M9 | |||
|---|---|---|---|
| Quadrant | BADHDUFLAG | Total packets | Discarded packets |
| A | 0 | 20 | 7 |
| B | 0 | 20 | 7 |
| C | 0 | 20 | 6 |
| D | 0 | 21 | 9 |
| Quadrant | Total seconds | Saturated seconds | Saturation percentage |
|---|---|---|---|
| A | 1297 | 12 | 0.925212% |
| B | 1358 | 4 | 0.294551% |
| C | 1393 | 2 | 0.143575% |
| D | 1364 | 2 | 0.146628% |
Noise dominated data is calculated using 1-second bins in cleaned event files. If a bin has >2000 counts, and if more than 50% of those come from <1% of pixels, then it is considered to be noise-dominated and hence unusable.
| Quadrant | # 1 sec bins | Bins with >0 counts | Bins with >2000 counts | High rate bins dominated by noise | Noise dominated (total time) | Noise dominated (detector-on time) | Marked lightcurve |
|---|---|---|---|---|---|---|---|
| A | 7453 | 1823 | 10 | 10 | 0.13% | 0.55% | 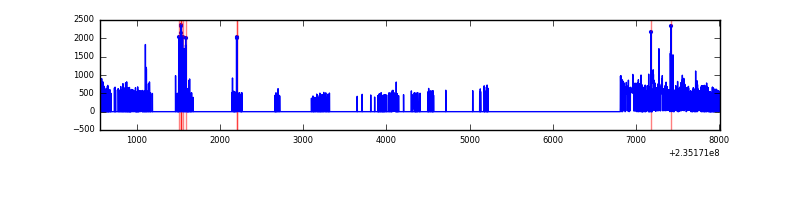 |
| B | 7459 | 1878 | 0 | 0 | 0.00% | 0.00% | 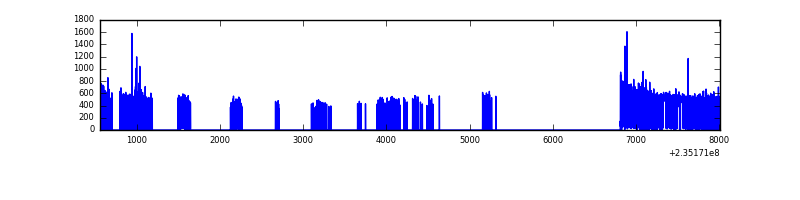 |
| C | 7458 | 1970 | 1 | 1 | 0.01% | 0.05% | 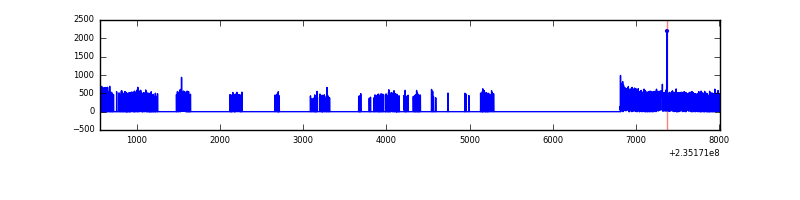 |
| D | 7459 | 1898 | 0 | 0 | 0.00% | 0.00% | 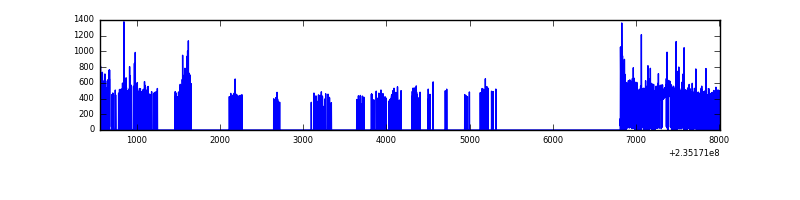 |
Top three noisy pixels from each quadrant. If the there are fewer than three noisy pixels in the level2.evt file, extra rows are filled as -1
| Pixel properties | Quadrant properties | ||||||
|---|---|---|---|---|---|---|---|
| Quadrant | DetID | PixID | Counts | Sigma | Mean | Median | Sigma |
| A | 8 | 5 | 75262 | 2159.43 | 164 | 161 | 34.8 |
| A | 5 | 16 | 53030 | 1520.18 | 164 | 161 | 34.8 |
| A | 1 | 162 | 7557 | 212.66 | 164 | 161 | 34.8 |
| B | 0 | 245 | 13662 | 382.21 | 176 | 173 | 35.3 |
| B | 0 | 219 | 13090 | 366.01 | 176 | 173 | 35.3 |
| B | 0 | 214 | 6954 | 192.14 | 176 | 173 | 35.3 |
| C | 9 | 68 | 11328 | 272.02 | 172 | 173 | 41.0 |
| C | 14 | 234 | 4074 | 95.13 | 172 | 173 | 41.0 |
| C | 13 | 61 | 1262 | 26.56 | 172 | 173 | 41.0 |
| D | 7 | 71 | 17844 | 383.51 | 165 | 161 | 46.1 |
| D | 1 | 52 | 14753 | 316.47 | 165 | 161 | 46.1 |
| D | 2 | 136 | 12058 | 258.02 | 165 | 161 | 46.1 |
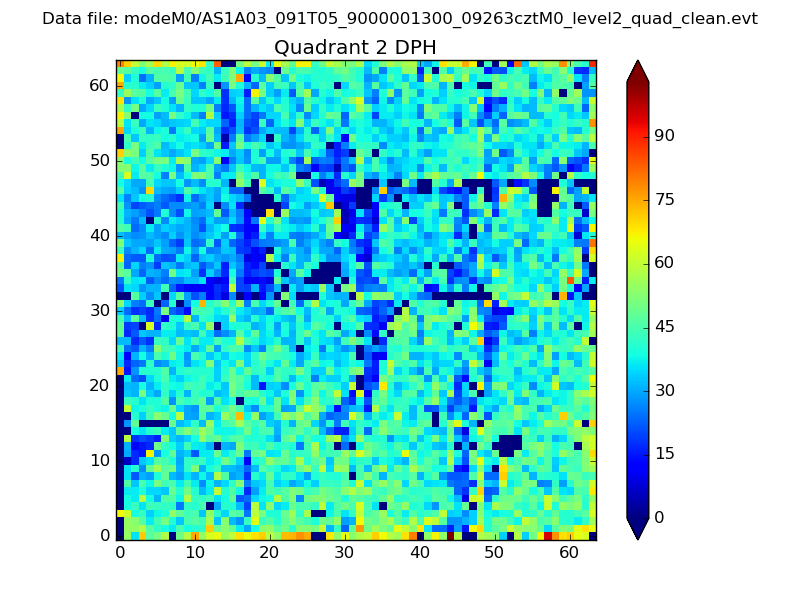
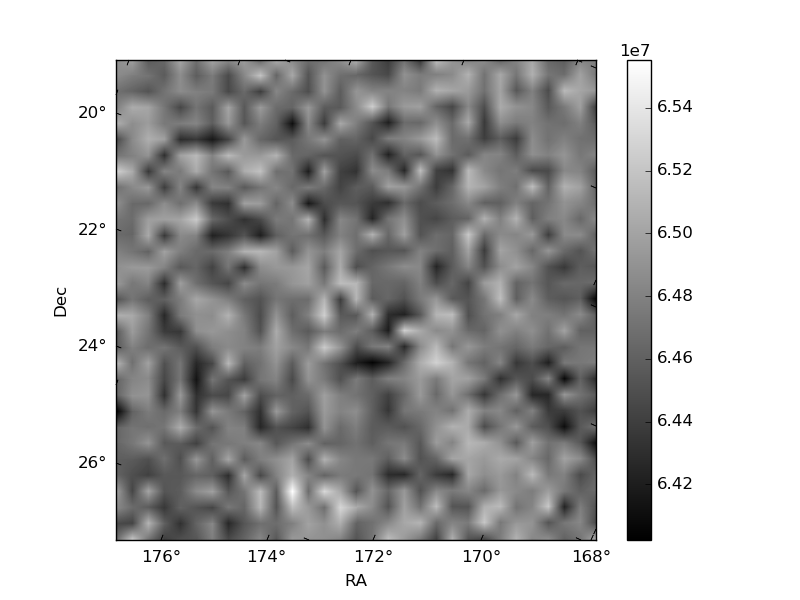
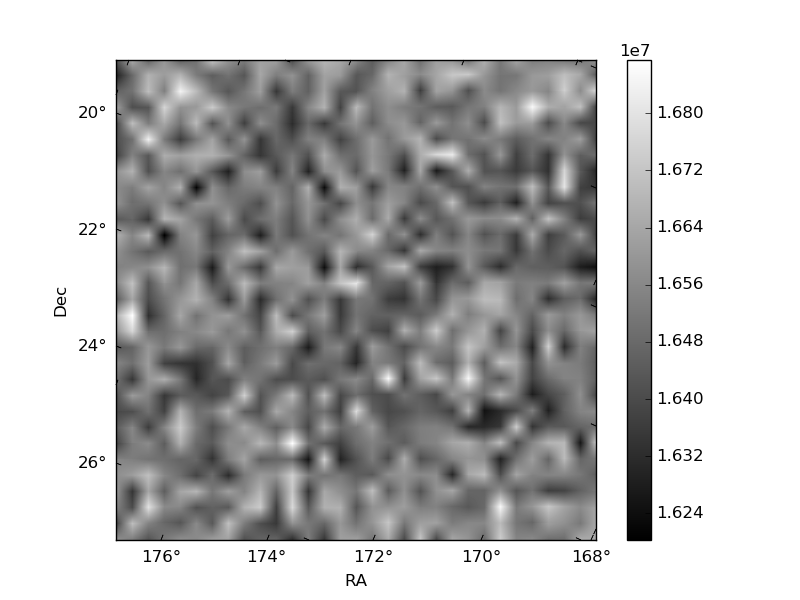
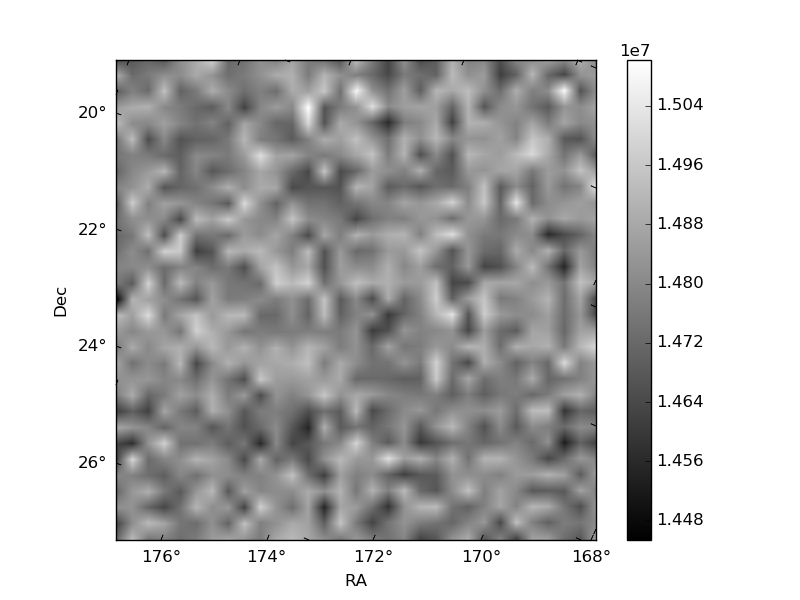
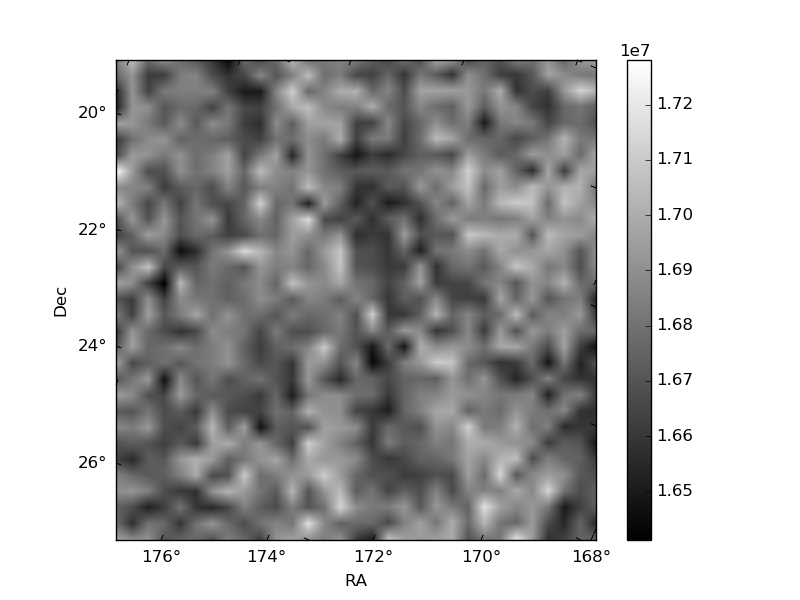
Histogram calculated using DETX and DETY for each event in the final _common_clean file
| Quadrant A | 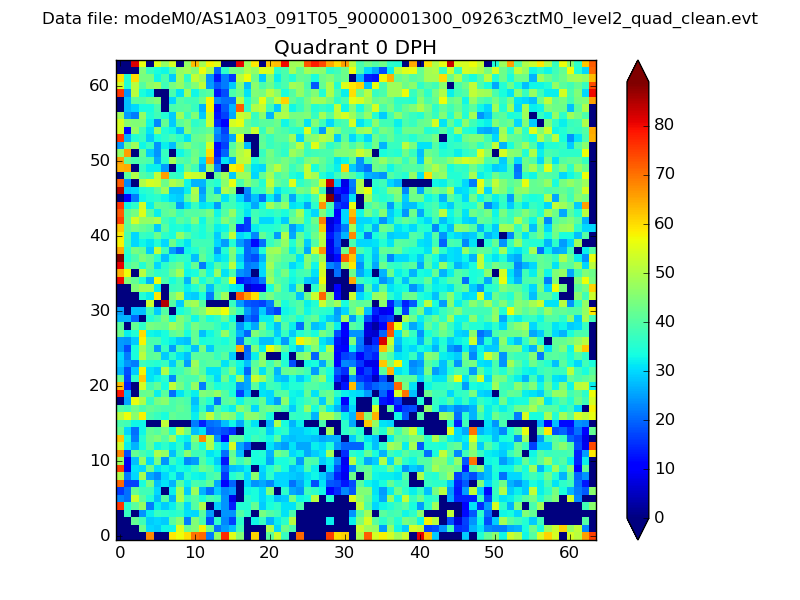 |
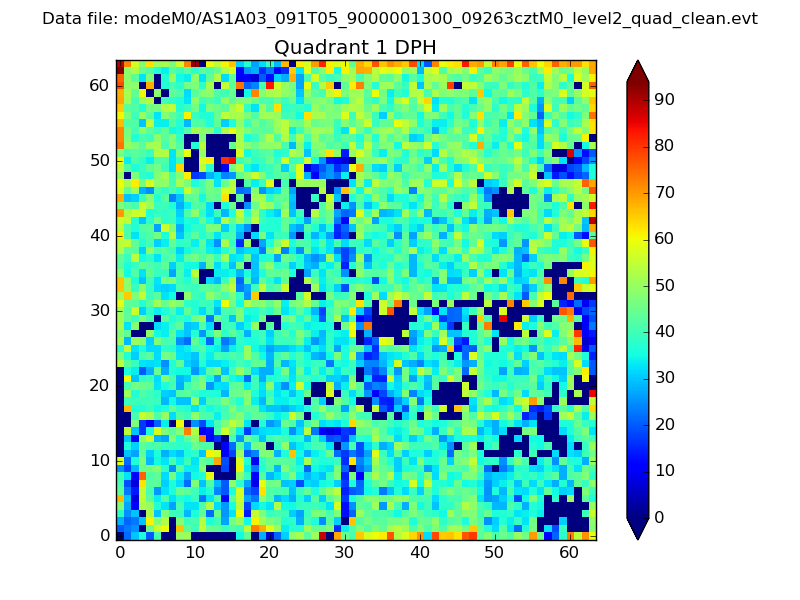 |
Quadrant B |
|---|---|---|---|
| Quadrant D | 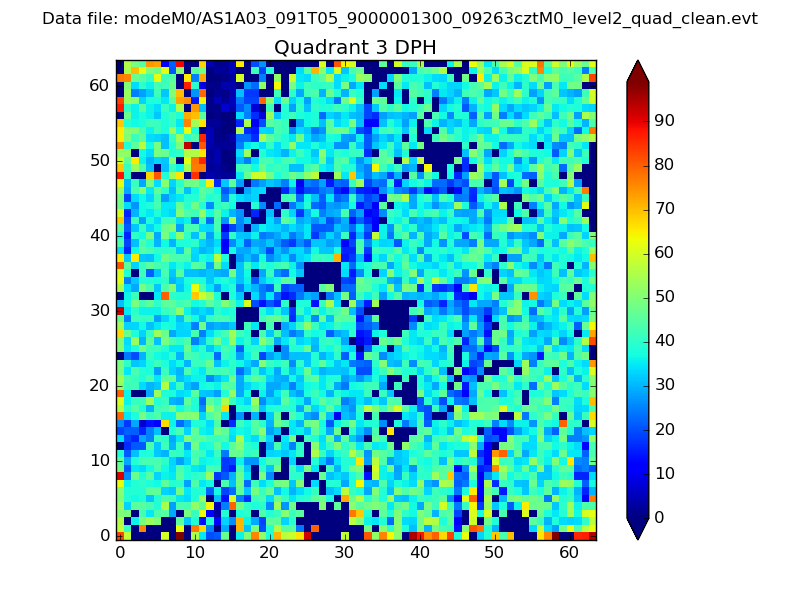 |
 |
Quadrant C |
| Plot type | Count rate plots | Images |
|---|---|---|
| Comparison with Poisson distribution Blue bars denote a histogram of data divided into 1 sec bins. Red curve is a Poisson curve with rate = median count rate of data. |
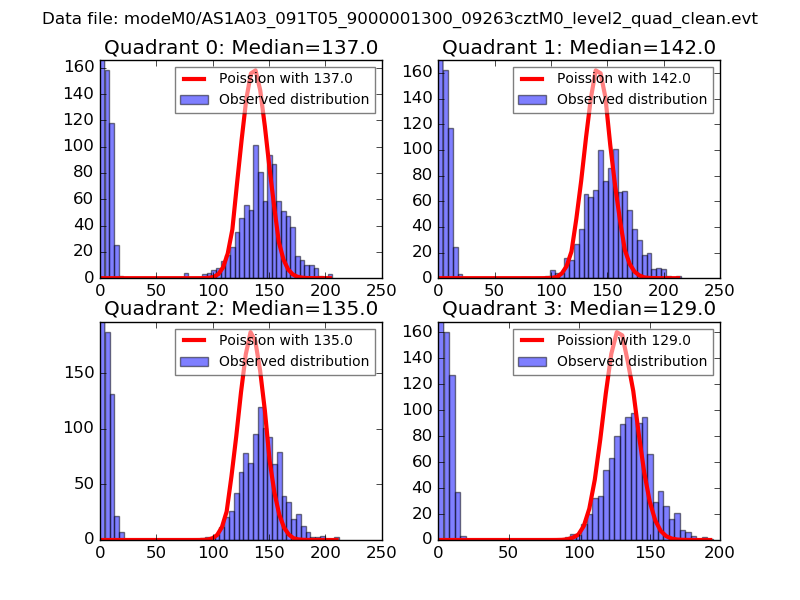 |
 |
| Quadrant-wise count rates Data is divided into 100 sec bins |
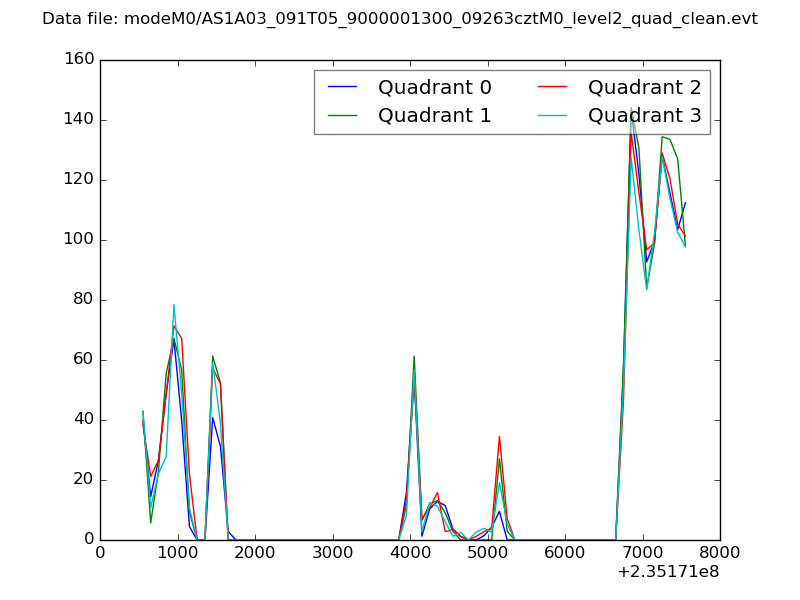 |
|
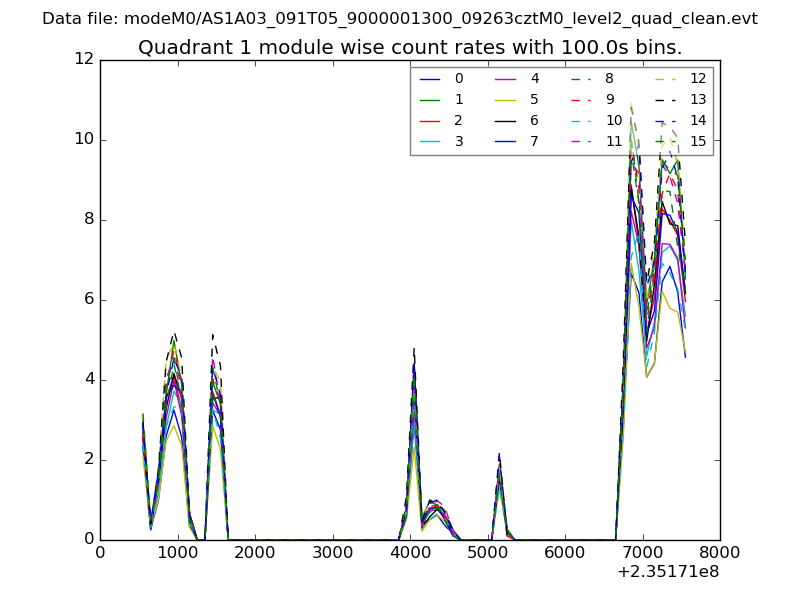
| Module-wise count rates for Quadrant A Data is divided into 100 sec bins |
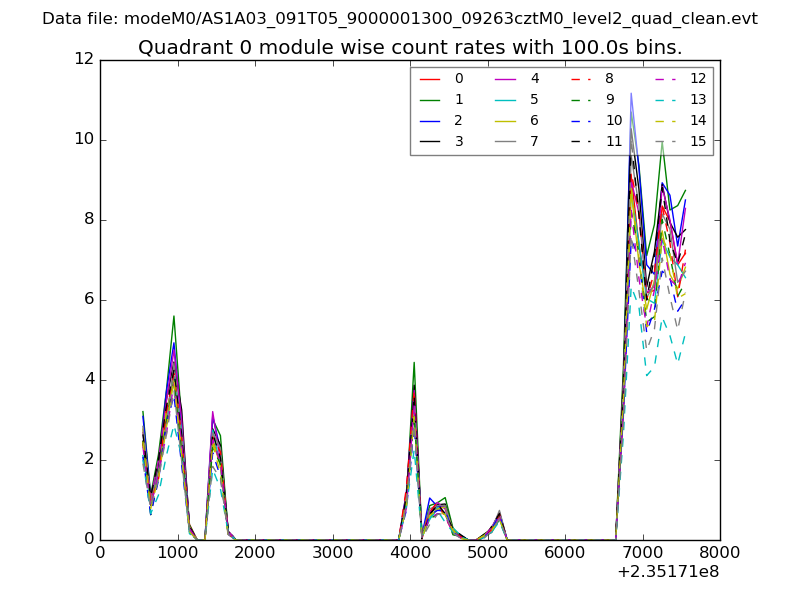 |
 |
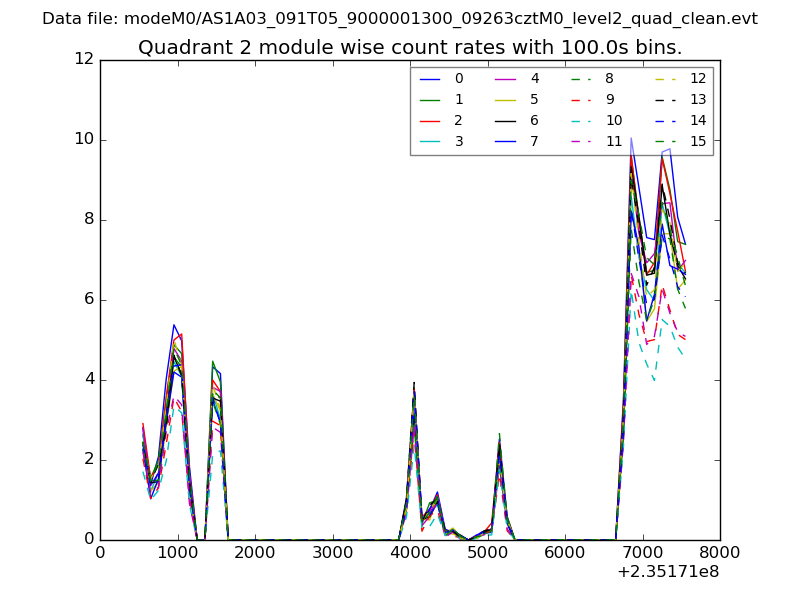
| Module-wise count rates for Quadrant B Data is divided into 100 sec bins |
 |
 |
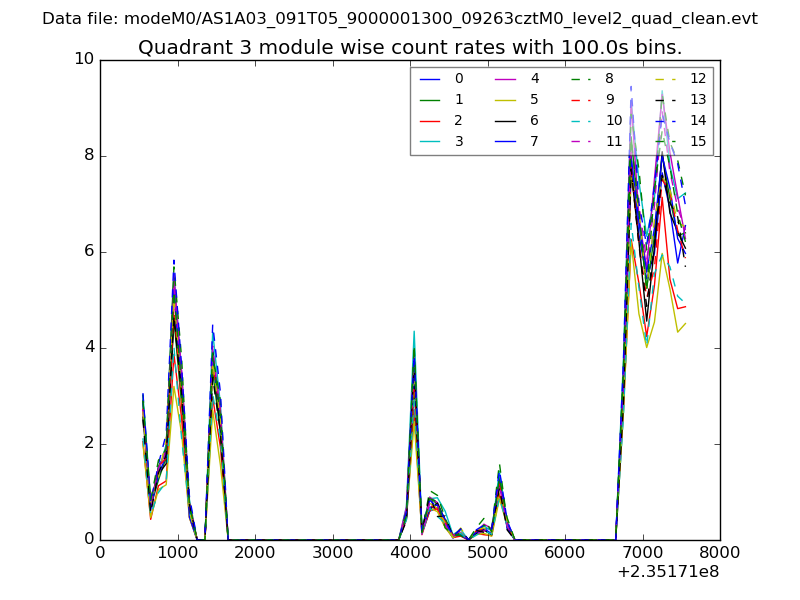
| Module-wise count rates for Quadrant C Data is divided into 100 sec bins |
 |
 |
| Module-wise count rates for Quadrant D Data is divided into 100 sec bins |
 |
 |
| Parameter | Plot |
|---|---|
| CZT HV Monitor | 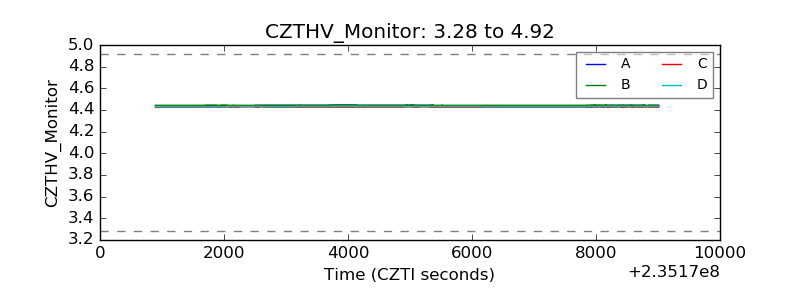 |
| D_VDD | 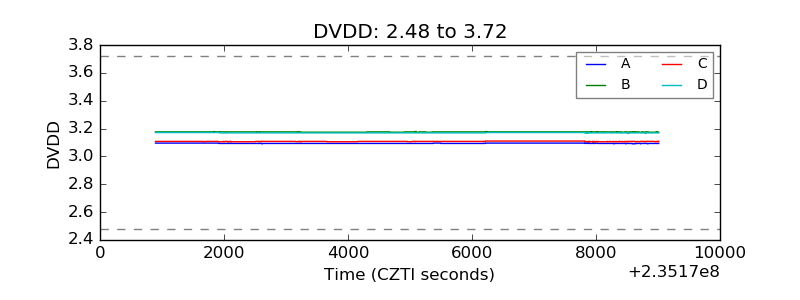 |
| Temperature 1 | 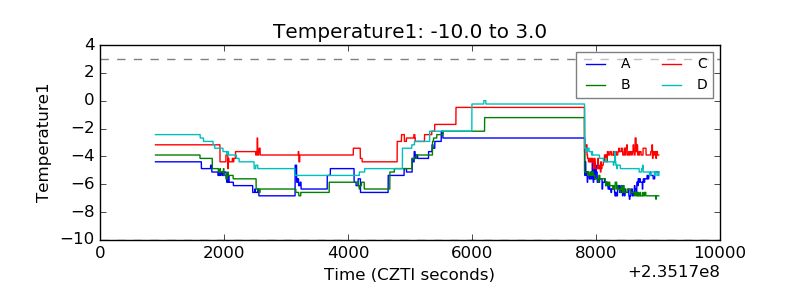 |
| Veto HV Monitor |  |
| Veto LLD | 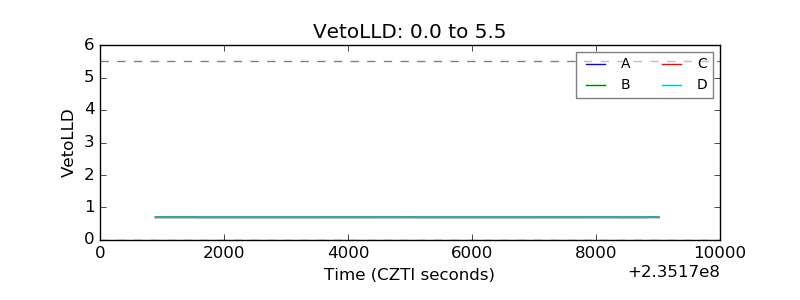 |
| Alpha Counter | 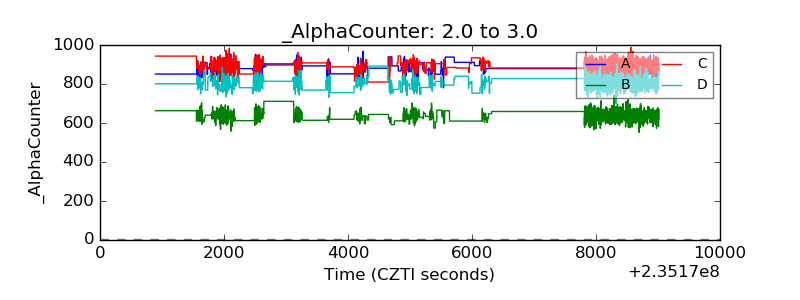 |
| _CPM_Rate | 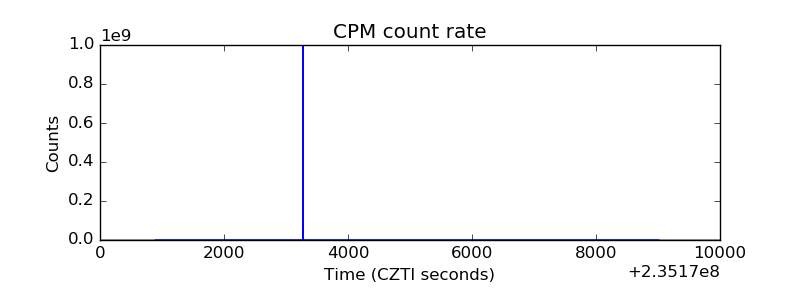 |
| CZT Counter | 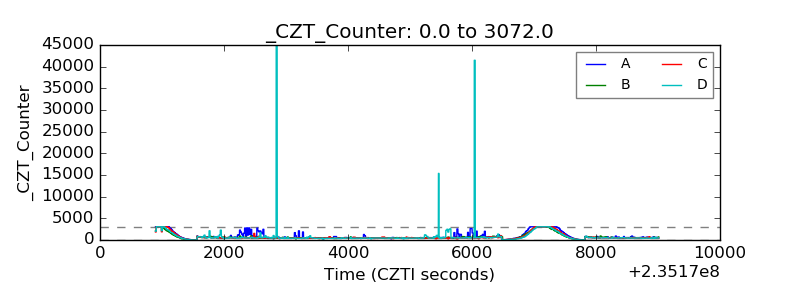 |
| +2.5 Volts monitor | 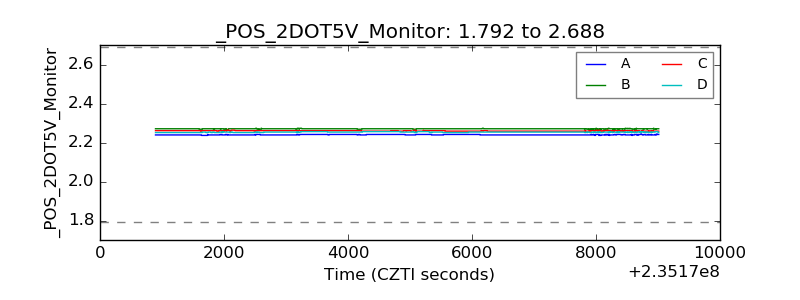 |
| +5 Volts monitor |  |
| _ROLL_ROT | 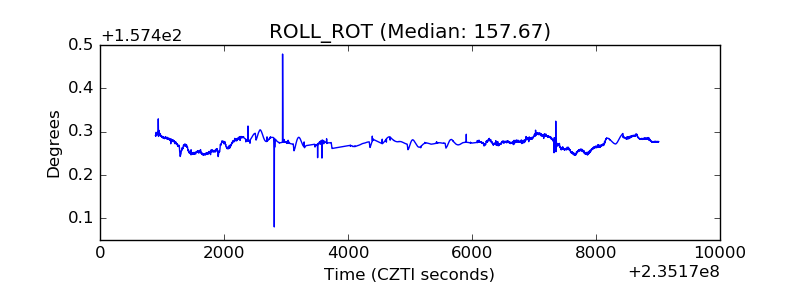 |
| _Roll_DEC | 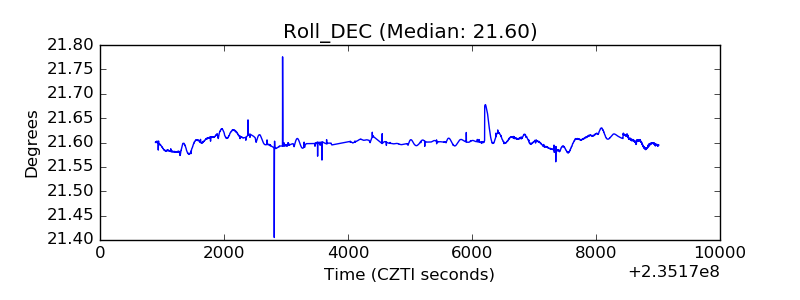 |
| _Roll_RA | 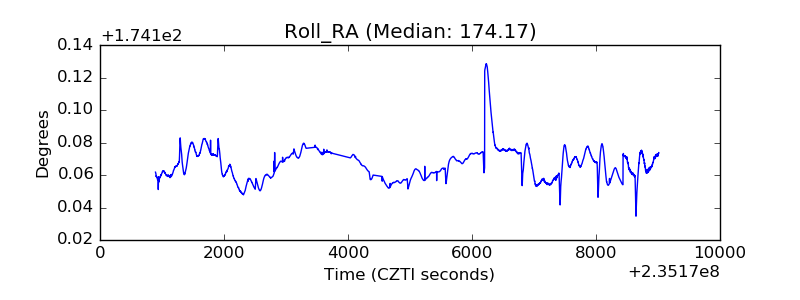 |
| Veto Counter | 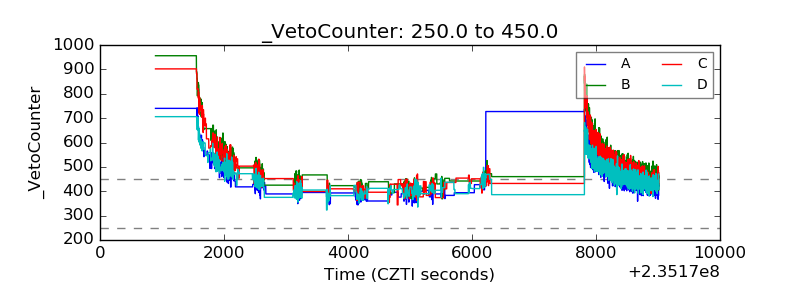 |