| Param | Original file | Final file |
|---|---|---|
| Filename | modeM0/AS1A03_091T05_9000001300_09265cztM0_level2.evt | modeM0/AS1A03_091T05_9000001300_09265cztM0_level2_quad_clean.evt |
| Size (bytes) | 1,506,242,880 | 219,548,160 |
| Size | 1.4 GB | 209.4 MB |
| Events in quadrant A | 13,659,632 | 1,302,605 |
| Events in quadrant B | 10,306,059 | 1,373,663 |
| Events in quadrant C | 9,648,204 | 1,322,857 |
| Events in quadrant D | 10,639,389 | 1,259,099 |
| Mode SS | |||
|---|---|---|---|
| Quadrant | BADHDUFLAG | Total packets | Discarded packets |
| A | 0 | 410 | 0 |
| B | 0 | 410 | 0 |
| C | 0 | 410 | 0 |
| D | 0 | 410 | 0 |
| Mode M0 | |||
|---|---|---|---|
| Quadrant | BADHDUFLAG | Total packets | Discarded packets |
| A | 0 | 53898 | 6 |
| B | 0 | 43435 | 5 |
| C | 0 | 41904 | 5 |
| D | 0 | 45197 | 5 |
| Mode M9 | |||
|---|---|---|---|
| Quadrant | BADHDUFLAG | Total packets | Discarded packets |
| A | 0 | 52 | 0 |
| B | 0 | 52 | 0 |
| C | 0 | 52 | 0 |
| D | 0 | 52 | 0 |
| Quadrant | Total seconds | Saturated seconds | Saturation percentage |
|---|---|---|---|
| A | 20202 | 861 | 4.261954% |
| B | 20202 | 241 | 1.192951% |
| C | 20202 | 70 | 0.346500% |
| D | 20202 | 231 | 1.143451% |
Noise dominated data is calculated using 1-second bins in cleaned event files. If a bin has >2000 counts, and if more than 50% of those come from <1% of pixels, then it is considered to be noise-dominated and hence unusable.
| Quadrant | # 1 sec bins | Bins with >0 counts | Bins with >2000 counts | High rate bins dominated by noise | Noise dominated (total time) | Noise dominated (detector-on time) | Marked lightcurve |
|---|---|---|---|---|---|---|---|
| A | 25292 | 20207 | 593 | 593 | 2.34% | 2.93% | 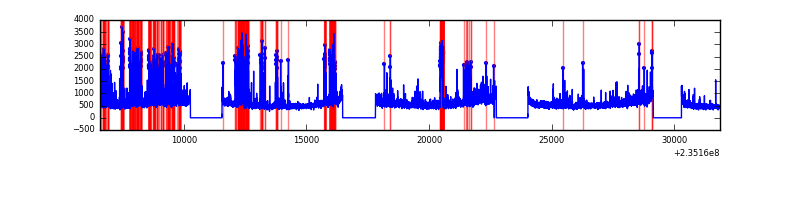 |
| B | 25292 | 20207 | 22 | 22 | 0.09% | 0.11% | 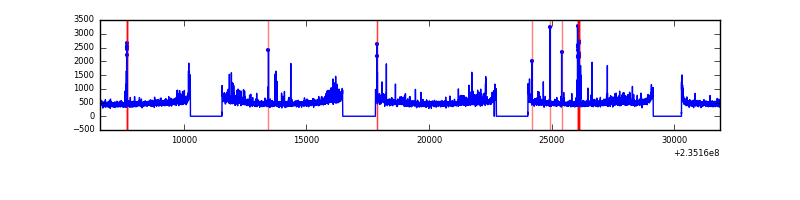 |
| C | 25292 | 20207 | 11 | 11 | 0.04% | 0.05% |  |
| D | 25292 | 20207 | 180 | 180 | 0.71% | 0.89% | 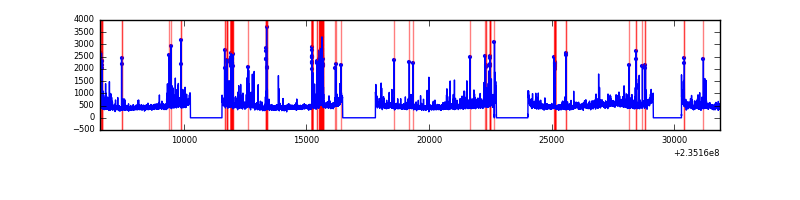 |
Top three noisy pixels from each quadrant. If the there are fewer than three noisy pixels in the level2.evt file, extra rows are filled as -1
| Pixel properties | Quadrant properties | ||||||
|---|---|---|---|---|---|---|---|
| Quadrant | DetID | PixID | Counts | Sigma | Mean | Median | Sigma |
| A | 5 | 16 | 1872518 | 3814.9 | 2440 | 2393 | 490.2 |
| A | 8 | 5 | 1660570 | 3382.54 | 2440 | 2393 | 490.2 |
| A | 15 | 250 | 272072 | 550.12 | 2440 | 2393 | 490.2 |
| B | 0 | 214 | 275137 | 582.27 | 2503 | 2447 | 468.3 |
| B | 0 | 219 | 100025 | 208.36 | 2503 | 2447 | 468.3 |
| B | 0 | 245 | 60646 | 124.27 | 2503 | 2447 | 468.3 |
| C | 9 | 68 | 217033 | 390.21 | 2398 | 2410 | 550.0 |
| C | 14 | 234 | 65086 | 113.95 | 2398 | 2410 | 550.0 |
| C | 13 | 61 | 18144 | 28.61 | 2398 | 2410 | 550.0 |
| D | 1 | 52 | 576688 | 934.04 | 2357 | 2304 | 614.9 |
| D | 12 | 233 | 447353 | 723.72 | 2357 | 2304 | 614.9 |
| D | 2 | 136 | 358448 | 579.15 | 2357 | 2304 | 614.9 |
Histogram calculated using DETX and DETY for each event in the final _common_clean file
| Quadrant A | 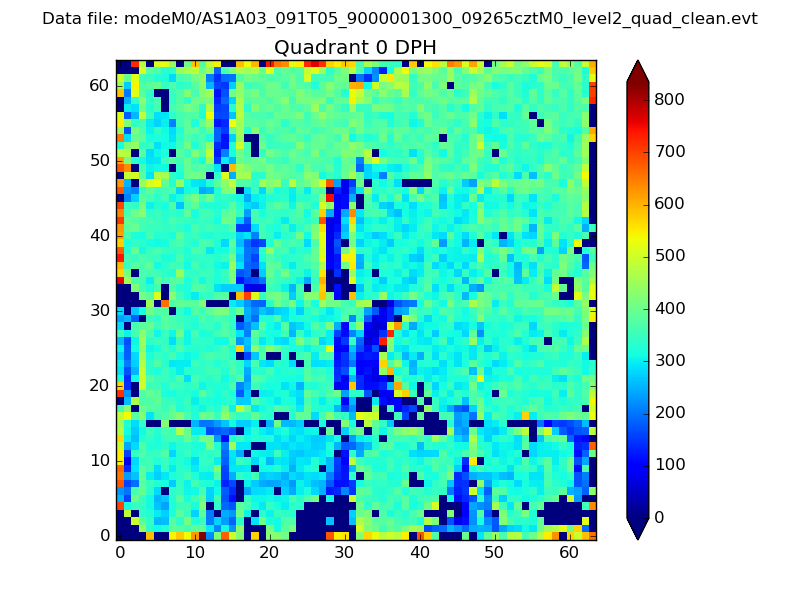 |
 |
Quadrant B |
|---|---|---|---|
| Quadrant D | 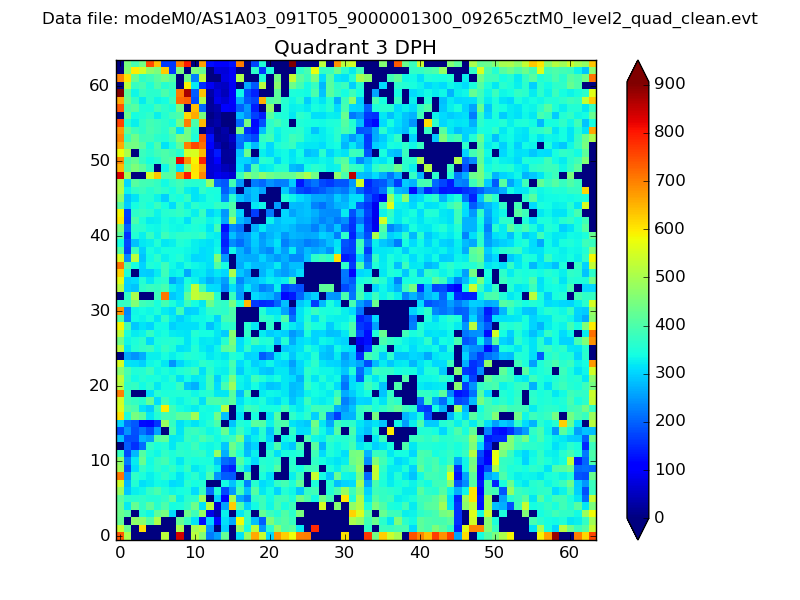 |
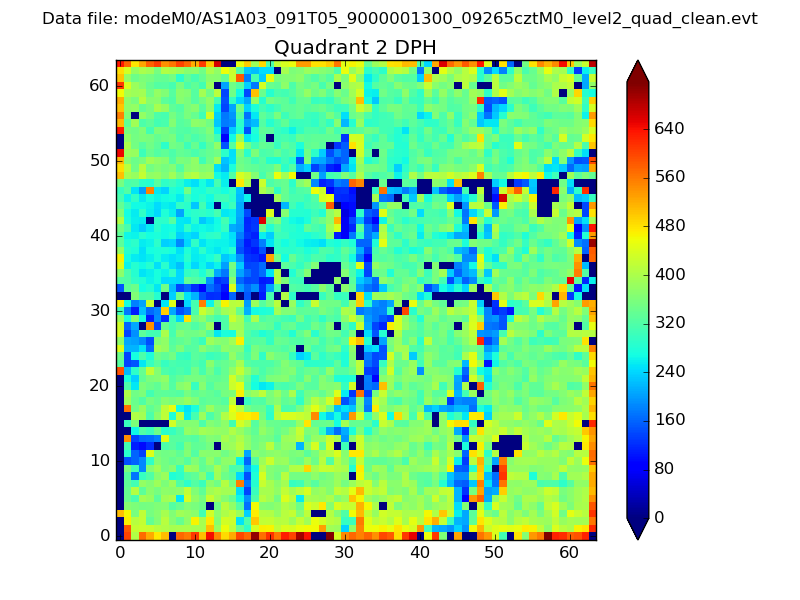 |
Quadrant C |
| Plot type | Count rate plots | Images |
|---|---|---|
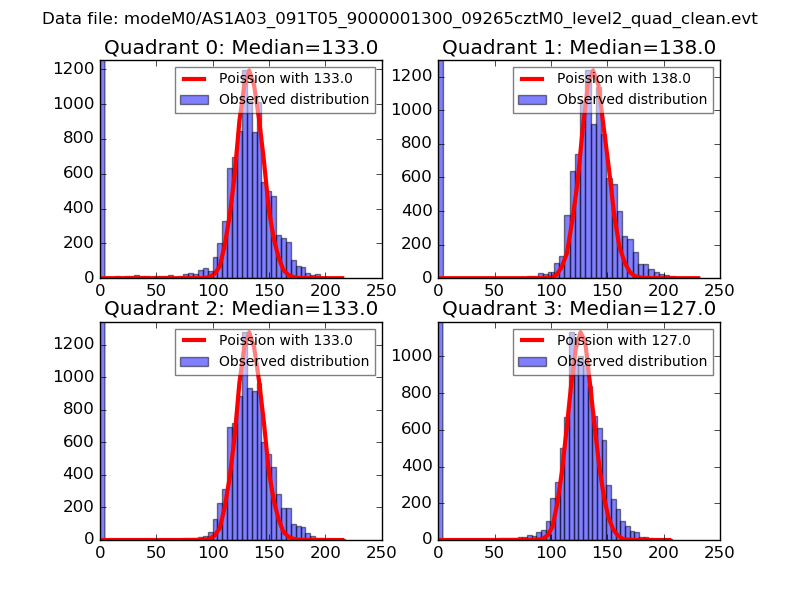
| Comparison with Poisson distribution Blue bars denote a histogram of data divided into 1 sec bins. Red curve is a Poisson curve with rate = median count rate of data. |
 |
 |
| Quadrant-wise count rates Data is divided into 100 sec bins |
 |
|
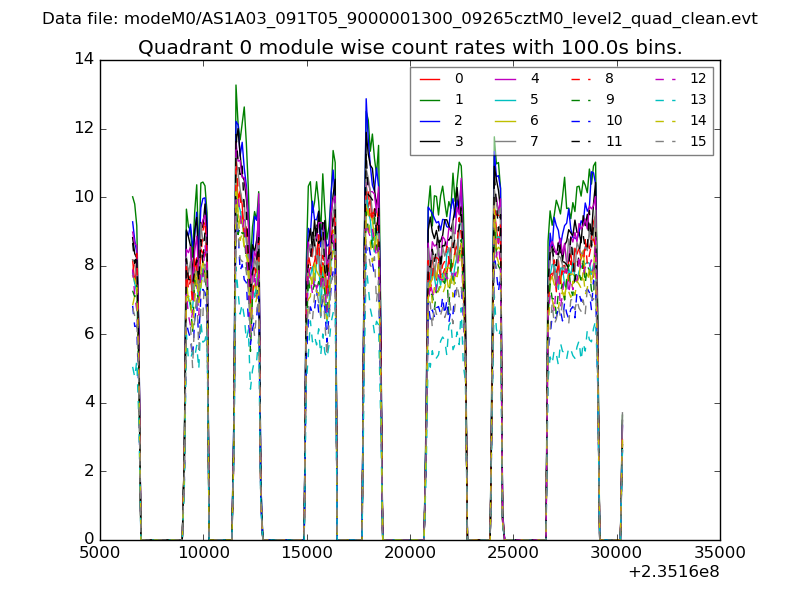
| Module-wise count rates for Quadrant A Data is divided into 100 sec bins |
 |
 |
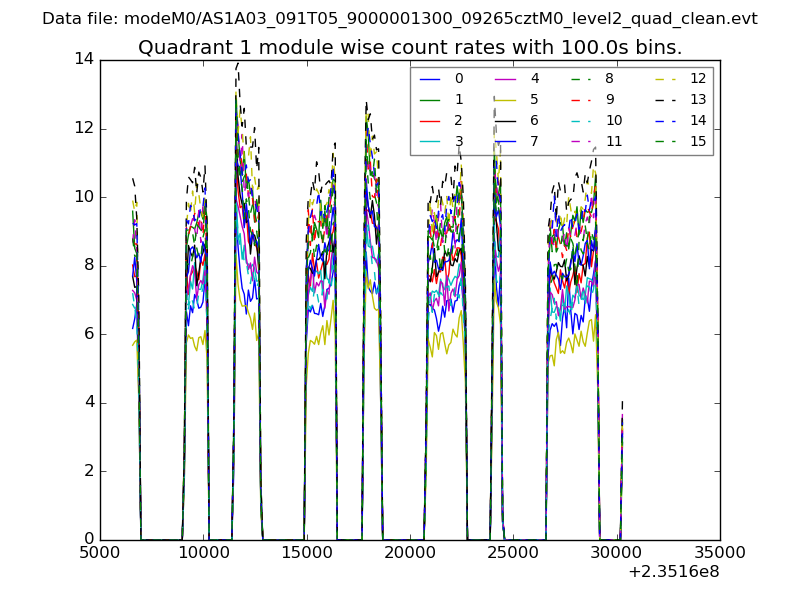
| Module-wise count rates for Quadrant B Data is divided into 100 sec bins |
 |
 |
| Module-wise count rates for Quadrant C Data is divided into 100 sec bins |
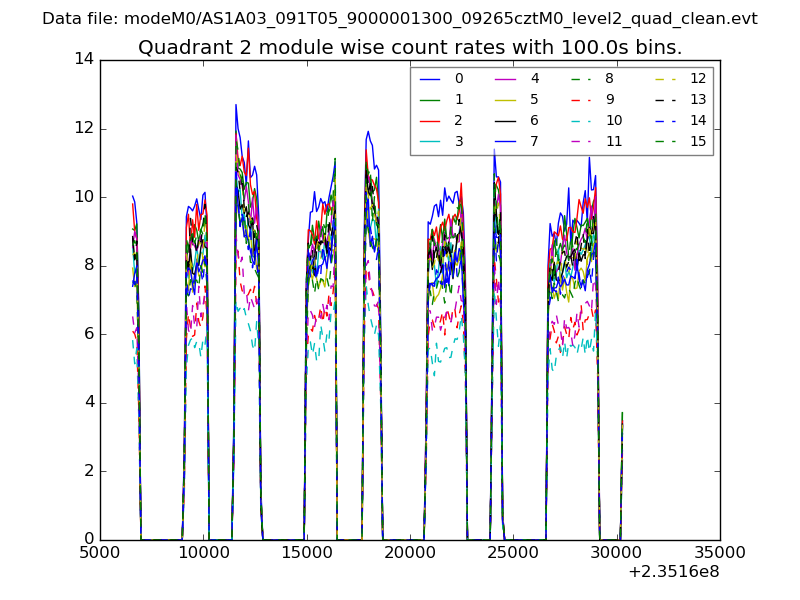 |
 |
| Module-wise count rates for Quadrant D Data is divided into 100 sec bins |
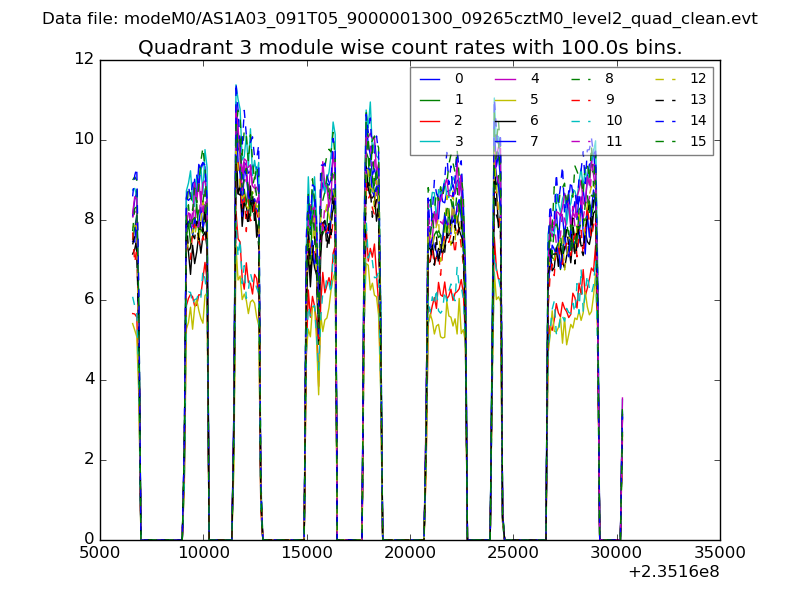 |
 |
| Parameter | Plot |
|---|---|
| CZT HV Monitor | 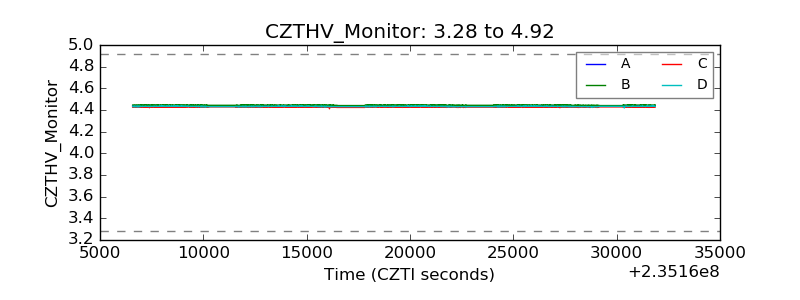 |
| D_VDD | 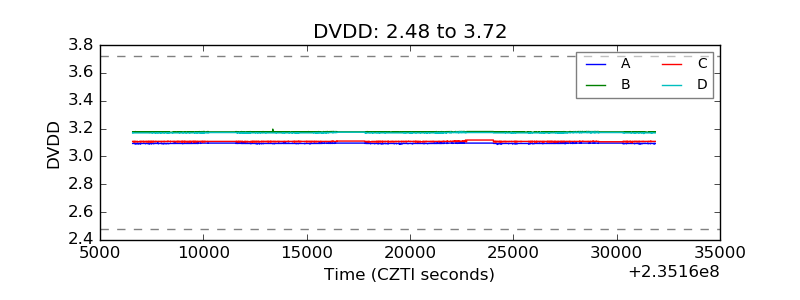 |
| Temperature 1 | 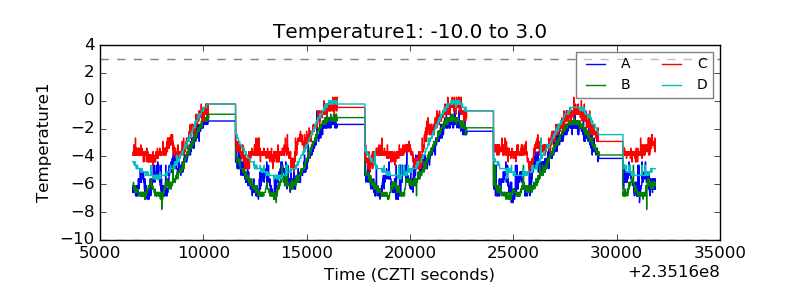 |
| Veto HV Monitor | 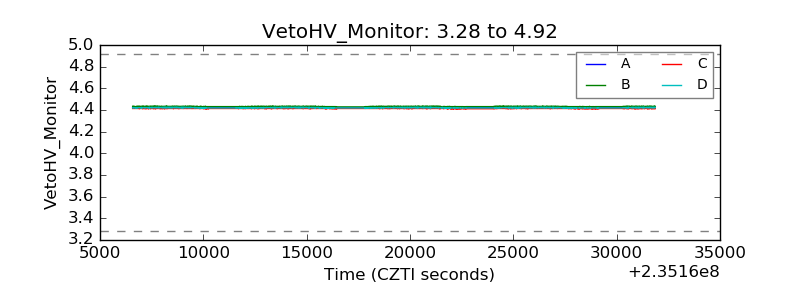 |
| Veto LLD | 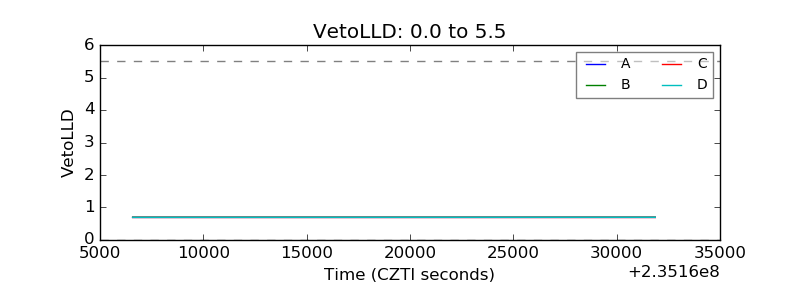 |
| Alpha Counter | 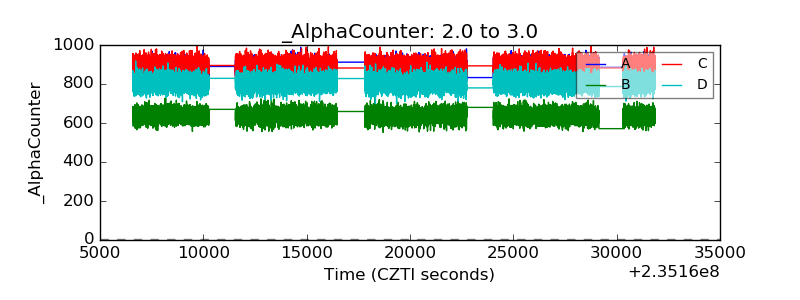 |
| _CPM_Rate | 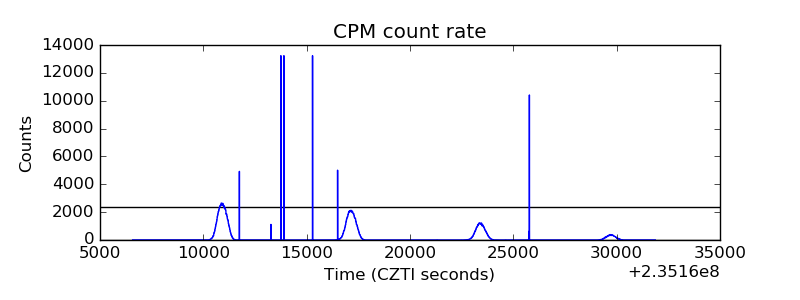 |
| CZT Counter |  |
| +2.5 Volts monitor |  |
| +5 Volts monitor |  |
| _ROLL_ROT | 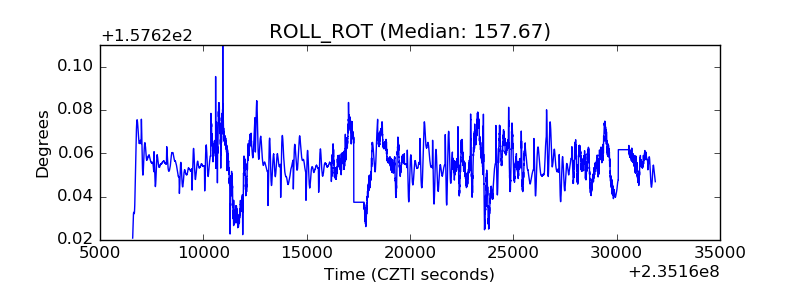 |
| _Roll_DEC | 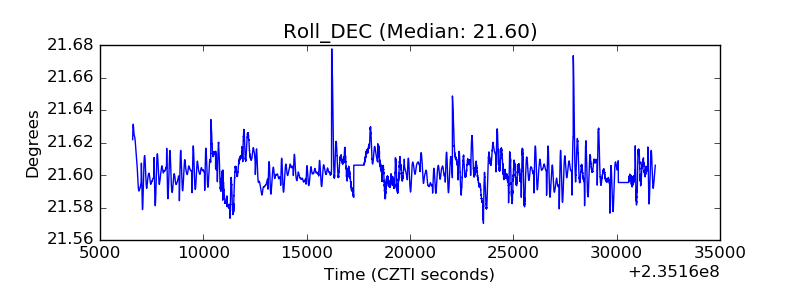 |
| _Roll_RA | 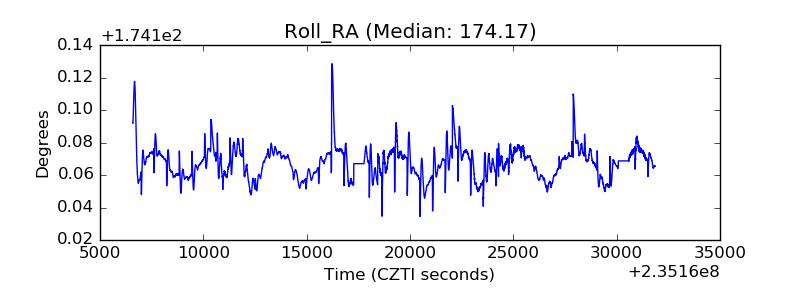 |
| Veto Counter | 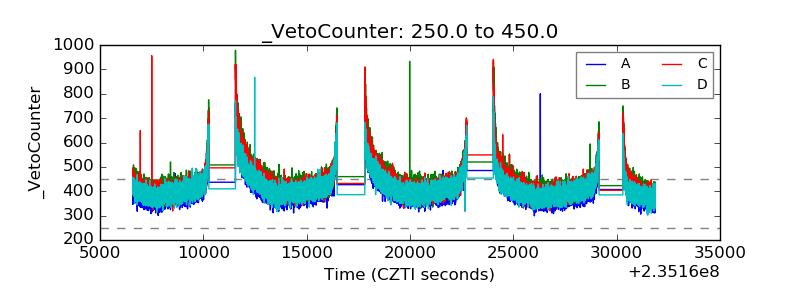 |