| Param | Original file | Final file |
|---|---|---|
| Filename | modeM0/AS1A03_091T05_9000001300_09266cztM0_level2.evt | modeM0/AS1A03_091T05_9000001300_09266cztM0_level2_quad_clean.evt |
| Size (bytes) | 493,536,960 | 67,824,000 |
| Size | 470.7 MB | 64.7 MB |
| Events in quadrant A | 3,956,935 | 394,195 |
| Events in quadrant B | 3,509,283 | 402,781 |
| Events in quadrant C | 3,192,995 | 393,670 |
| Events in quadrant D | 3,814,619 | 377,855 |
| Mode SS | |||
|---|---|---|---|
| Quadrant | BADHDUFLAG | Total packets | Discarded packets |
| A | 0 | 142 | 0 |
| B | 0 | 142 | 0 |
| C | 0 | 142 | 0 |
| D | 0 | 142 | 0 |
| Mode M0 | |||
|---|---|---|---|
| Quadrant | BADHDUFLAG | Total packets | Discarded packets |
| A | 0 | 16121 | 2 |
| B | 0 | 14915 | 1 |
| C | 0 | 14300 | 1 |
| D | 0 | 15998 | 1 |
| Mode M9 | |||
|---|---|---|---|
| Quadrant | BADHDUFLAG | Total packets | Discarded packets |
| A | 0 | 7 | 0 |
| B | 0 | 7 | 0 |
| C | 0 | 7 | 0 |
| D | 0 | 7 | 0 |
| Quadrant | Total seconds | Saturated seconds | Saturation percentage |
|---|---|---|---|
| A | 6960 | 225 | 3.232759% |
| B | 6960 | 163 | 2.341954% |
| C | 6960 | 93 | 1.336207% |
| D | 6960 | 178 | 2.557471% |
Noise dominated data is calculated using 1-second bins in cleaned event files. If a bin has >2000 counts, and if more than 50% of those come from <1% of pixels, then it is considered to be noise-dominated and hence unusable.
| Quadrant | # 1 sec bins | Bins with >0 counts | Bins with >2000 counts | High rate bins dominated by noise | Noise dominated (total time) | Noise dominated (detector-on time) | Marked lightcurve |
|---|---|---|---|---|---|---|---|
| A | 7680 | 6961 | 55 | 55 | 0.72% | 0.79% |  |
| B | 7680 | 6961 | 3 | 3 | 0.04% | 0.04% | 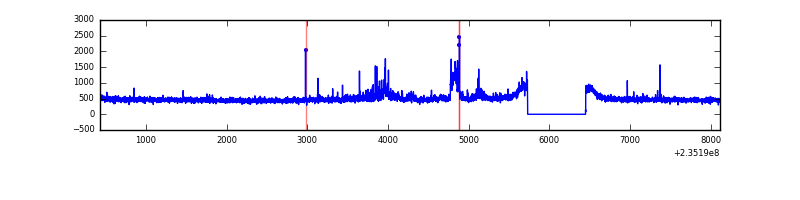 |
| C | 7680 | 6961 | 0 | 0 | 0.00% | 0.00% | 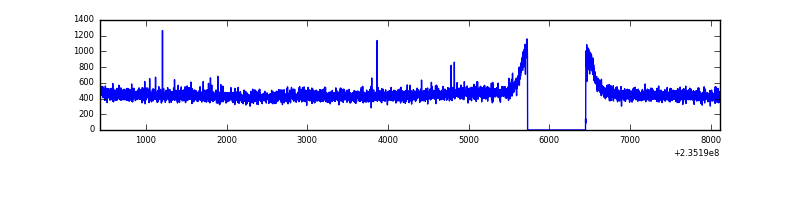 |
| D | 7680 | 6961 | 65 | 65 | 0.85% | 0.93% | 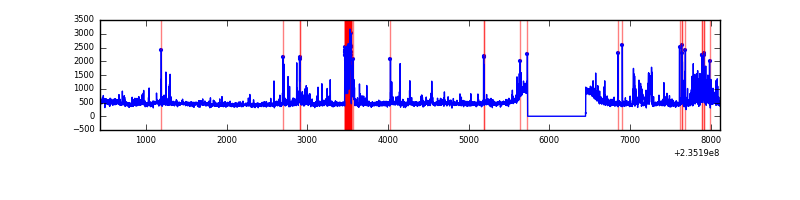 |
Top three noisy pixels from each quadrant. If the there are fewer than three noisy pixels in the level2.evt file, extra rows are filled as -1
| Pixel properties | Quadrant properties | ||||||
|---|---|---|---|---|---|---|---|
| Quadrant | DetID | PixID | Counts | Sigma | Mean | Median | Sigma |
| A | 8 | 5 | 341375 | 1974.15 | 833 | 814 | 172.5 |
| A | 5 | 16 | 278672 | 1610.68 | 833 | 814 | 172.5 |
| A | 15 | 174 | 44160 | 251.27 | 833 | 814 | 172.5 |
| B | 5 | 250 | 87031 | 531.66 | 843 | 823 | 162.1 |
| B | 0 | 214 | 72733 | 443.48 | 843 | 823 | 162.1 |
| B | 0 | 245 | 33283 | 200.19 | 843 | 823 | 162.1 |
| C | 9 | 68 | 7893 | 37.36 | 814 | 818 | 189.4 |
| C | 14 | 67 | 7593 | 35.77 | 814 | 818 | 189.4 |
| C | 13 | 61 | 6052 | 27.64 | 814 | 818 | 189.4 |
| D | 1 | 52 | 566847 | 2617.01 | 802 | 782 | 216.3 |
| D | 2 | 136 | 122983 | 564.96 | 802 | 782 | 216.3 |
| D | 7 | 71 | 30277 | 136.36 | 802 | 782 | 216.3 |
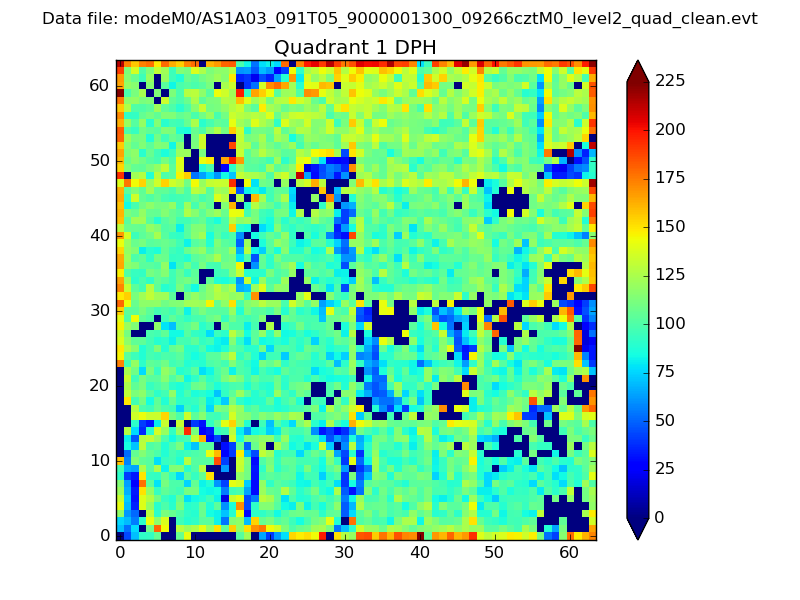
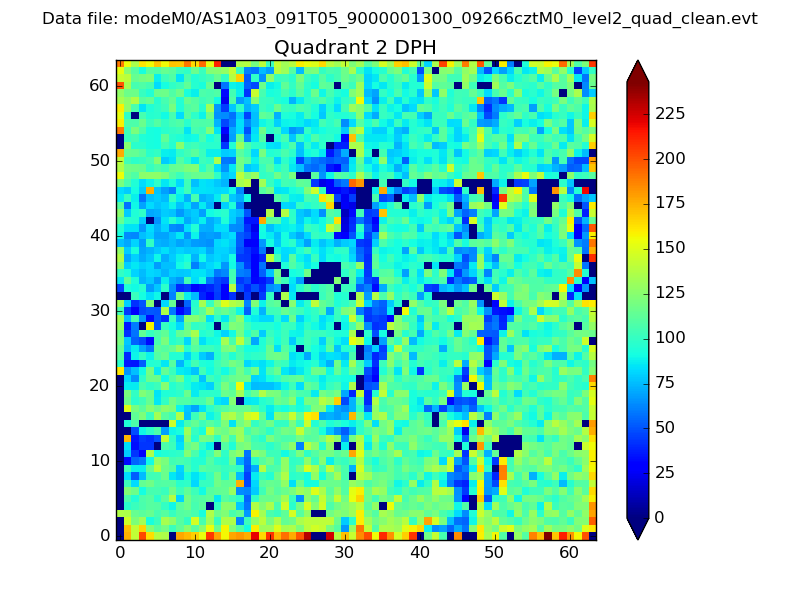
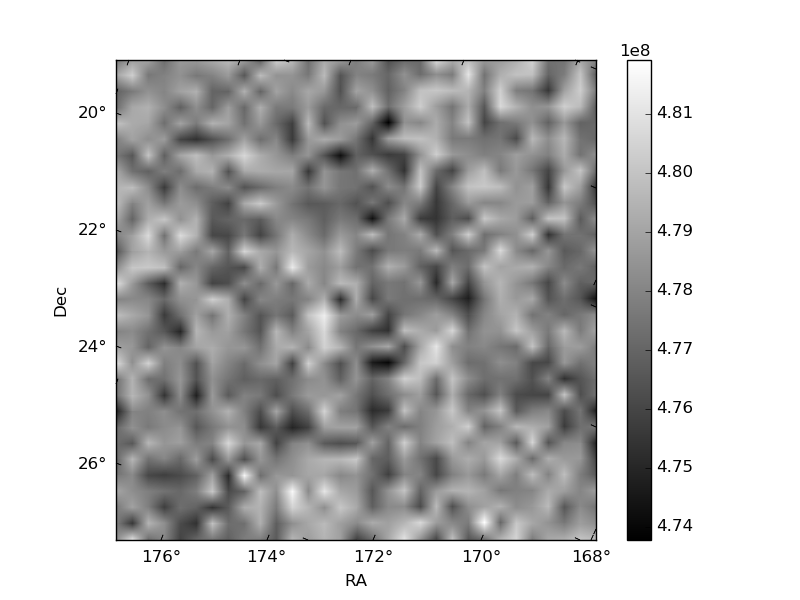
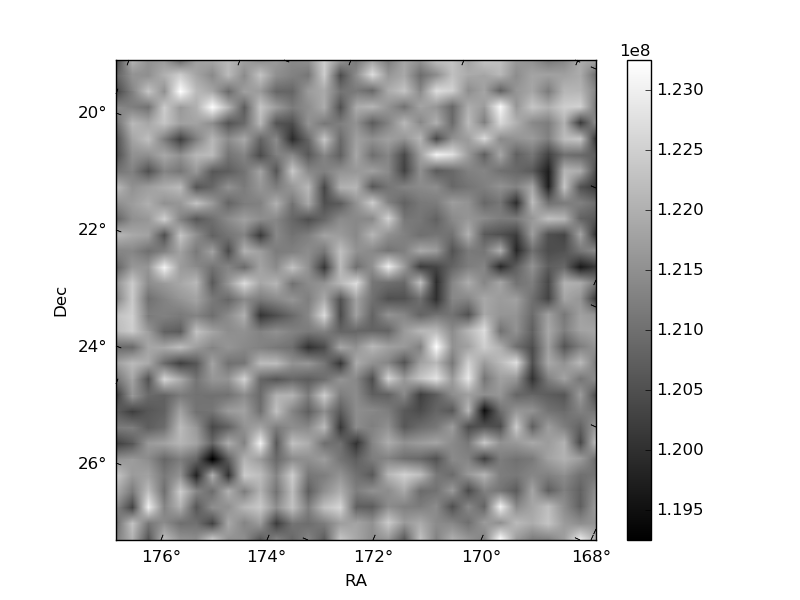
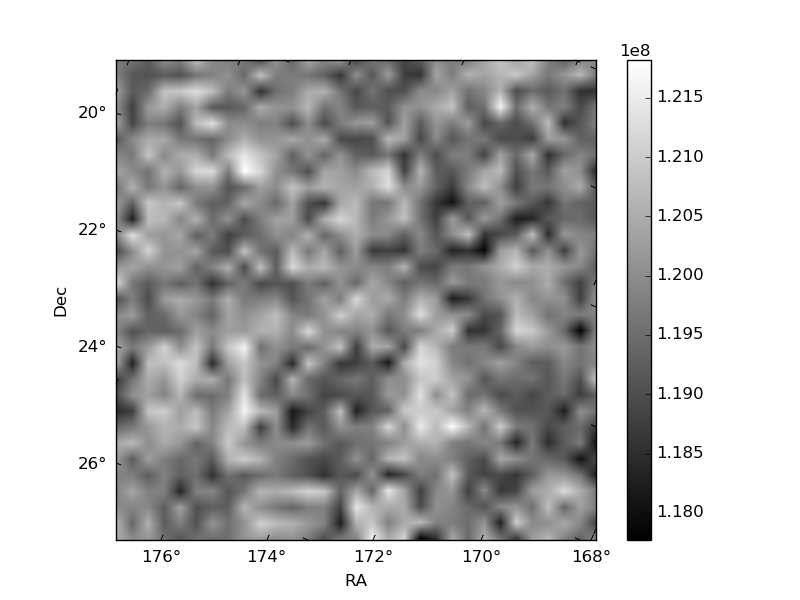
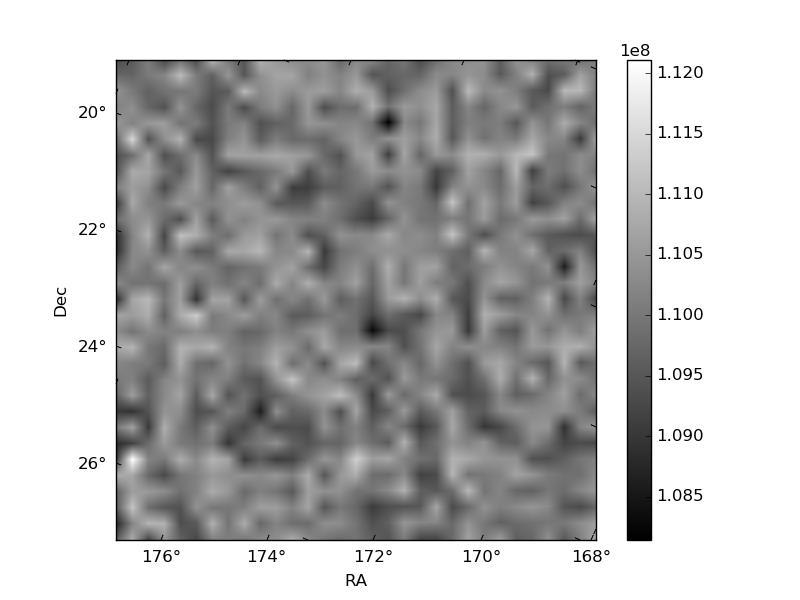
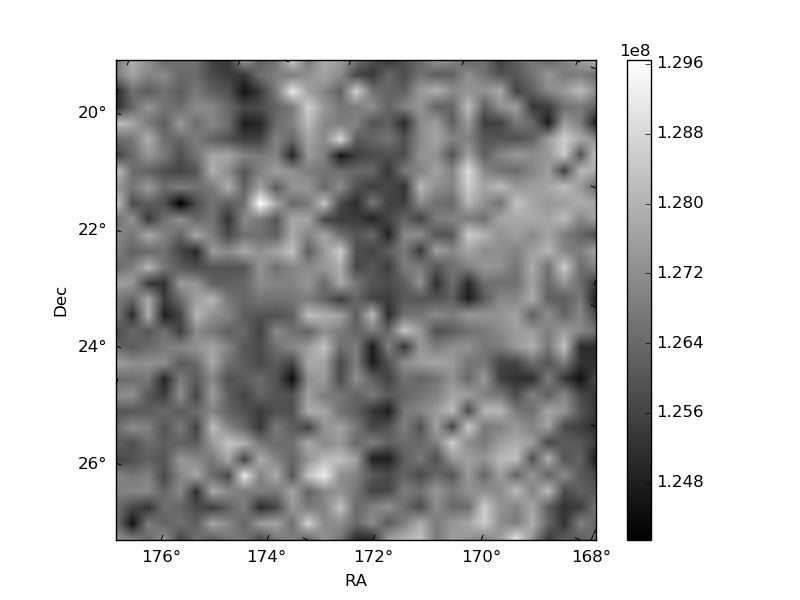
Histogram calculated using DETX and DETY for each event in the final _common_clean file
| Quadrant A | 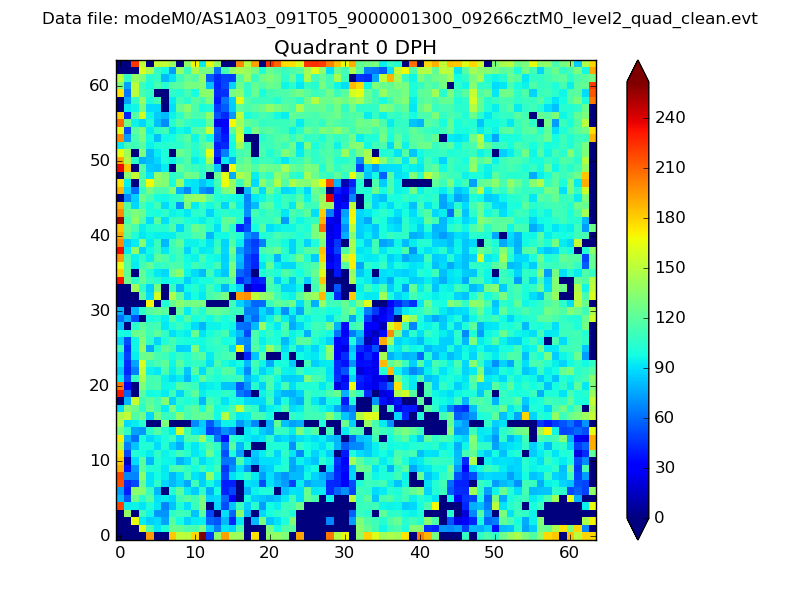 |
 |
Quadrant B |
|---|---|---|---|
| Quadrant D | 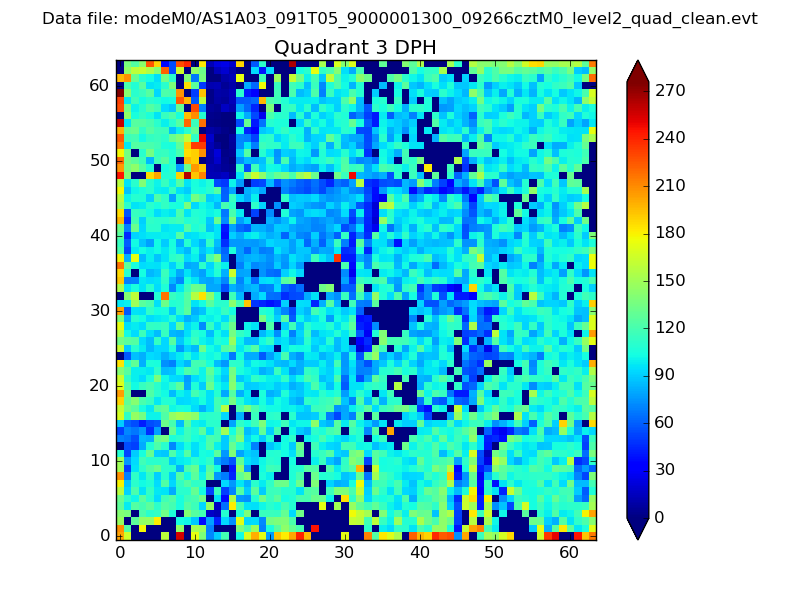 |
 |
Quadrant C |
| Plot type | Count rate plots | Images |
|---|---|---|
| Comparison with Poisson distribution Blue bars denote a histogram of data divided into 1 sec bins. Red curve is a Poisson curve with rate = median count rate of data. |
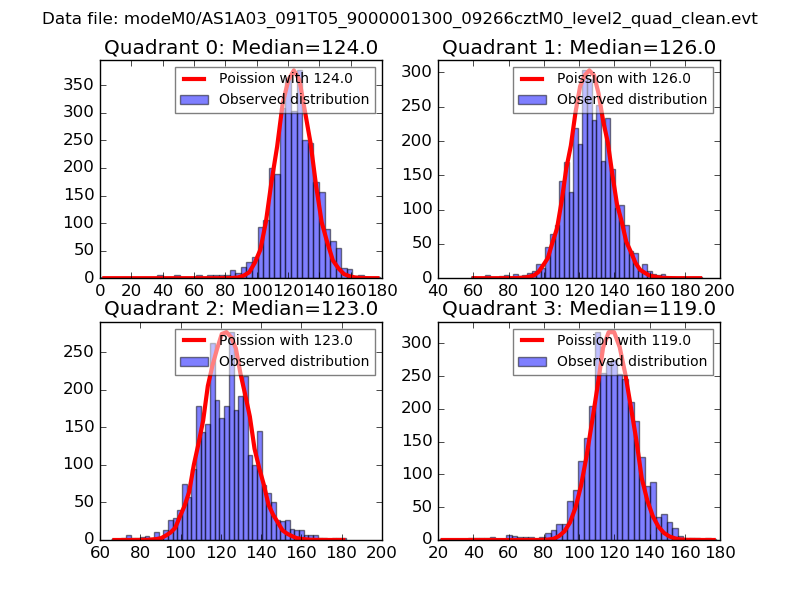 |
 |
| Quadrant-wise count rates Data is divided into 100 sec bins |
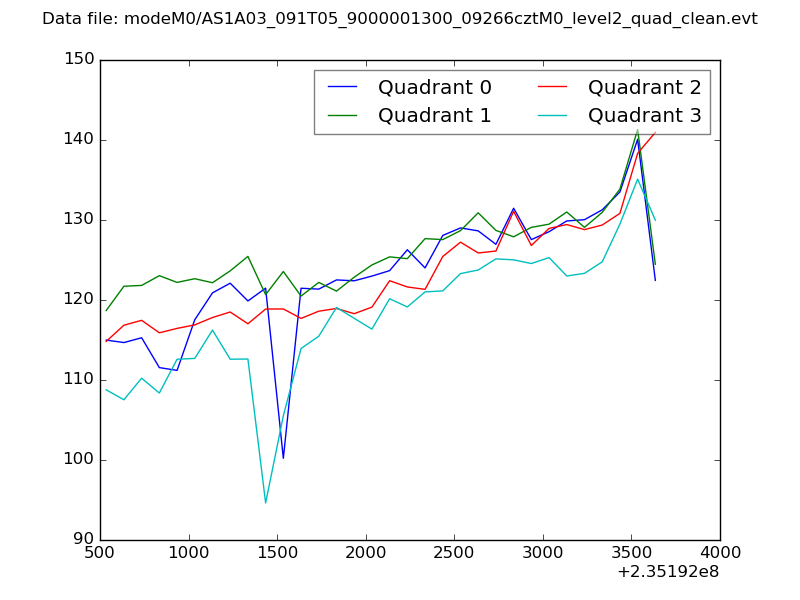 |
|
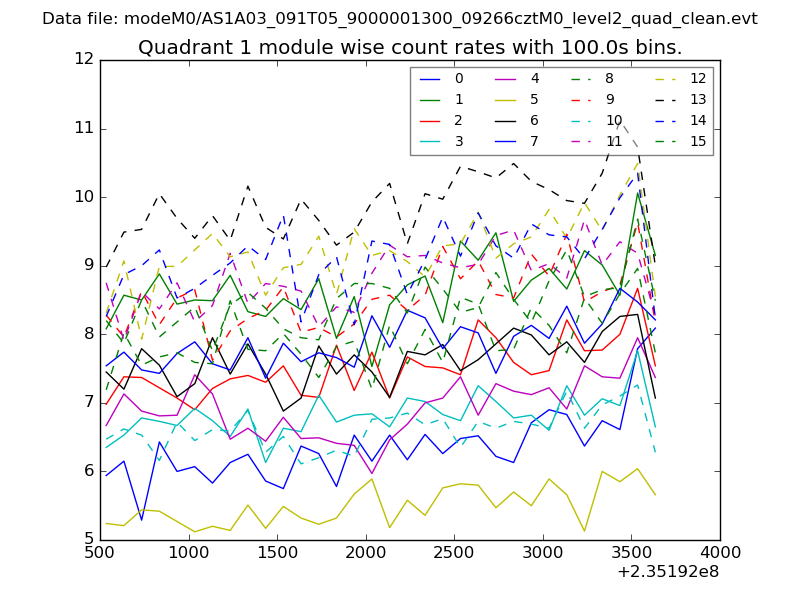
| Module-wise count rates for Quadrant A Data is divided into 100 sec bins |
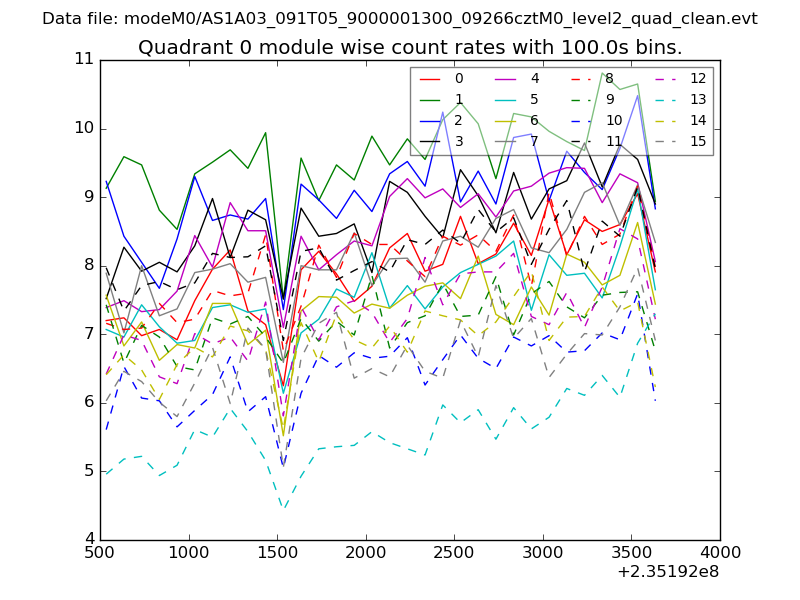 |
 |
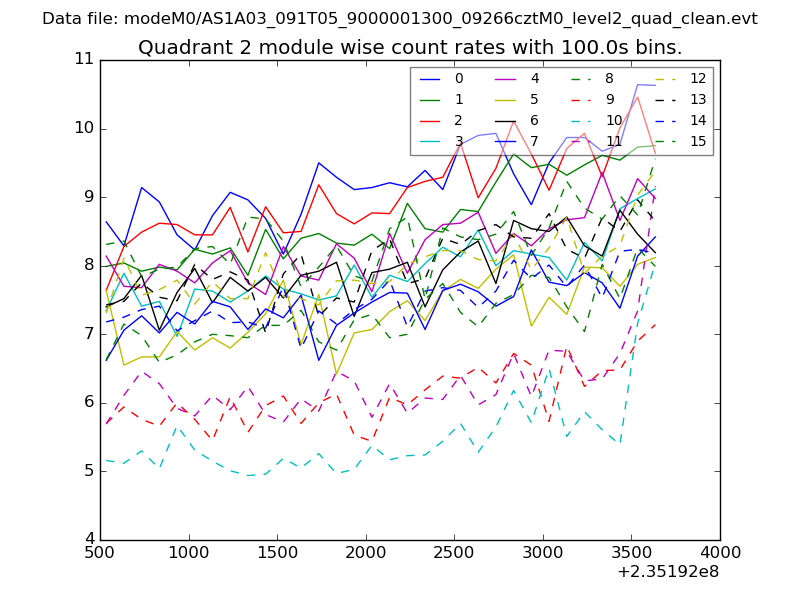
| Module-wise count rates for Quadrant B Data is divided into 100 sec bins |
 |
 |
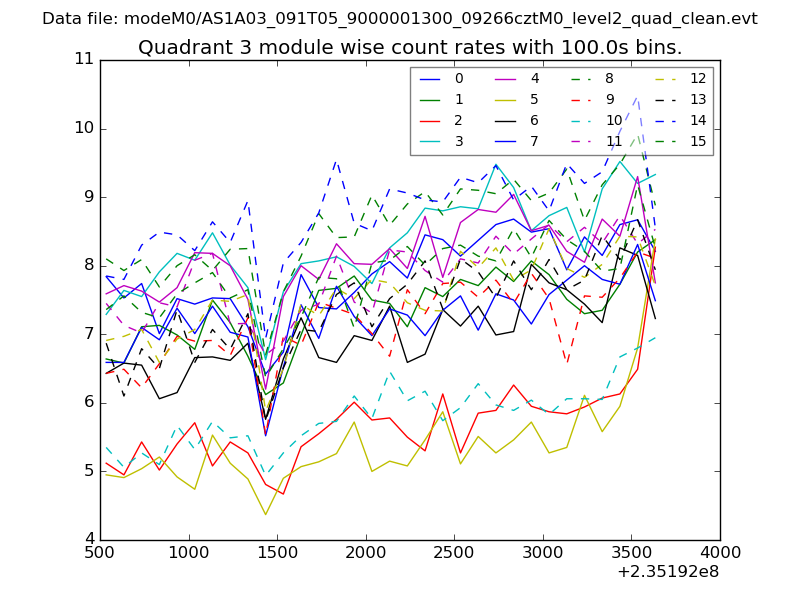
| Module-wise count rates for Quadrant C Data is divided into 100 sec bins |
 |
 |
| Module-wise count rates for Quadrant D Data is divided into 100 sec bins |
 |
 |
| Parameter | Plot |
|---|---|
| CZT HV Monitor | 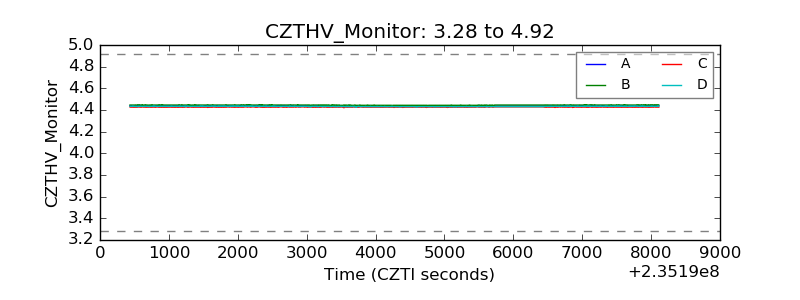 |
| D_VDD |  |
| Temperature 1 | 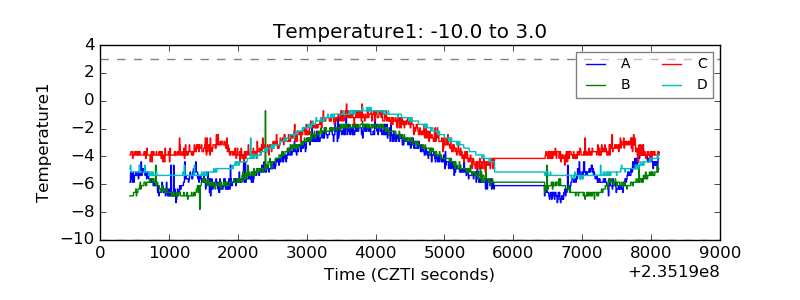 |
| Veto HV Monitor | 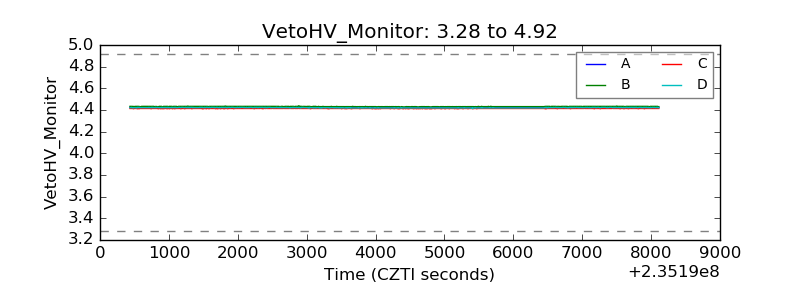 |
| Veto LLD | 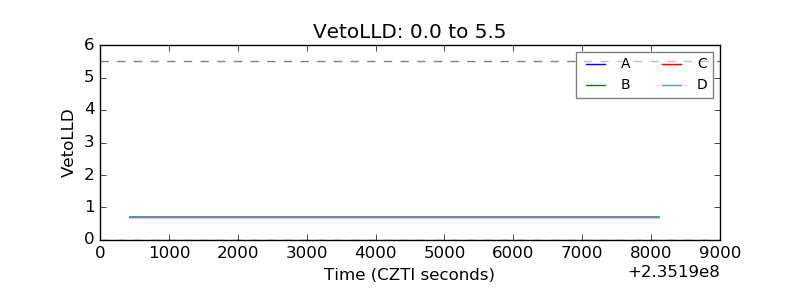 |
| Alpha Counter | 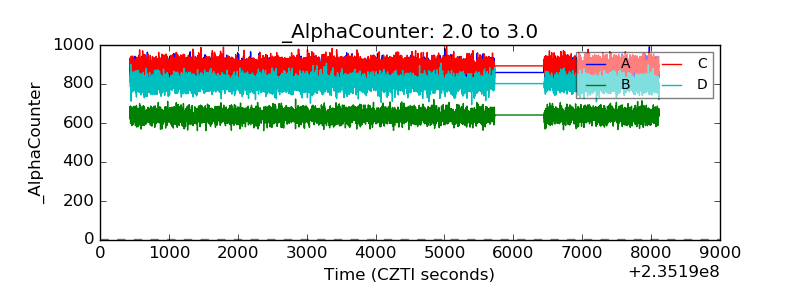 |
| _CPM_Rate | 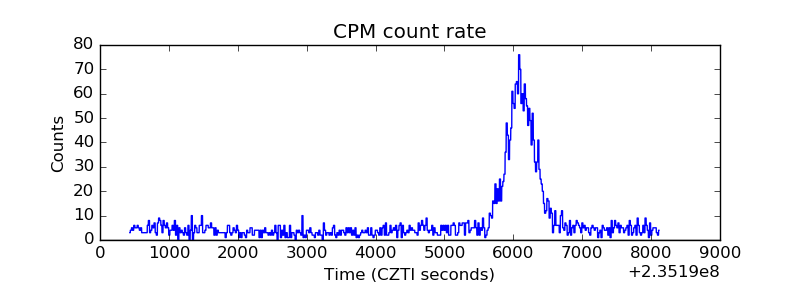 |
| CZT Counter | 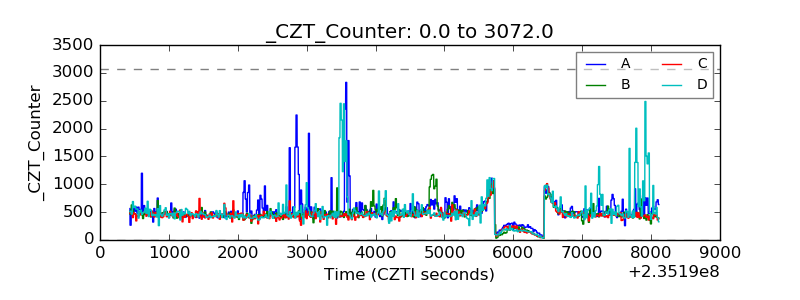 |
| +2.5 Volts monitor |  |
| +5 Volts monitor |  |
| _ROLL_ROT | 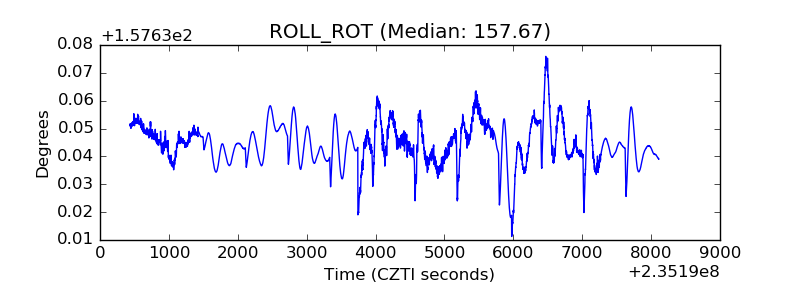 |
| _Roll_DEC | 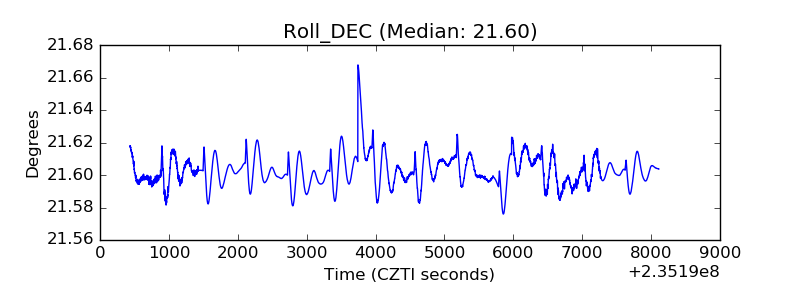 |
| _Roll_RA | 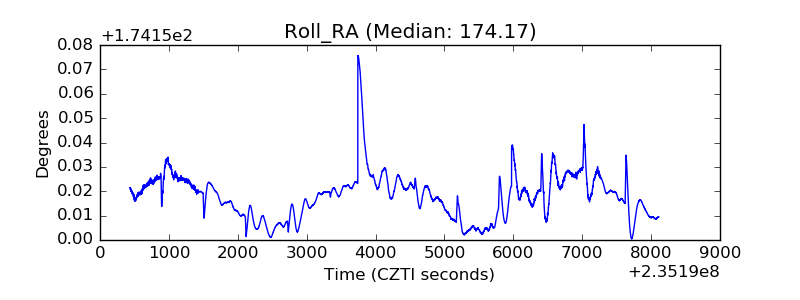 |
| Veto Counter | 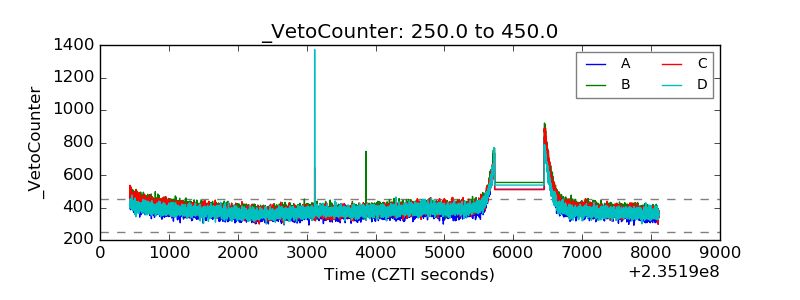 |