| Param | Original file | Final file |
|---|---|---|
| Filename | modeM0/AS1A03_091T05_9000001300_09267cztM0_level2.evt | modeM0/AS1A03_091T05_9000001300_09267cztM0_level2_quad_clean.evt |
| Size (bytes) | 534,496,320 | 73,728,000 |
| Size | 509.7 MB | 70.3 MB |
| Events in quadrant A | 4,591,635 | 431,177 |
| Events in quadrant B | 3,532,527 | 441,597 |
| Events in quadrant C | 3,368,836 | 433,332 |
| Events in quadrant D | 4,196,929 | 416,417 |
| Mode SS | |||
|---|---|---|---|
| Quadrant | BADHDUFLAG | Total packets | Discarded packets |
| A | 0 | 150 | 0 |
| B | 0 | 150 | 0 |
| C | 0 | 150 | 0 |
| D | 0 | 150 | 0 |
| Mode M0 | |||
|---|---|---|---|
| Quadrant | BADHDUFLAG | Total packets | Discarded packets |
| A | 0 | 18415 | 125 |
| B | 0 | 15378 | 120 |
| C | 0 | 15177 | 99 |
| D | 0 | 17537 | 108 |
| Mode M9 | |||
|---|---|---|---|
| Quadrant | BADHDUFLAG | Total packets | Discarded packets |
| A | 0 | 3 | 0 |
| B | 0 | 3 | 0 |
| C | 0 | 3 | 0 |
| D | 0 | 3 | 0 |
| Quadrant | Total seconds | Saturated seconds | Saturation percentage |
|---|---|---|---|
| A | 7320 | 329 | 4.494536% |
| B | 7312 | 237 | 3.241247% |
| C | 7319 | 185 | 2.527668% |
| D | 7324 | 246 | 3.358820% |
Noise dominated data is calculated using 1-second bins in cleaned event files. If a bin has >2000 counts, and if more than 50% of those come from <1% of pixels, then it is considered to be noise-dominated and hence unusable.
| Quadrant | # 1 sec bins | Bins with >0 counts | Bins with >2000 counts | High rate bins dominated by noise | Noise dominated (total time) | Noise dominated (detector-on time) | Marked lightcurve |
|---|---|---|---|---|---|---|---|
| A | 7627 | 7365 | 51 | 51 | 0.67% | 0.69% | 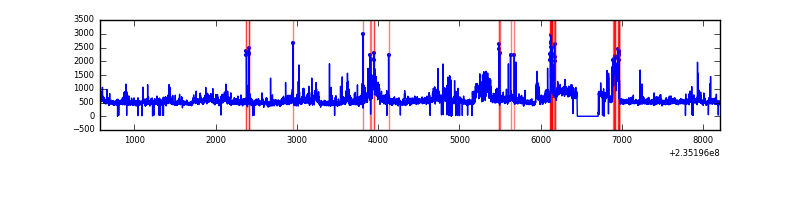 |
| B | 7627 | 7366 | 1 | 1 | 0.01% | 0.01% | 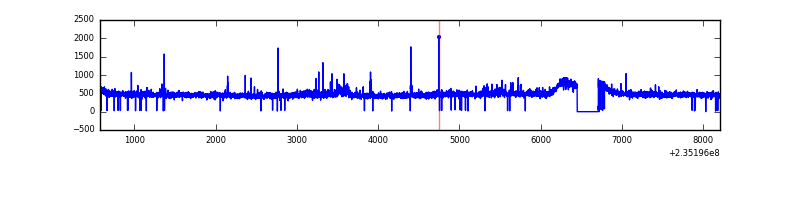 |
| C | 7627 | 7365 | 0 | 0 | 0.00% | 0.00% | 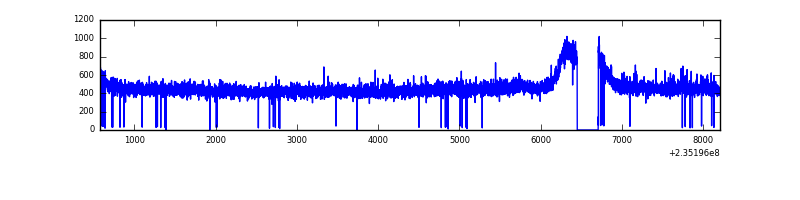 |
| D | 7627 | 7368 | 53 | 53 | 0.69% | 0.72% | 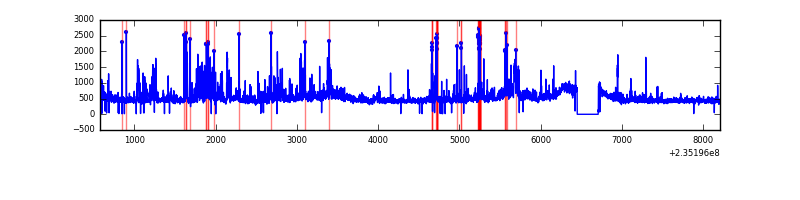 |
Top three noisy pixels from each quadrant. If the there are fewer than three noisy pixels in the level2.evt file, extra rows are filled as -1
| Pixel properties | Quadrant properties | ||||||
|---|---|---|---|---|---|---|---|
| Quadrant | DetID | PixID | Counts | Sigma | Mean | Median | Sigma |
| A | 8 | 5 | 898471 | 4987.51 | 872 | 852 | 180.0 |
| A | 15 | 174 | 142776 | 788.58 | 872 | 852 | 180.0 |
| A | 5 | 16 | 78573 | 431.84 | 872 | 852 | 180.0 |
| B | 0 | 214 | 47129 | 270.52 | 883 | 858 | 171.0 |
| B | 12 | 111 | 18596 | 103.71 | 883 | 858 | 171.0 |
| B | 0 | 245 | 16096 | 89.09 | 883 | 858 | 171.0 |
| C | 9 | 68 | 15356 | 72.1 | 857 | 857 | 201.1 |
| C | 13 | 61 | 6515 | 28.13 | 857 | 857 | 201.1 |
| C | 8 | 128 | 4681 | 19.01 | 857 | 857 | 201.1 |
| D | 1 | 52 | 661792 | 2941.86 | 846 | 824 | 224.7 |
| D | 7 | 71 | 173528 | 768.68 | 846 | 824 | 224.7 |
| D | 2 | 136 | 107095 | 472.99 | 846 | 824 | 224.7 |
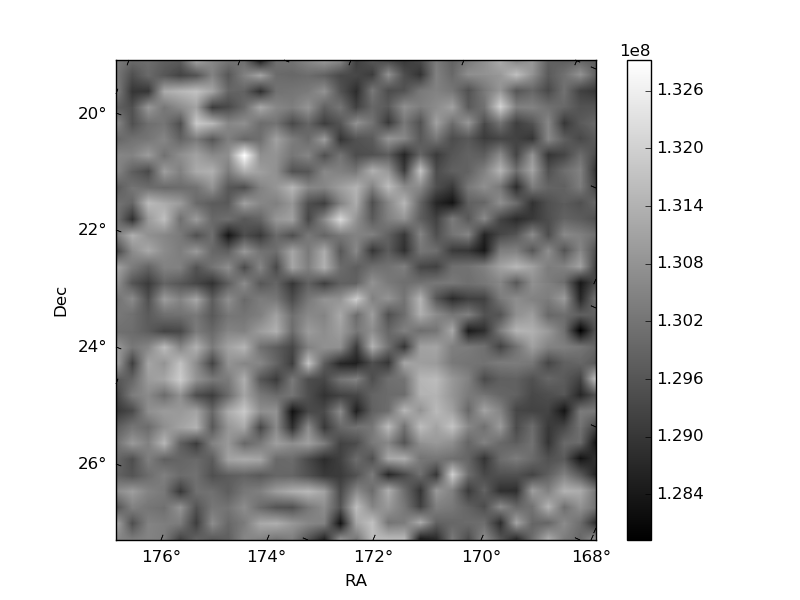
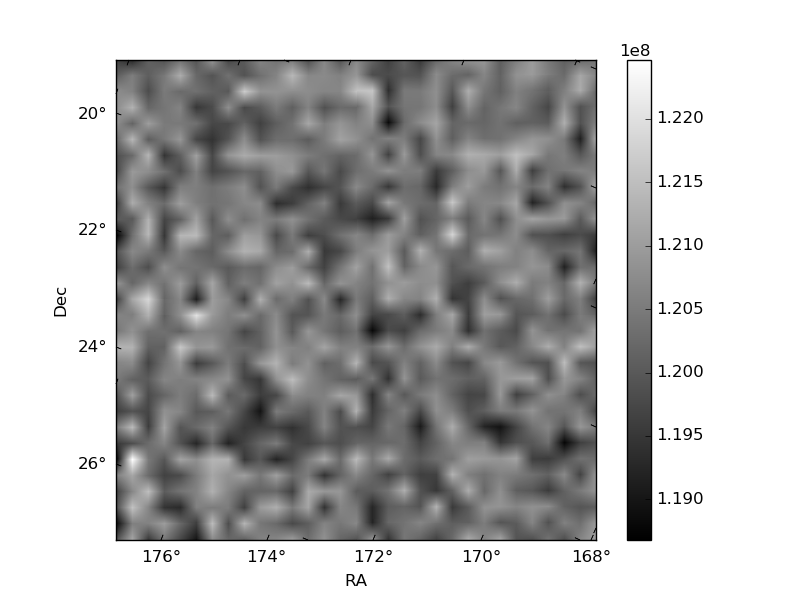
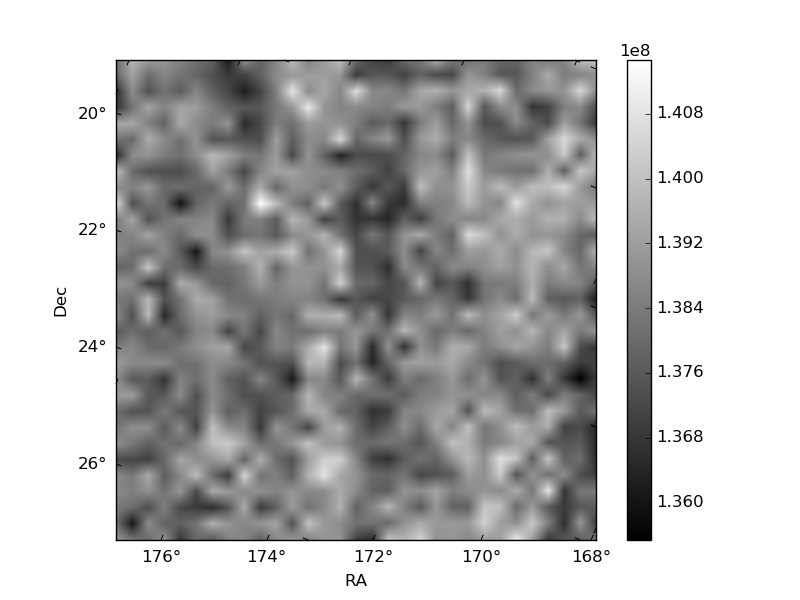
Histogram calculated using DETX and DETY for each event in the final _common_clean file
| Quadrant A | 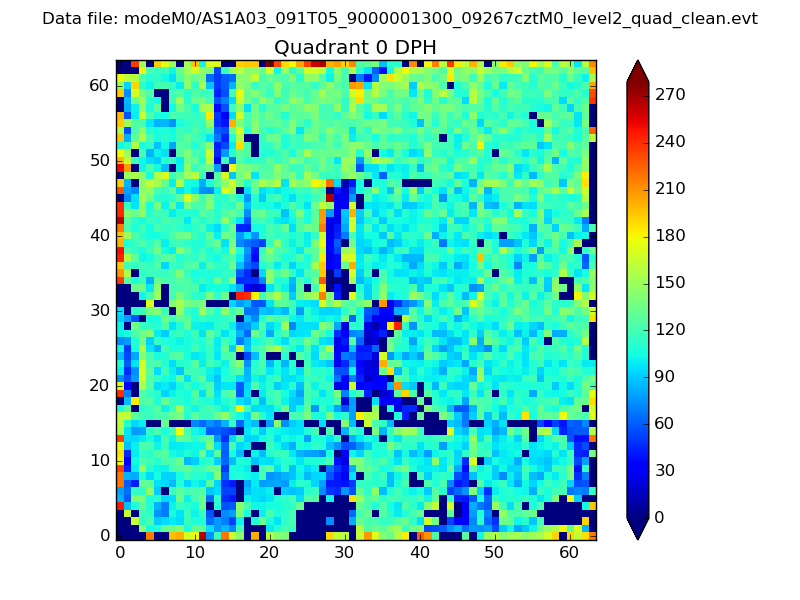 |
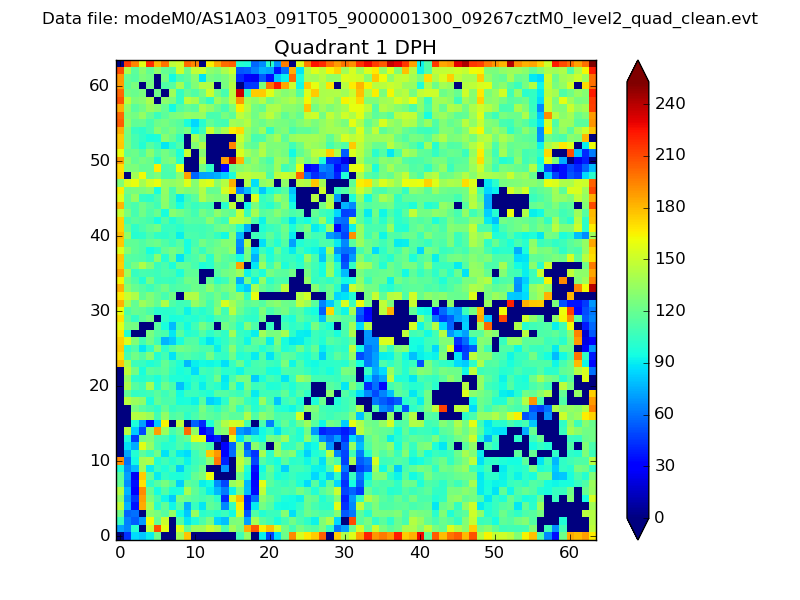 |
Quadrant B |
|---|---|---|---|
| Quadrant D |  |
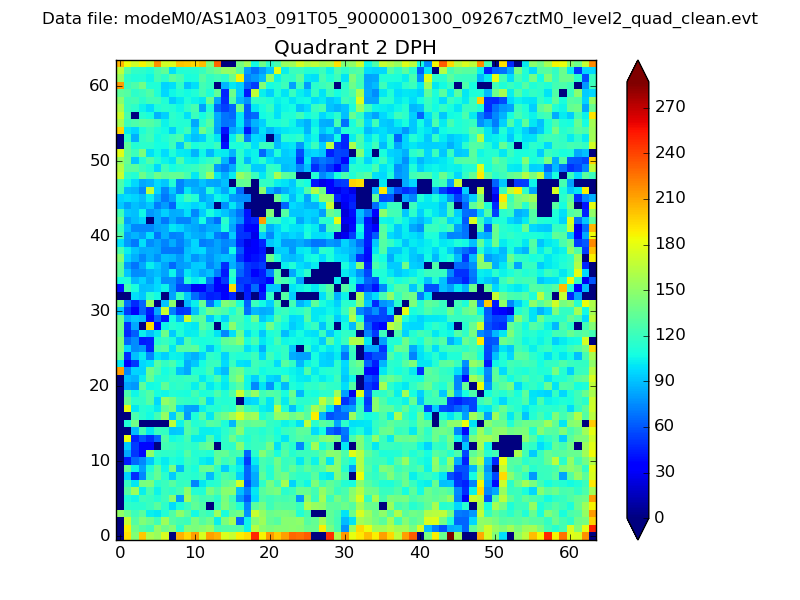 |
Quadrant C |
| Plot type | Count rate plots | Images |
|---|---|---|
| Comparison with Poisson distribution Blue bars denote a histogram of data divided into 1 sec bins. Red curve is a Poisson curve with rate = median count rate of data. |
 |
 |
| Quadrant-wise count rates Data is divided into 100 sec bins |
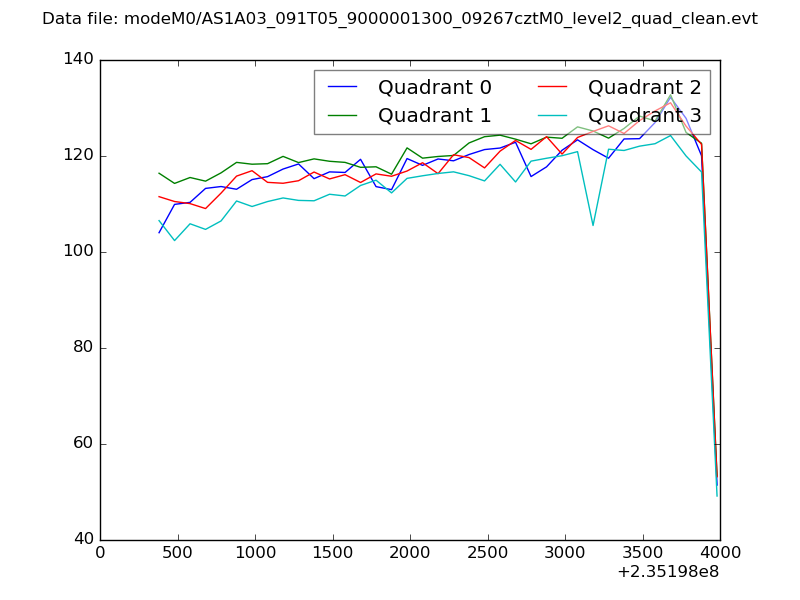 |
|
| Module-wise count rates for Quadrant A Data is divided into 100 sec bins |
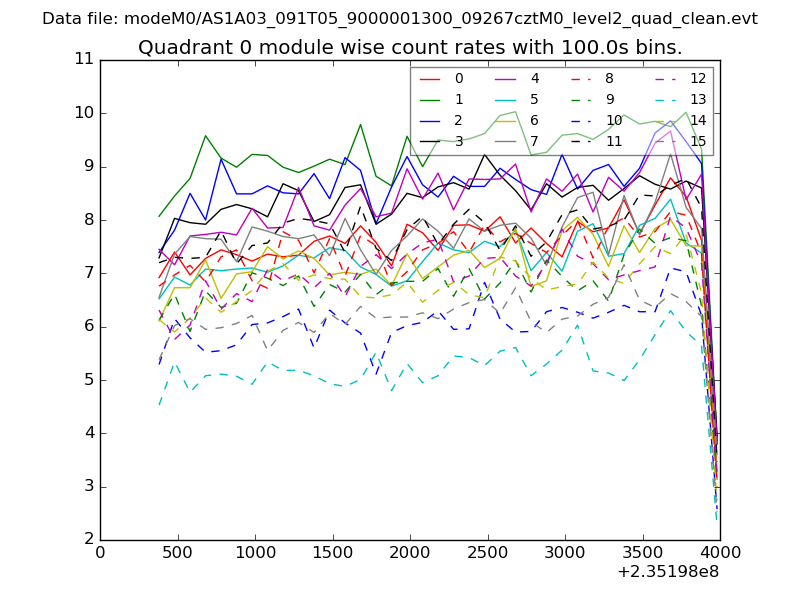 |
 |
| Module-wise count rates for Quadrant B Data is divided into 100 sec bins |
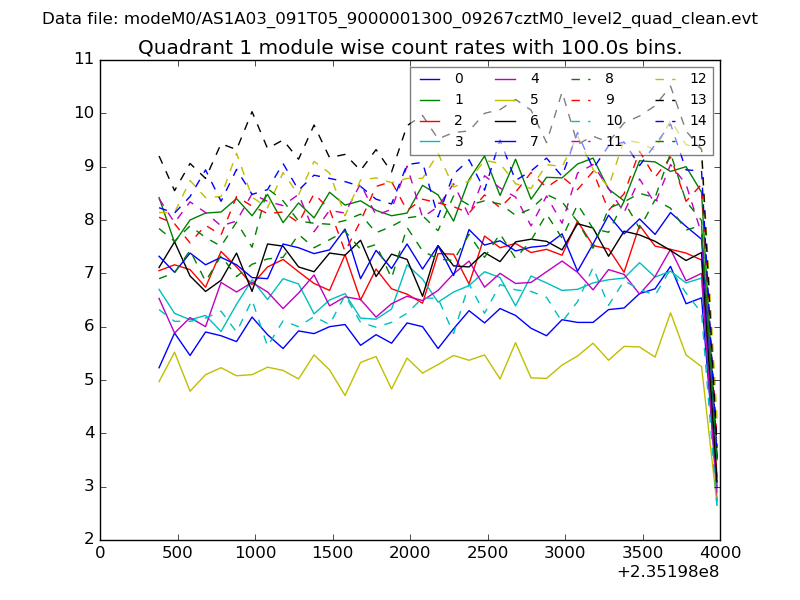 |
 |
| Module-wise count rates for Quadrant C Data is divided into 100 sec bins |
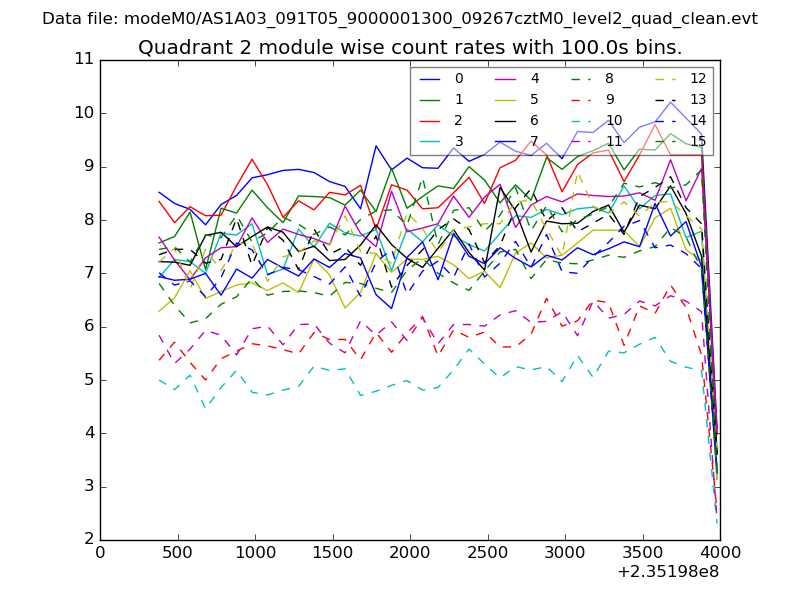 |
 |
| Module-wise count rates for Quadrant D Data is divided into 100 sec bins |
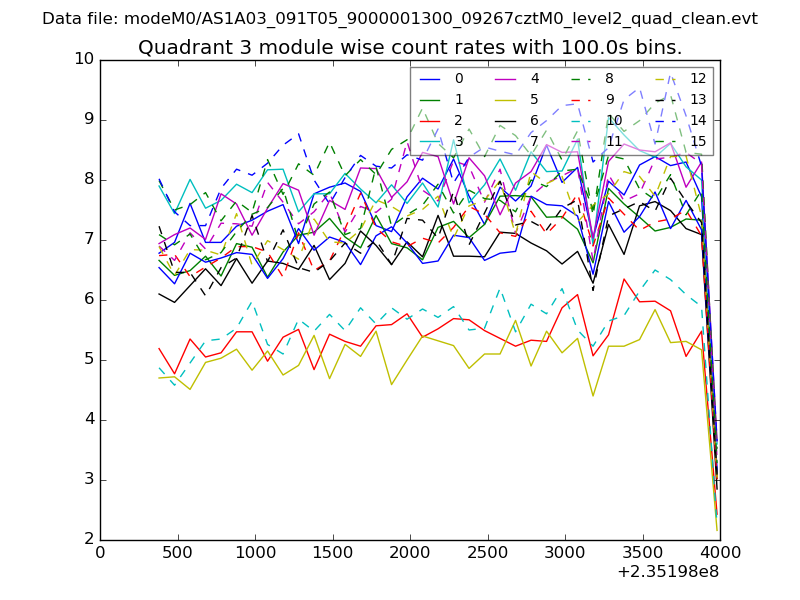 |
 |
| Parameter | Plot |
|---|---|
| CZT HV Monitor | 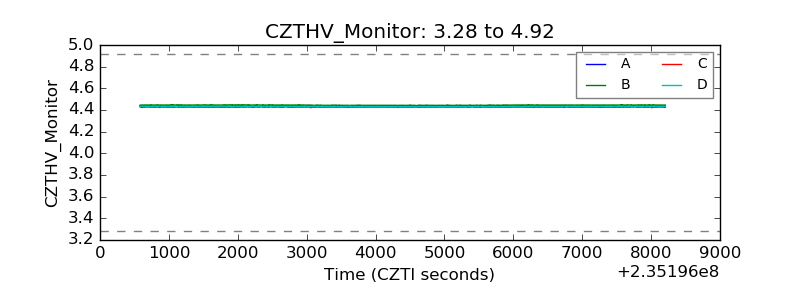 |
| D_VDD | 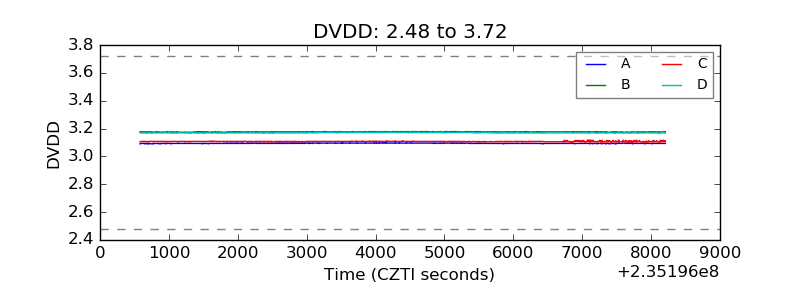 |
| Temperature 1 | 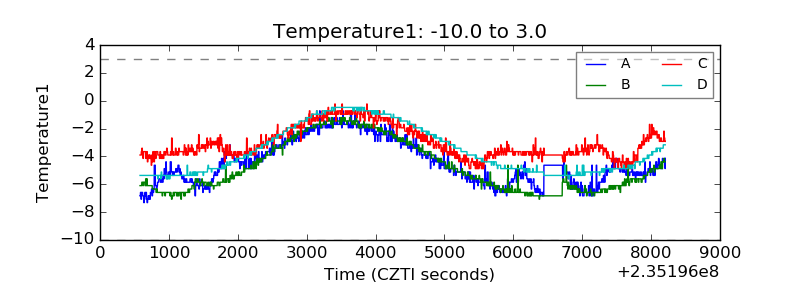 |
| Veto HV Monitor | 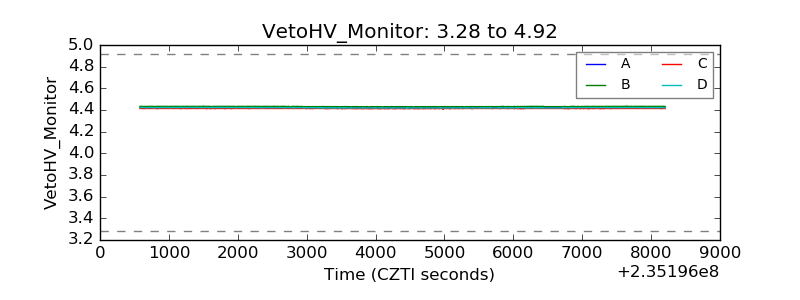 |
| Veto LLD | 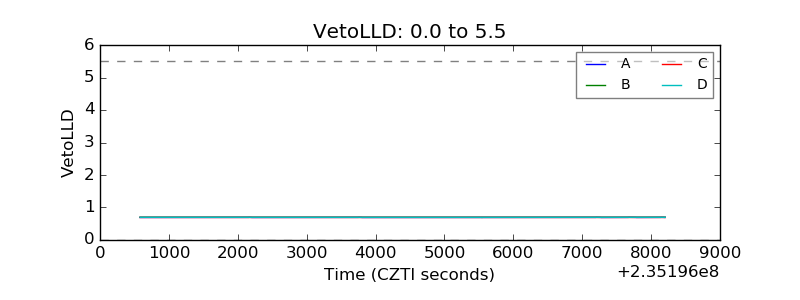 |
| Alpha Counter | 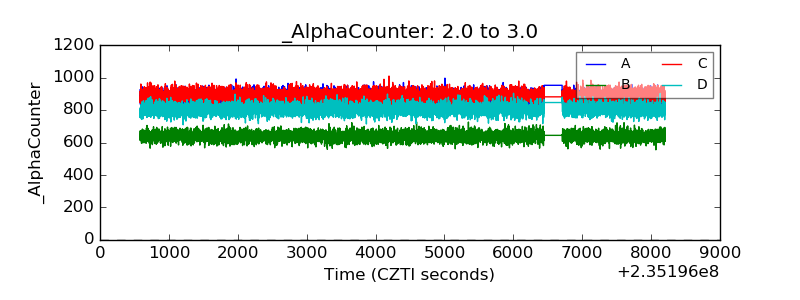 |
| _CPM_Rate | 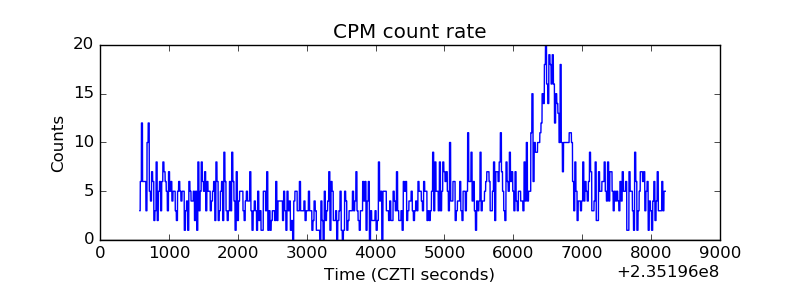 |
| CZT Counter | 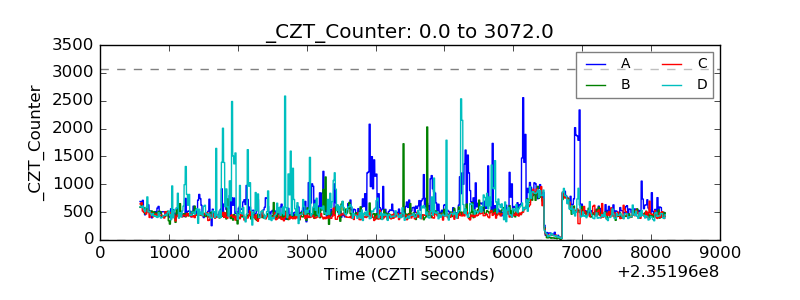 |
| +2.5 Volts monitor | 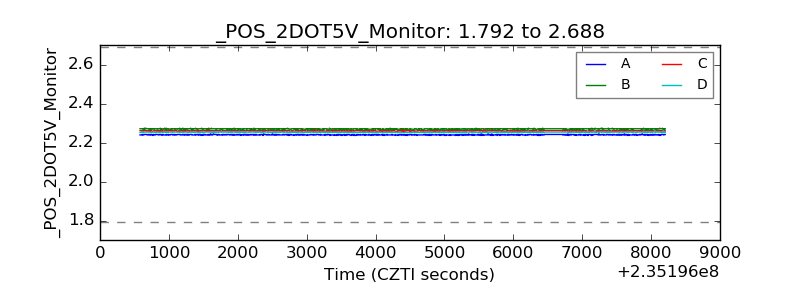 |
| +5 Volts monitor |  |
| _ROLL_ROT | 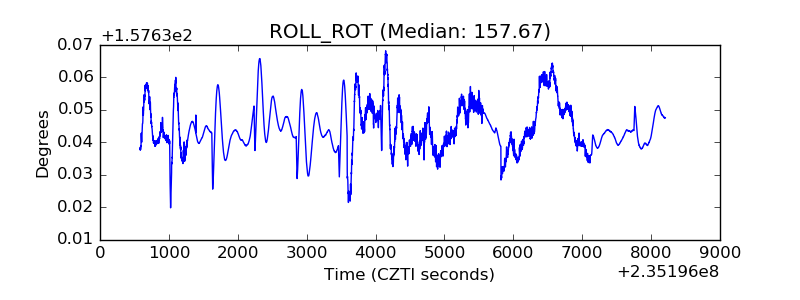 |
| _Roll_DEC | 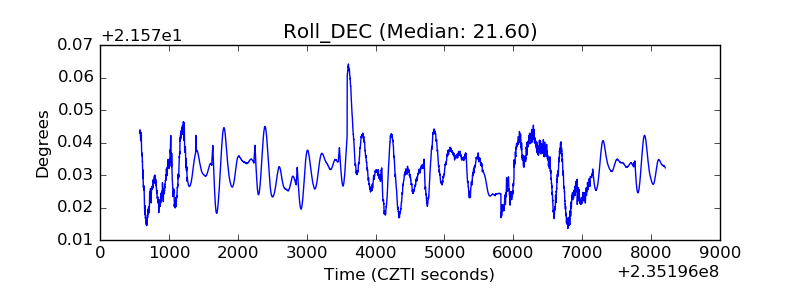 |
| _Roll_RA | 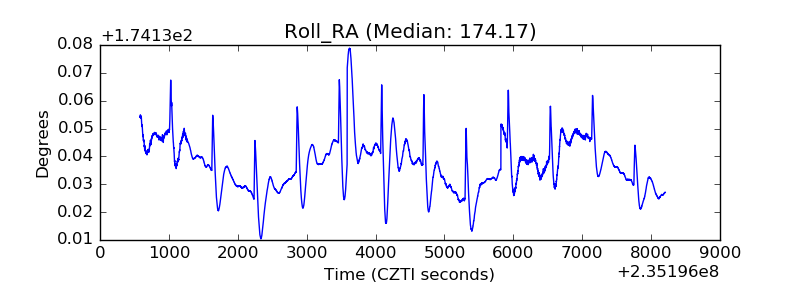 |
| Veto Counter | 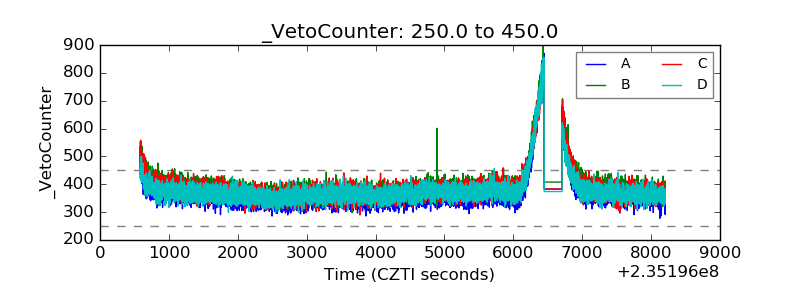 |