| Param | Original file | Final file |
|---|---|---|
| Filename | modeM0/AS1A03_091T05_9000001300_09268cztM0_level2.evt | modeM0/AS1A03_091T05_9000001300_09268cztM0_level2_quad_clean.evt |
| Size (bytes) | 311,797,440 | 51,312,960 |
| Size | 297.4 MB | 48.9 MB |
| Events in quadrant A | 2,662,247 | 312,257 |
| Events in quadrant B | 2,109,239 | 323,216 |
| Events in quadrant C | 1,995,902 | 314,779 |
| Events in quadrant D | 2,379,336 | 298,429 |
| Mode SS | |||
|---|---|---|---|
| Quadrant | BADHDUFLAG | Total packets | Discarded packets |
| A | 0 | 90 | 0 |
| B | 0 | 90 | 8 |
| C | 0 | 90 | 2 |
| D | 0 | 90 | 0 |
| Mode M0 | |||
|---|---|---|---|
| Quadrant | BADHDUFLAG | Total packets | Discarded packets |
| A | 0 | 10846 | 259 |
| B | 0 | 9371 | 202 |
| C | 0 | 9185 | 161 |
| D | 0 | 10295 | 245 |
| Mode M9 | |||
|---|---|---|---|
| Quadrant | BADHDUFLAG | Total packets | Discarded packets |
| A | 0 | 3 | 0 |
| B | 0 | 3 | 0 |
| C | 0 | 3 | 0 |
| D | 0 | 3 | 0 |
| Quadrant | Total seconds | Saturated seconds | Saturation percentage |
|---|---|---|---|
| A | 4324 | 249 | 5.758557% |
| B | 4341 | 193 | 4.445980% |
| C | 4357 | 169 | 3.878816% |
| D | 4322 | 219 | 5.067099% |
Noise dominated data is calculated using 1-second bins in cleaned event files. If a bin has >2000 counts, and if more than 50% of those come from <1% of pixels, then it is considered to be noise-dominated and hence unusable.
| Quadrant | # 1 sec bins | Bins with >0 counts | Bins with >2000 counts | High rate bins dominated by noise | Noise dominated (total time) | Noise dominated (detector-on time) | Marked lightcurve |
|---|---|---|---|---|---|---|---|
| A | 4696 | 4429 | 25 | 25 | 0.53% | 0.56% | 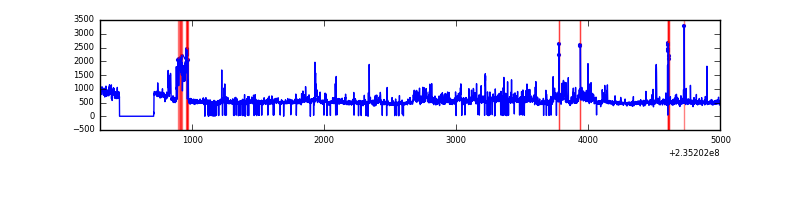 |
| B | 4696 | 4429 | 0 | 0 | 0.00% | 0.00% | 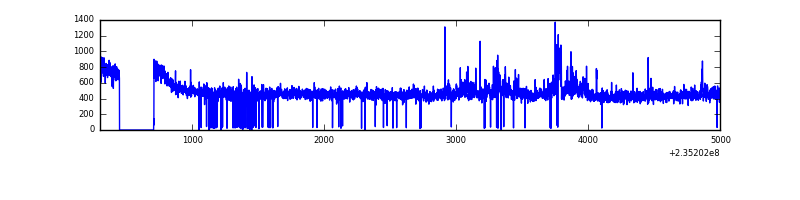 |
| C | 4696 | 4432 | 0 | 0 | 0.00% | 0.00% | 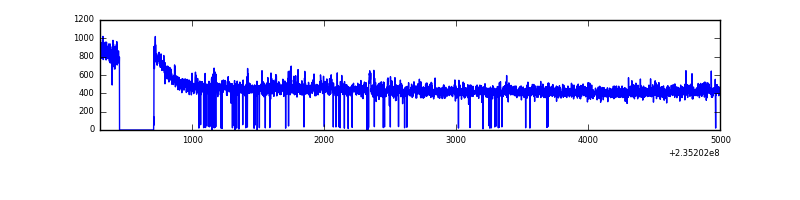 |
| D | 4696 | 4424 | 43 | 43 | 0.92% | 0.97% | 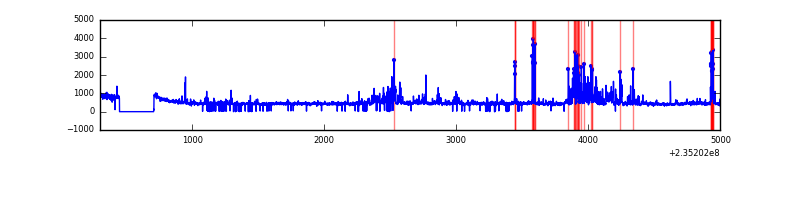 |
Top three noisy pixels from each quadrant. If the there are fewer than three noisy pixels in the level2.evt file, extra rows are filled as -1
| Pixel properties | Quadrant properties | ||||||
|---|---|---|---|---|---|---|---|
| Quadrant | DetID | PixID | Counts | Sigma | Mean | Median | Sigma |
| A | 8 | 5 | 435422 | 4092.9 | 507 | 495 | 106.3 |
| A | 15 | 174 | 129093 | 1210.18 | 507 | 495 | 106.3 |
| A | 5 | 16 | 56254 | 524.72 | 507 | 495 | 106.3 |
| B | 0 | 219 | 41014 | 403.14 | 514 | 501 | 100.5 |
| B | 0 | 214 | 27614 | 269.8 | 514 | 501 | 100.5 |
| B | 0 | 230 | 15994 | 154.17 | 514 | 501 | 100.5 |
| C | 9 | 68 | 19236 | 158.25 | 502 | 503 | 118.4 |
| C | 8 | 128 | 8338 | 66.19 | 502 | 503 | 118.4 |
| C | 8 | 112 | 4678 | 35.27 | 502 | 503 | 118.4 |
| D | 12 | 233 | 192401 | 1462.69 | 493 | 480 | 131.2 |
| D | 1 | 52 | 111148 | 843.43 | 493 | 480 | 131.2 |
| D | 7 | 71 | 103444 | 784.72 | 493 | 480 | 131.2 |
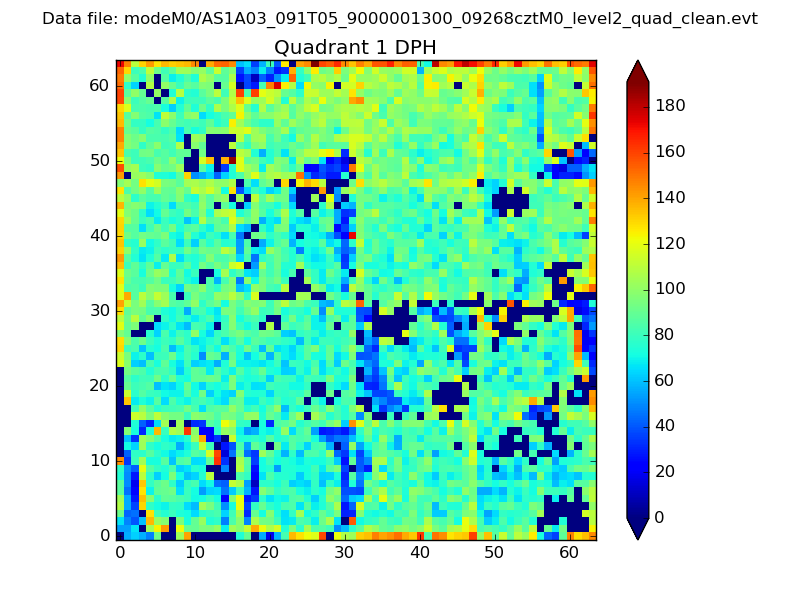
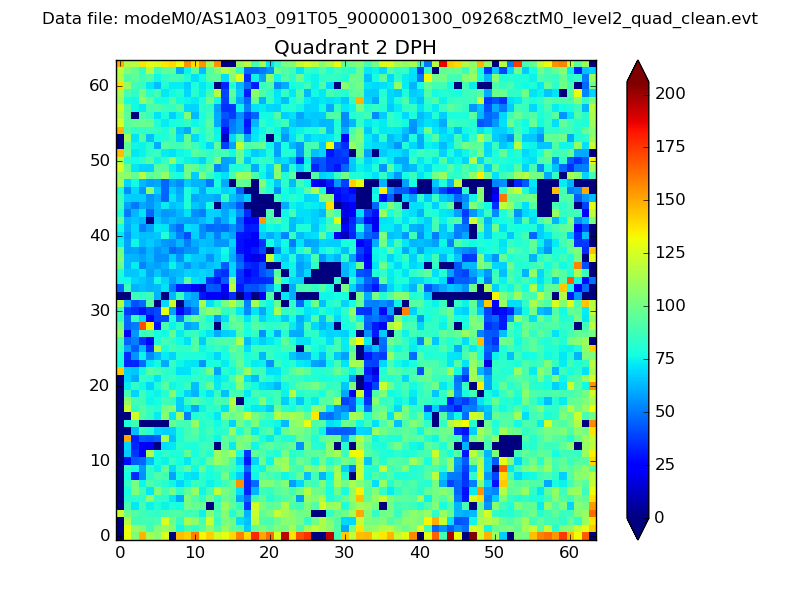
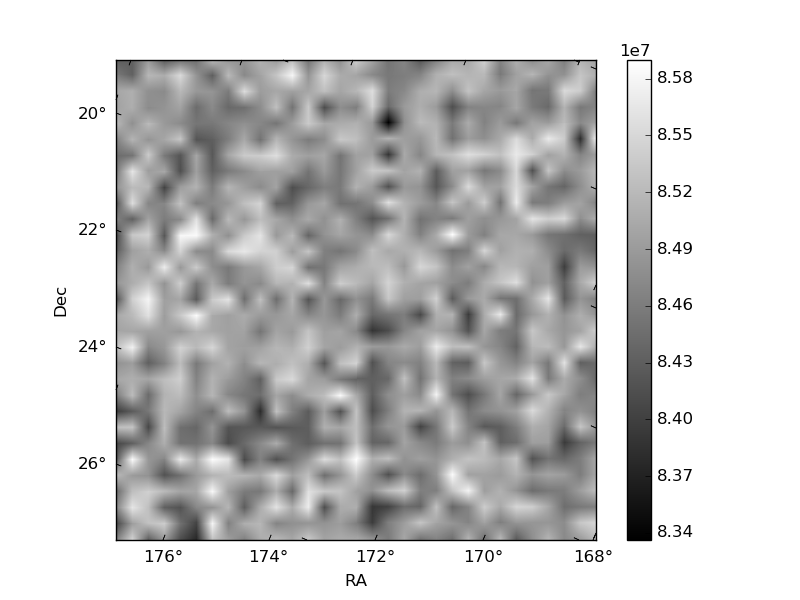
Histogram calculated using DETX and DETY for each event in the final _common_clean file
| Quadrant A |  |
 |
Quadrant B |
|---|---|---|---|
| Quadrant D |  |
 |
Quadrant C |
| Plot type | Count rate plots | Images |
|---|---|---|
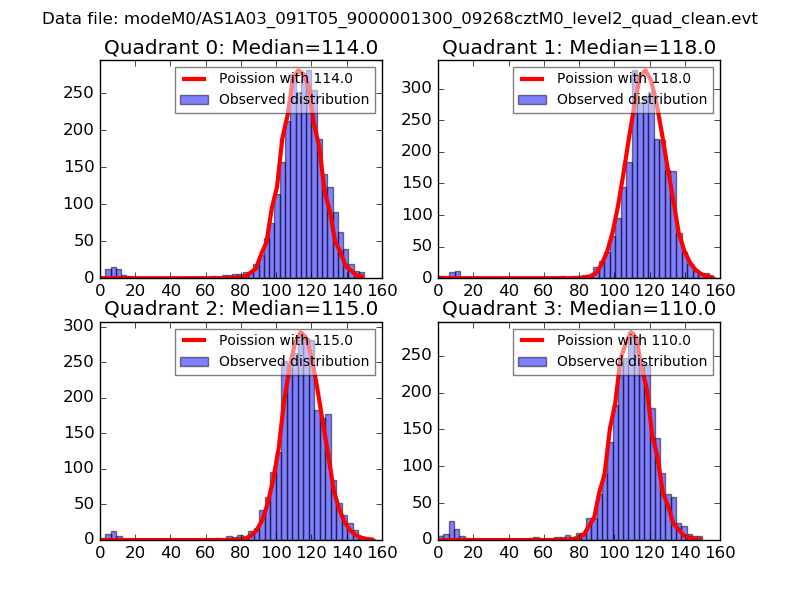
| Comparison with Poisson distribution Blue bars denote a histogram of data divided into 1 sec bins. Red curve is a Poisson curve with rate = median count rate of data. |
 |
 |
| Quadrant-wise count rates Data is divided into 100 sec bins |
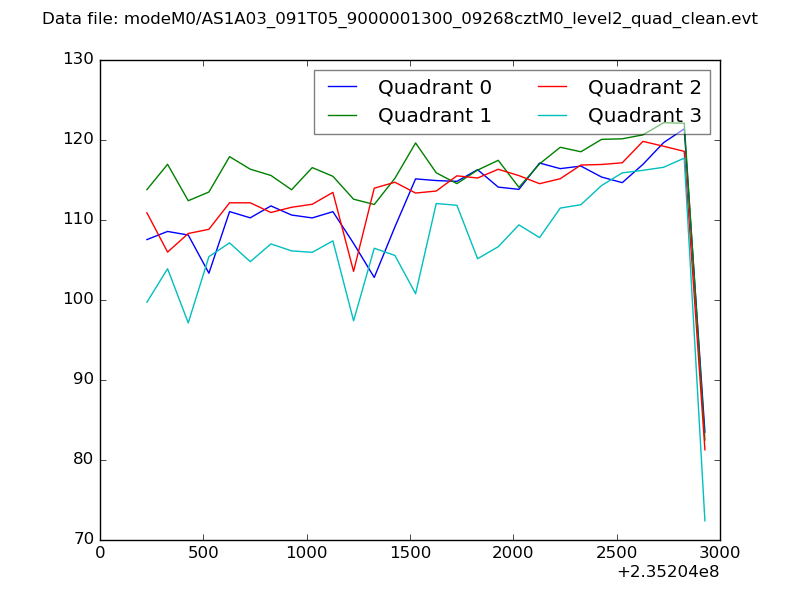 |
|
| Module-wise count rates for Quadrant A Data is divided into 100 sec bins |
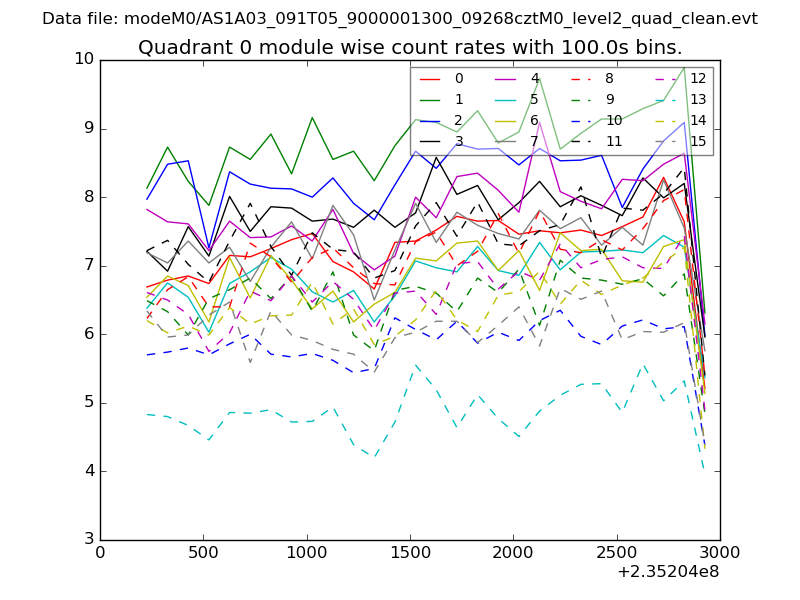 |
 |
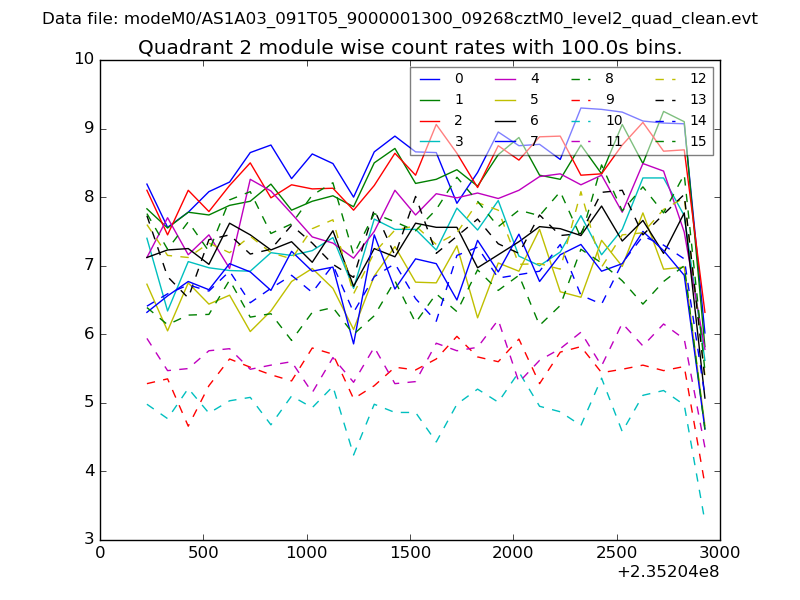
| Module-wise count rates for Quadrant B Data is divided into 100 sec bins |
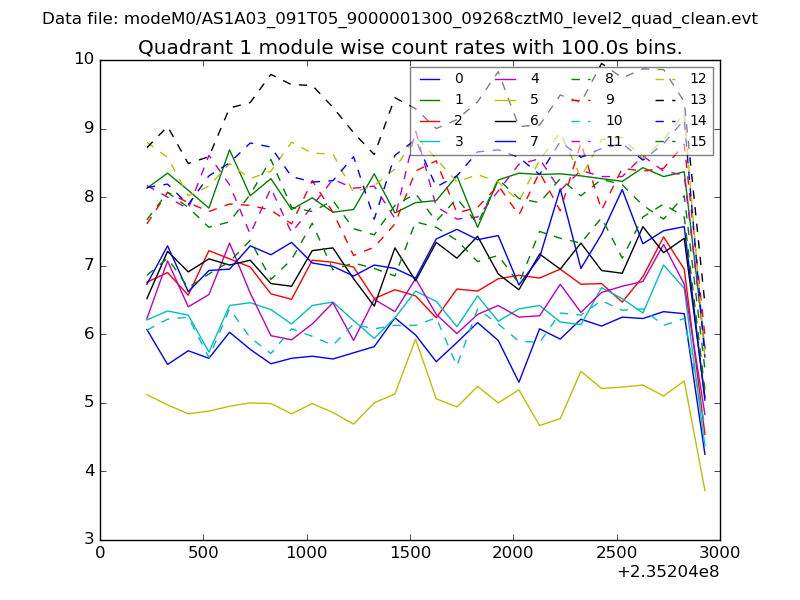 |
 |
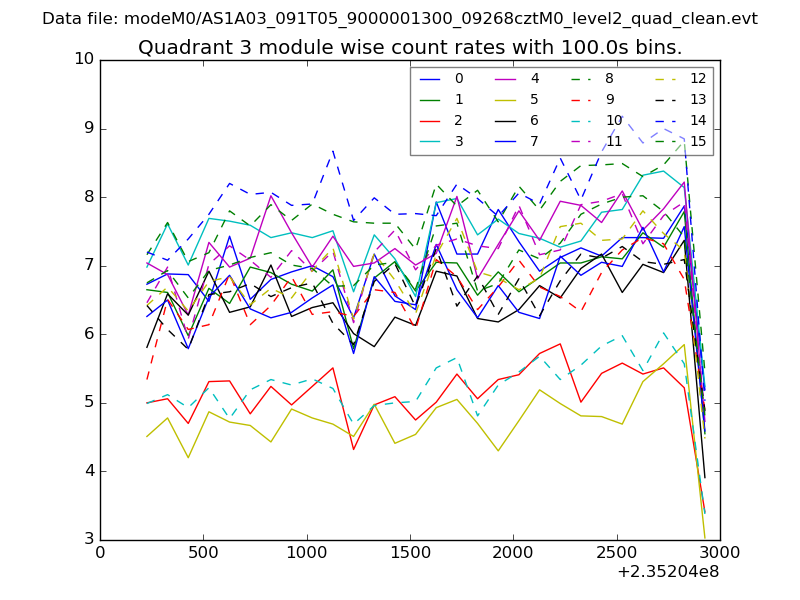
| Module-wise count rates for Quadrant C Data is divided into 100 sec bins |
 |
 |
| Module-wise count rates for Quadrant D Data is divided into 100 sec bins |
 |
 |
| Parameter | Plot |
|---|---|
| CZT HV Monitor | 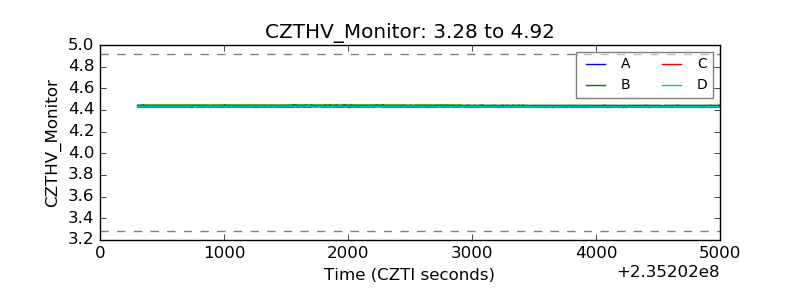 |
| D_VDD | 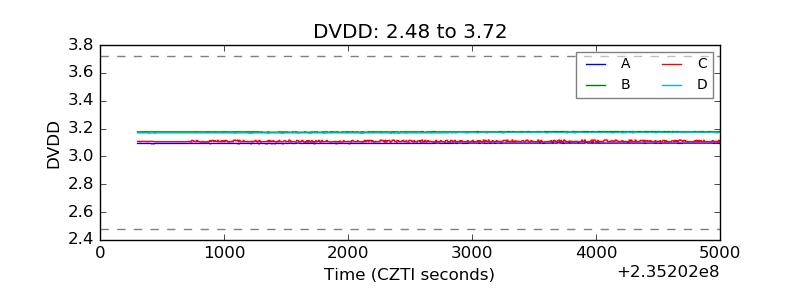 |
| Temperature 1 | 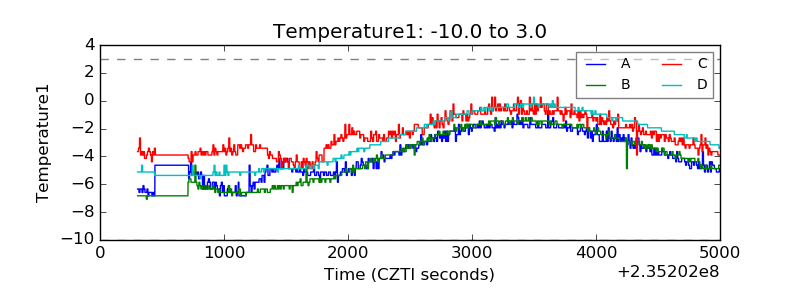 |
| Veto HV Monitor | 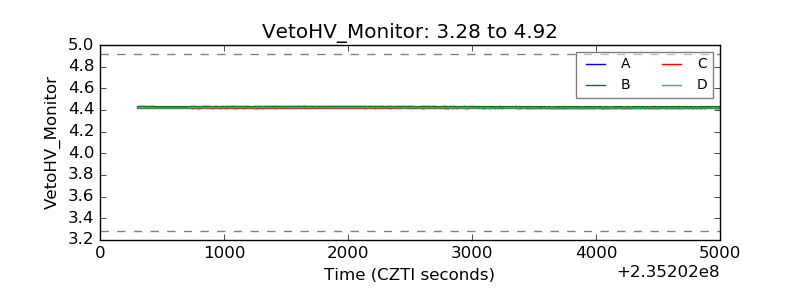 |
| Veto LLD | 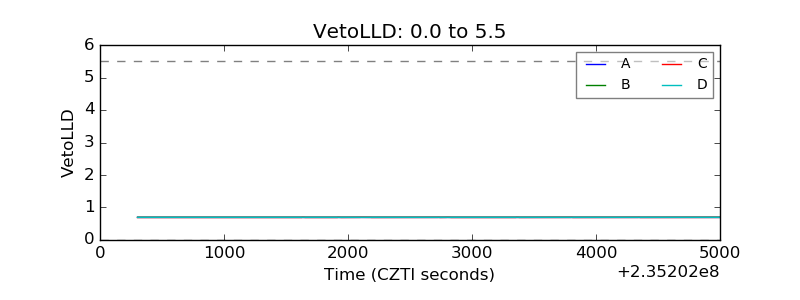 |
| Alpha Counter | 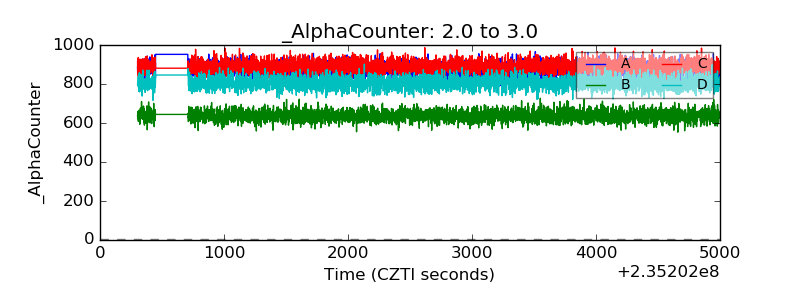 |
| _CPM_Rate | 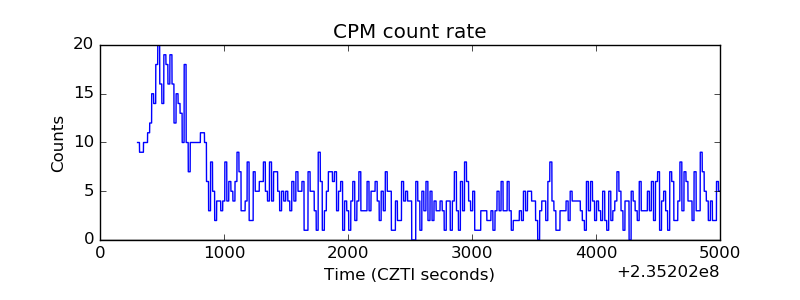 |
| CZT Counter | 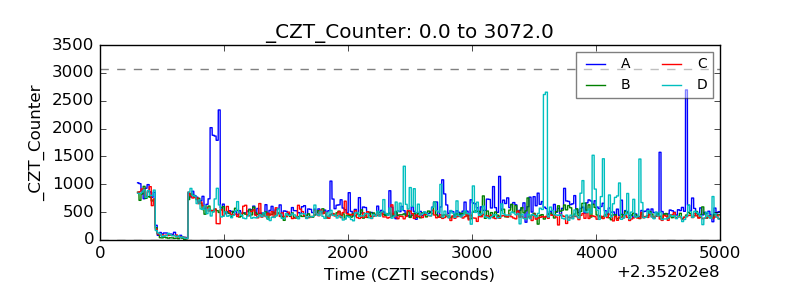 |
| +2.5 Volts monitor |  |
| +5 Volts monitor |  |
| _ROLL_ROT | 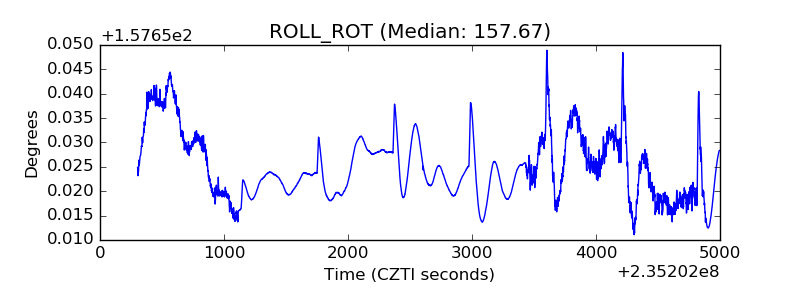 |
| _Roll_DEC | 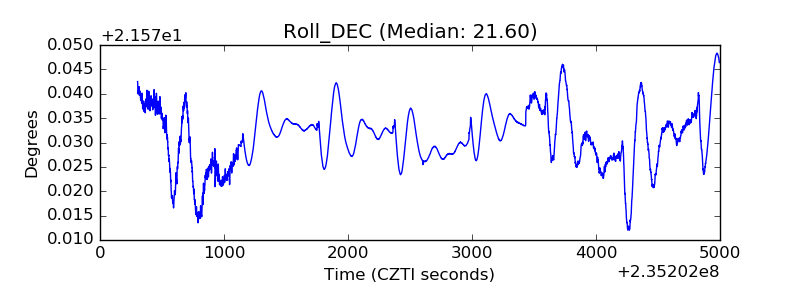 |
| _Roll_RA | 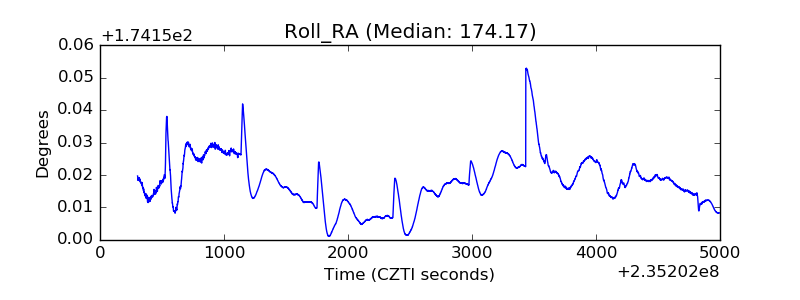 |
| Veto Counter | 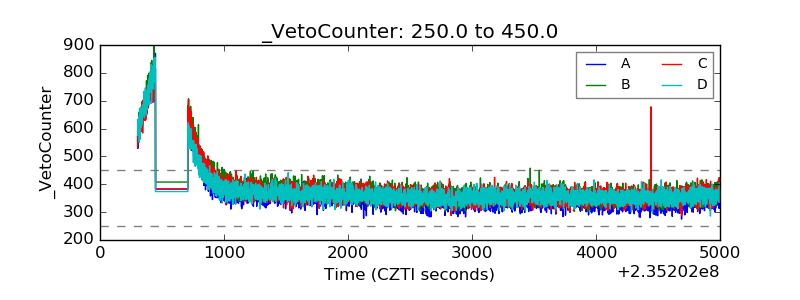 |