| Param | Original file | Final file |
|---|---|---|
| Filename | modeM0/AS1A03_091T06_9000001302cztM0_level2.fits | modeM0/AS1A03_091T06_9000001302cztM0_level2_quad_clean.evt |
| Size (bytes) | 133,079,040 | 136,128,960 |
| Size | 126.9 MB | 129.8 MB |
| Events in quadrant A | 770,778 | 795,690 |
| Events in quadrant B | 770,580 | 819,692 |
| Events in quadrant C | 795,382 | 787,935 |
| Events in quadrant D | 675,886 | 702,208 |
| Mode SS | |||
|---|---|---|---|
| Quadrant | BADHDUFLAG | Total packets | Discarded packets |
| A | 0 | 304 | 0 |
| B | 0 | 310 | 0 |
| C | 0 | 298 | 0 |
| D | 0 | 302 | 0 |
| Mode M0 | |||
|---|---|---|---|
| Quadrant | BADHDUFLAG | Total packets | Discarded packets |
| A | 0 | 39423 | 0 |
| B | 0 | 31151 | 0 |
| C | 0 | 30429 | 0 |
| D | 0 | 35291 | 0 |
| Mode M9 | |||
|---|---|---|---|
| Quadrant | BADHDUFLAG | Total packets | Discarded packets |
| A | 0 | 10 | 0 |
| B | 0 | 9 | 0 |
| C | 0 | 10 | 0 |
| D | 0 | 10 | 0 |
| Quadrant | Total seconds | Saturated seconds | Saturation percentage |
|---|---|---|---|
| A | 14574 | 749 | 5.139289% |
| B | 14707 | 467 | 3.175359% |
| C | 14803 | 340 | 2.296832% |
| D | 14736 | 727 | 4.933496% |
Noise dominated data is calculated using 1-second bins in cleaned event files. If a bin has >2000 counts, and if more than 50% of those come from <1% of pixels, then it is considered to be noise-dominated and hence unusable.
| Quadrant | # 1 sec bins | Bins with >0 counts | Bins with >2000 counts | High rate bins dominated by noise | Noise dominated (total time) | Noise dominated (detector-on time) | Marked lightcurve |
|---|---|---|---|---|---|---|---|
| A | 17115 | 15184 | 0 | 0 | 0.00% | 0.00% |  |
| B | 17114 | 15275 | 0 | 0 | 0.00% | 0.00% |  |
| C | 17115 | 15369 | 0 | 0 | 0.00% | 0.00% | 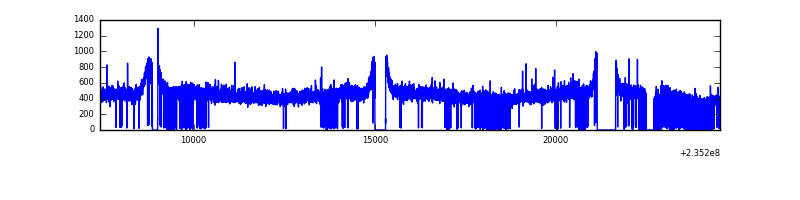 |
| D | 17115 | 15274 | 0 | 0 | 0.00% | 0.00% |  |
Top three noisy pixels from each quadrant. If the there are fewer than three noisy pixels in the level2.evt file, extra rows are filled as -1
| Pixel properties | Quadrant properties | ||||||
|---|---|---|---|---|---|---|---|
| Quadrant | DetID | PixID | Counts | Sigma | Mean | Median | Sigma |
| A | 0 | 29 | 702 | 9.66 | 200 | 187 | 53.3 |
| A | 7 | 110 | 666 | 8.99 | 200 | 187 | 53.3 |
| A | 15 | 236 | 577 | 7.32 | 200 | 187 | 53.3 |
| B | 2 | 9 | 642 | 10.23 | 203 | 192 | 44.0 |
| B | 14 | 254 | 552 | 8.18 | 203 | 192 | 44.0 |
| B | 5 | 128 | 538 | 7.86 | 203 | 192 | 44.0 |
| C | 12 | 241 | 570 | 6.62 | 209 | 193 | 56.9 |
| C | 1 | 81 | 557 | 6.4 | 209 | 193 | 56.9 |
| C | 1 | 80 | 554 | 6.34 | 209 | 193 | 56.9 |
| D | 3 | 14 | 540 | 6.93 | 192 | 174 | 52.8 |
| D | 3 | 31 | 513 | 6.42 | 192 | 174 | 52.8 |
| D | 1 | 3 | 505 | 6.27 | 192 | 174 | 52.8 |
Histogram calculated using DETX and DETY for each event in the final _common_clean file
| Quadrant A | 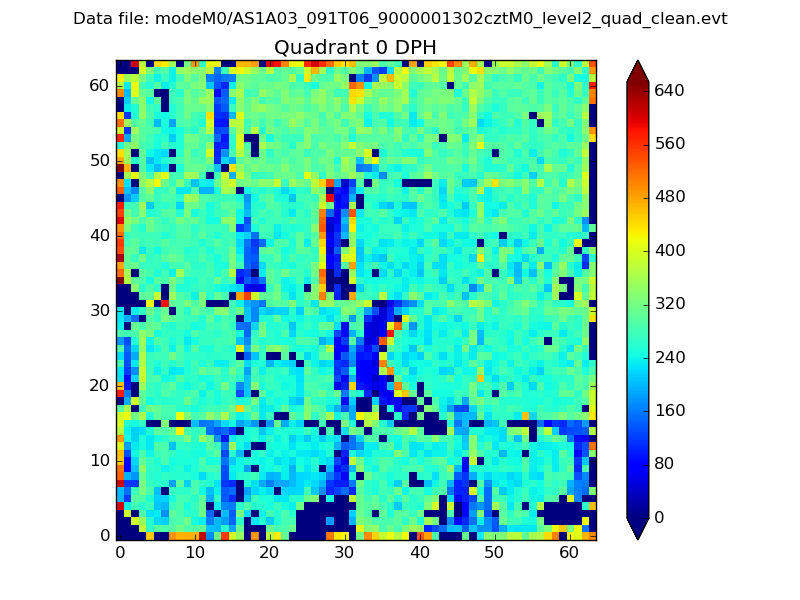 |
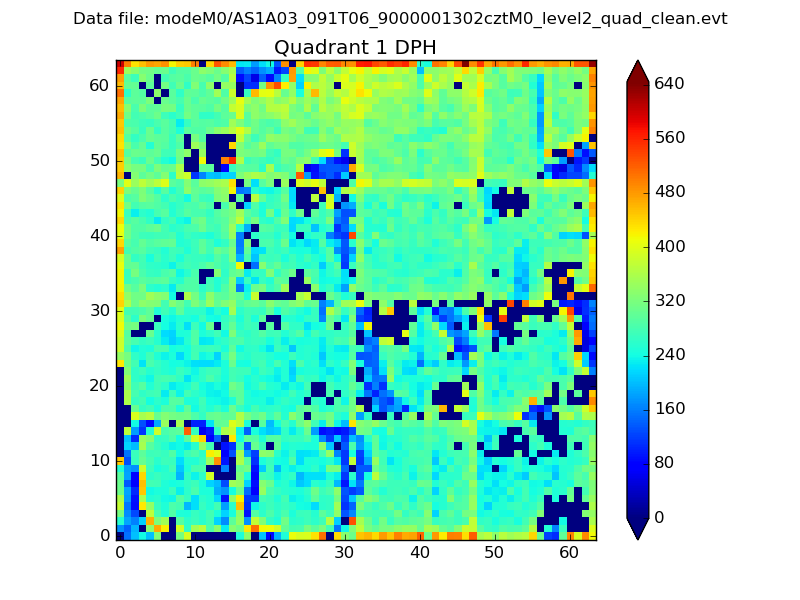 |
Quadrant B |
|---|---|---|---|
| Quadrant D |  |
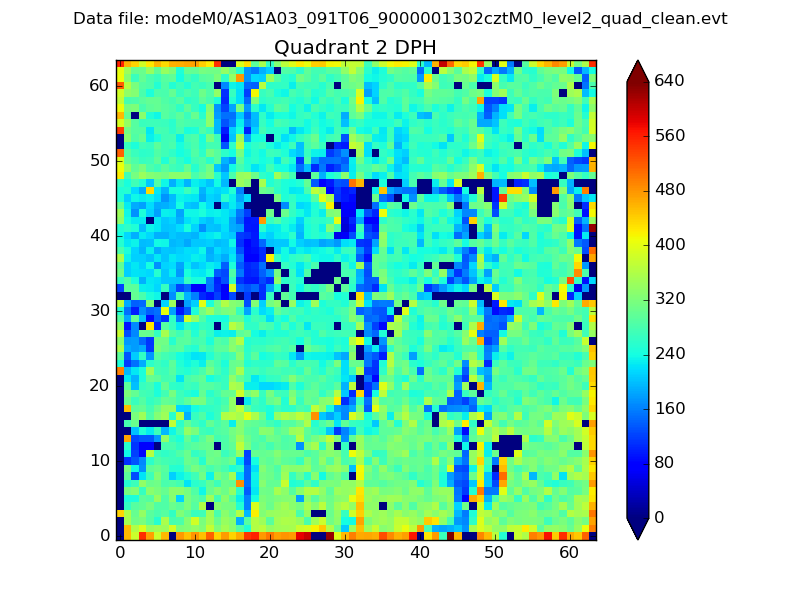 |
Quadrant C |
| Plot type | Count rate plots | Images |
|---|---|---|
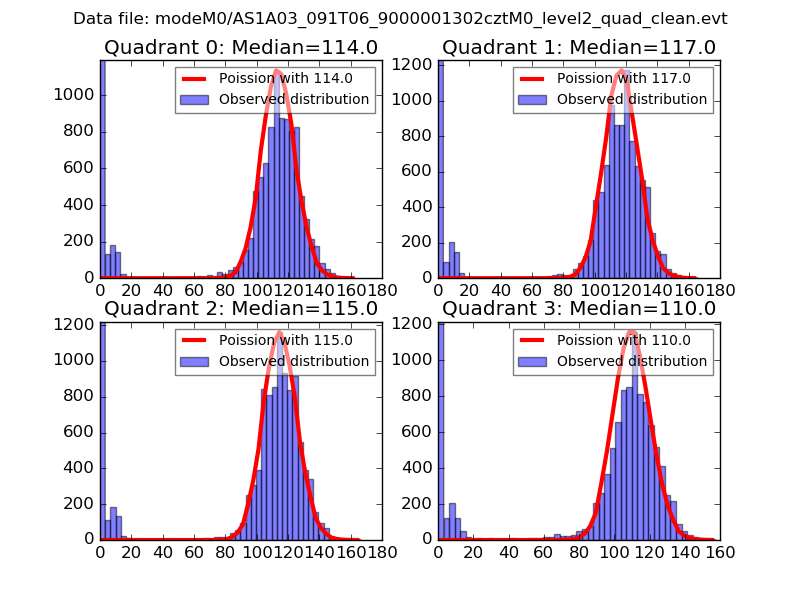
| Comparison with Poisson distribution Blue bars denote a histogram of data divided into 1 sec bins. Red curve is a Poisson curve with rate = median count rate of data. |
 |
 |
| Quadrant-wise count rates Data is divided into 100 sec bins |
 |
|
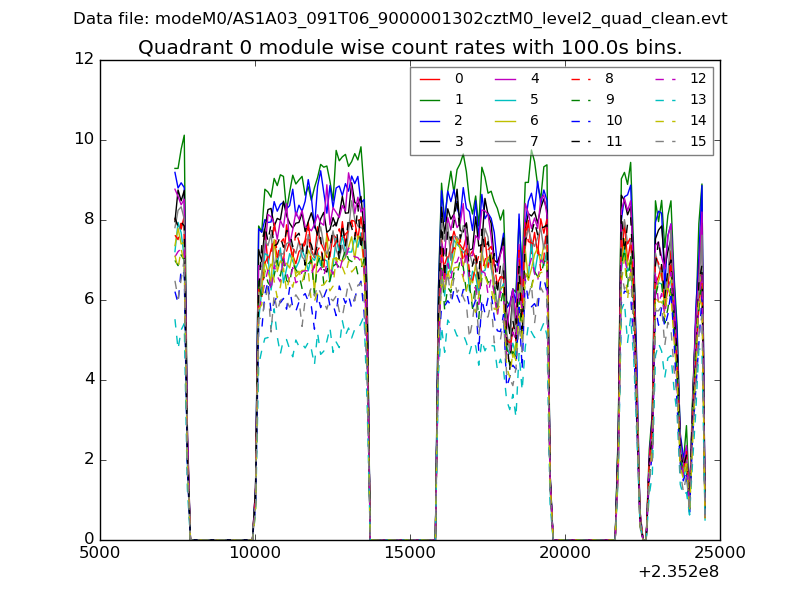
| Module-wise count rates for Quadrant A Data is divided into 100 sec bins |
 |
 |
| Module-wise count rates for Quadrant B Data is divided into 100 sec bins |
 |
 |
| Module-wise count rates for Quadrant C Data is divided into 100 sec bins |
 |
 |
| Module-wise count rates for Quadrant D Data is divided into 100 sec bins |
 |
 |
| Parameter | Plot |
|---|---|
| CZT HV Monitor |  |
| D_VDD |  |
| Temperature 1 | 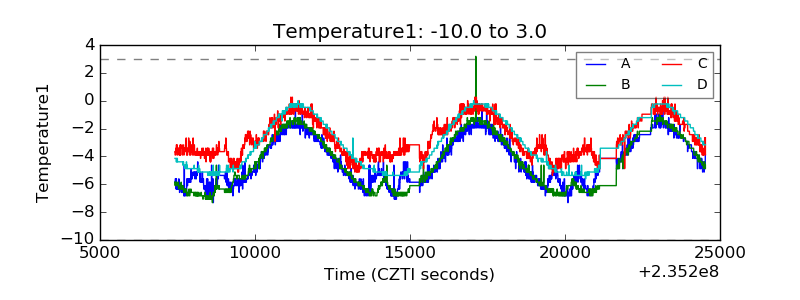 |
| Veto HV Monitor |  |
| Veto LLD |  |
| Alpha Counter |  |
| _CPM_Rate | 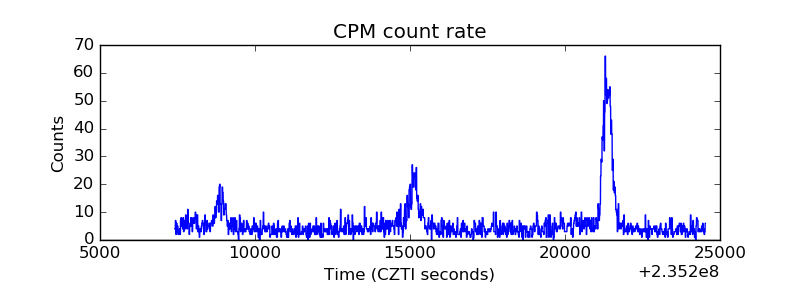 |
| CZT Counter | 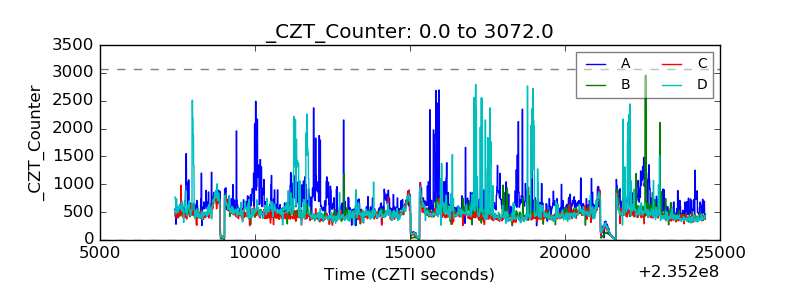 |
| +2.5 Volts monitor |  |
| +5 Volts monitor |  |
| _ROLL_ROT |  |
| _Roll_DEC |  |
| _Roll_RA | 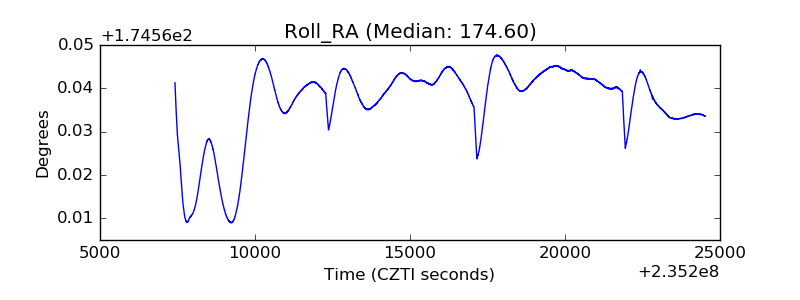 |
| Veto Counter | 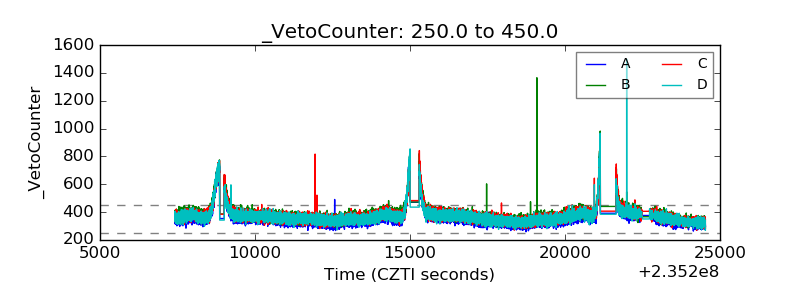 |