| Param | Original file | Final file |
|---|---|---|
| Filename | modeM0/AS1A03_091T06_9000001302_09268cztM0_level2.evt | modeM0/AS1A03_091T06_9000001302_09268cztM0_level2_quad_clean.evt |
| Size (bytes) | 221,489,280 | 20,142,720 |
| Size | 211.2 MB | 19.2 MB |
| Events in quadrant A | 2,020,119 | 99,683 |
| Events in quadrant B | 1,431,035 | 105,871 |
| Events in quadrant C | 1,421,774 | 103,423 |
| Events in quadrant D | 1,640,046 | 97,859 |
| Mode SS | |||
|---|---|---|---|
| Quadrant | BADHDUFLAG | Total packets | Discarded packets |
| A | 0 | 60 | 2 |
| B | 0 | 60 | 4 |
| C | 0 | 60 | 4 |
| D | 0 | 60 | 6 |
| Mode M0 | |||
|---|---|---|---|
| Quadrant | BADHDUFLAG | Total packets | Discarded packets |
| A | 0 | 8397 | 535 |
| B | 0 | 6358 | 307 |
| C | 0 | 6328 | 257 |
| D | 0 | 6953 | 300 |
| Mode M9 | |||
|---|---|---|---|
| Quadrant | BADHDUFLAG | Total packets | Discarded packets |
| A | 0 | 2 | 0 |
| B | 0 | 2 | 0 |
| C | 0 | 2 | 0 |
| D | 0 | 2 | 0 |
| Quadrant | Total seconds | Saturated seconds | Saturation percentage |
|---|---|---|---|
| A | 2810 | 308 | 10.960854% |
| B | 2837 | 216 | 7.613676% |
| C | 2856 | 166 | 5.812325% |
| D | 2853 | 182 | 6.379250% |
Noise dominated data is calculated using 1-second bins in cleaned event files. If a bin has >2000 counts, and if more than 50% of those come from <1% of pixels, then it is considered to be noise-dominated and hence unusable.
| Quadrant | # 1 sec bins | Bins with >0 counts | Bins with >2000 counts | High rate bins dominated by noise | Noise dominated (total time) | Noise dominated (detector-on time) | Marked lightcurve |
|---|---|---|---|---|---|---|---|
| A | 3130 | 2949 | 48 | 48 | 1.53% | 1.63% | 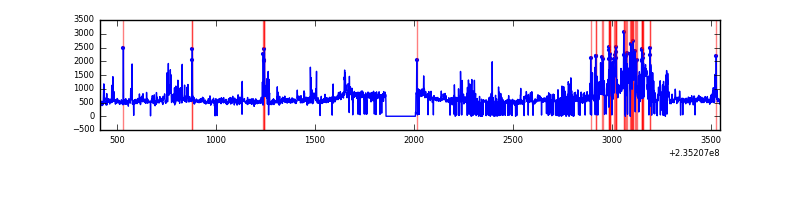 |
| B | 3130 | 2957 | 0 | 0 | 0.00% | 0.00% | 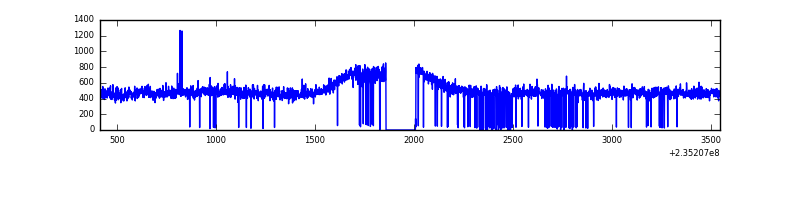 |
| C | 3130 | 2964 | 0 | 0 | 0.00% | 0.00% | 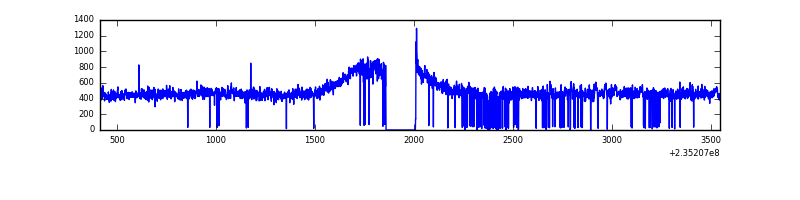 |
| D | 3130 | 2958 | 26 | 26 | 0.83% | 0.88% | 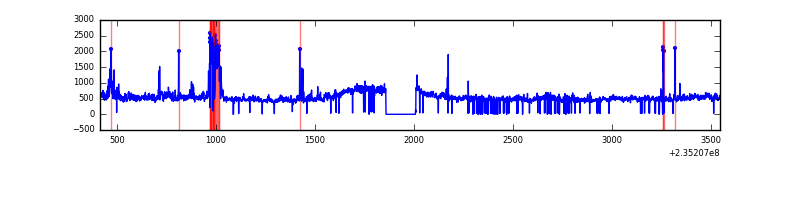 |
Top three noisy pixels from each quadrant. If the there are fewer than three noisy pixels in the level2.evt file, extra rows are filled as -1
| Pixel properties | Quadrant properties | ||||||
|---|---|---|---|---|---|---|---|
| Quadrant | DetID | PixID | Counts | Sigma | Mean | Median | Sigma |
| A | 8 | 5 | 346254 | 4610.82 | 355 | 345 | 75.0 |
| A | 5 | 16 | 229982 | 3060.96 | 355 | 345 | 75.0 |
| A | 4 | 2 | 40934 | 541.03 | 355 | 345 | 75.0 |
| B | 12 | 111 | 8324 | 108.91 | 366 | 356 | 73.2 |
| B | 11 | 111 | 6720 | 86.98 | 366 | 356 | 73.2 |
| B | 14 | 111 | 4966 | 63.01 | 366 | 356 | 73.2 |
| C | 9 | 68 | 10135 | 114.52 | 359 | 360 | 85.4 |
| C | 13 | 61 | 2765 | 28.18 | 359 | 360 | 85.4 |
| C | 8 | 128 | 2673 | 27.1 | 359 | 360 | 85.4 |
| D | 1 | 52 | 149057 | 1678.47 | 355 | 342 | 88.6 |
| D | 7 | 71 | 94547 | 1063.24 | 355 | 342 | 88.6 |
| D | 2 | 136 | 25088 | 279.29 | 355 | 342 | 88.6 |
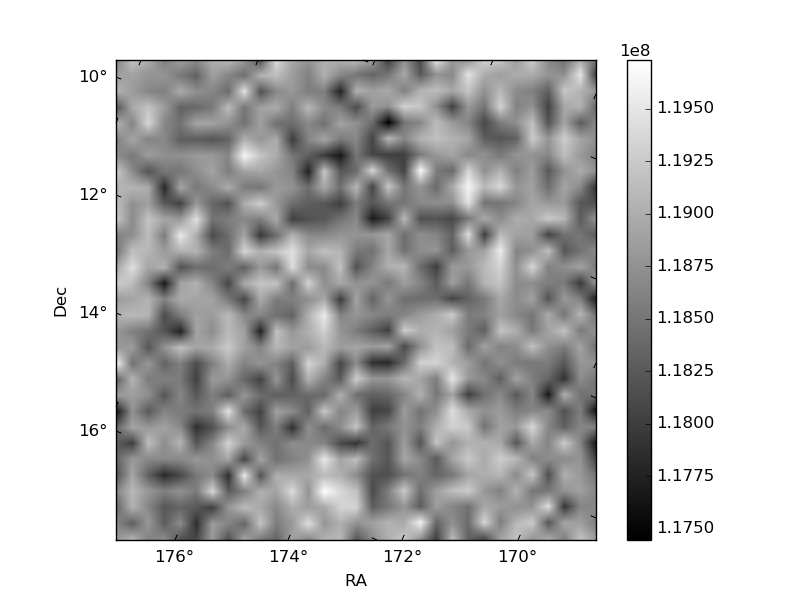
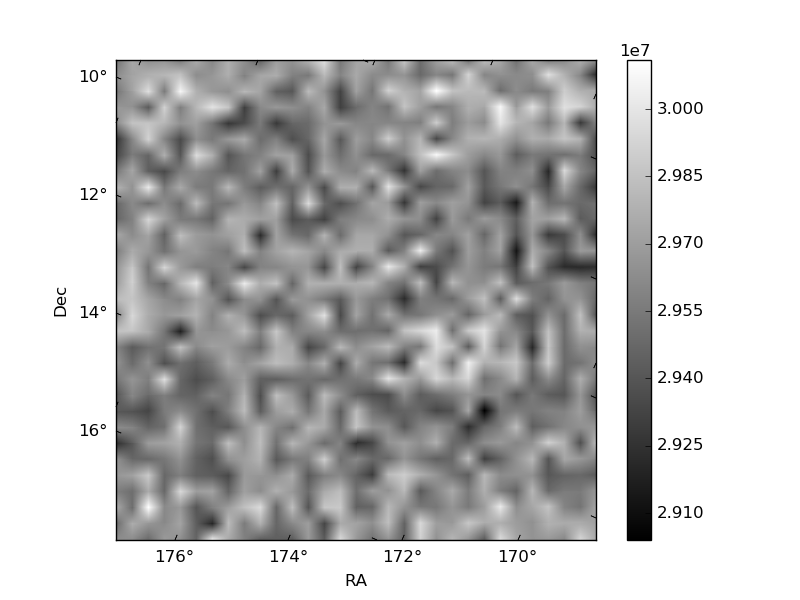
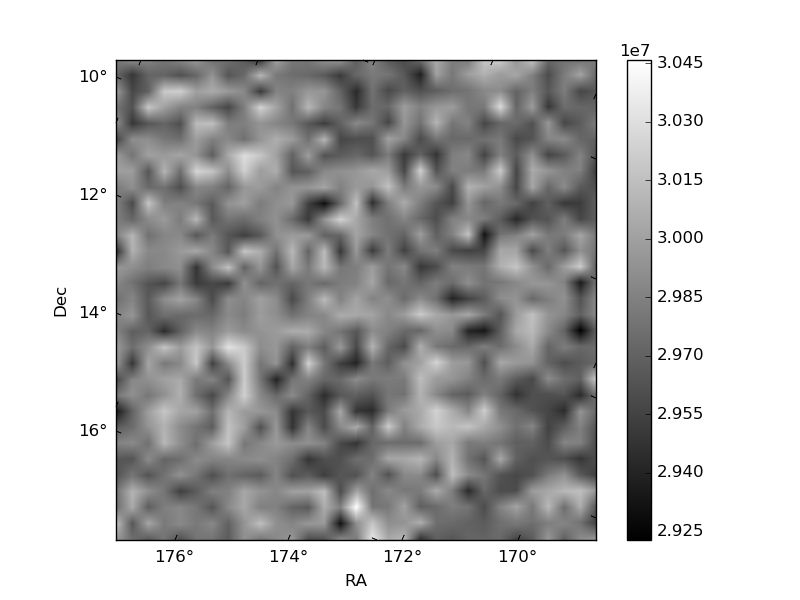
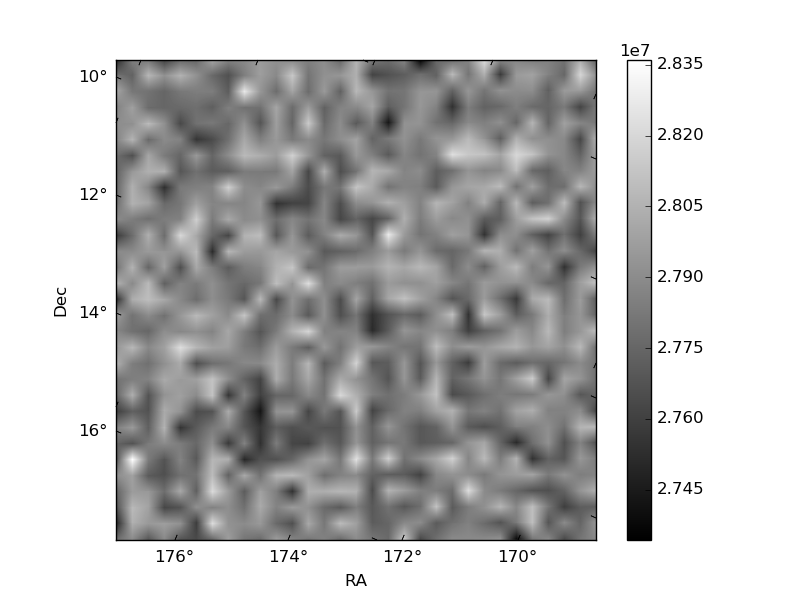
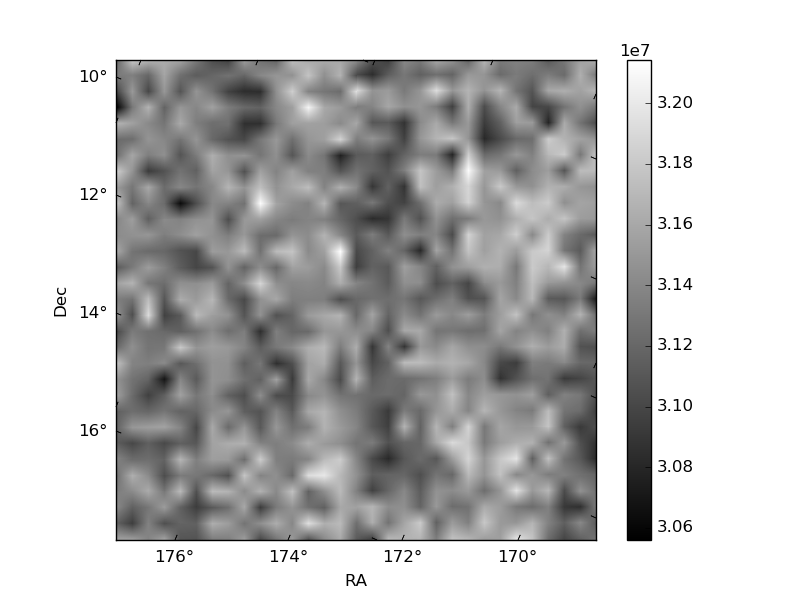
Histogram calculated using DETX and DETY for each event in the final _common_clean file
| Quadrant A | 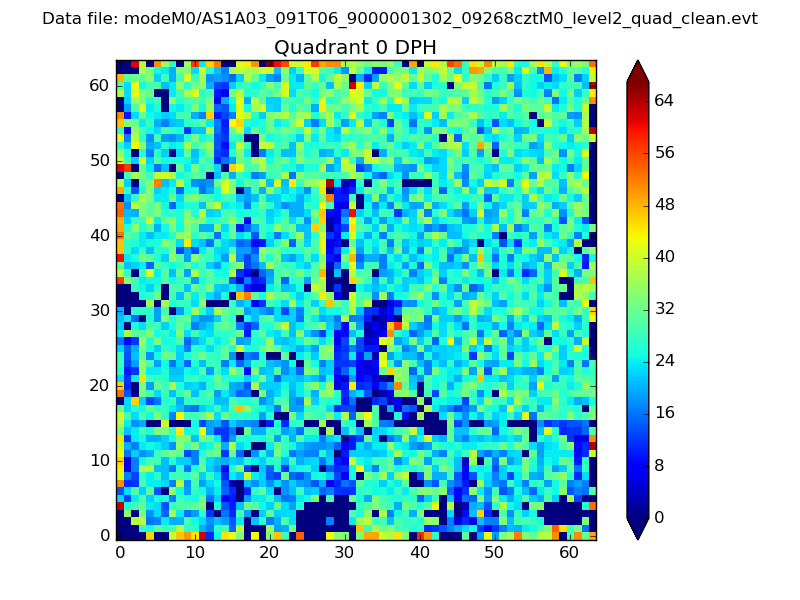 |
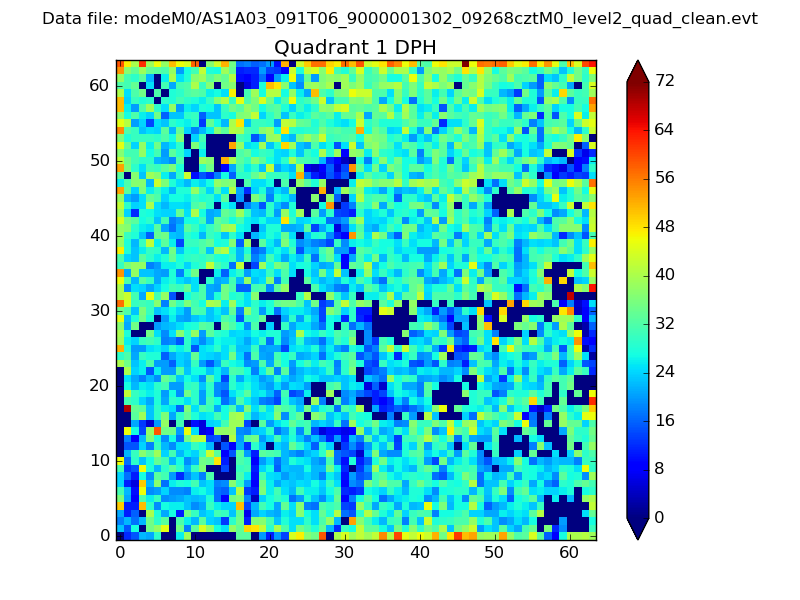 |
Quadrant B |
|---|---|---|---|
| Quadrant D | 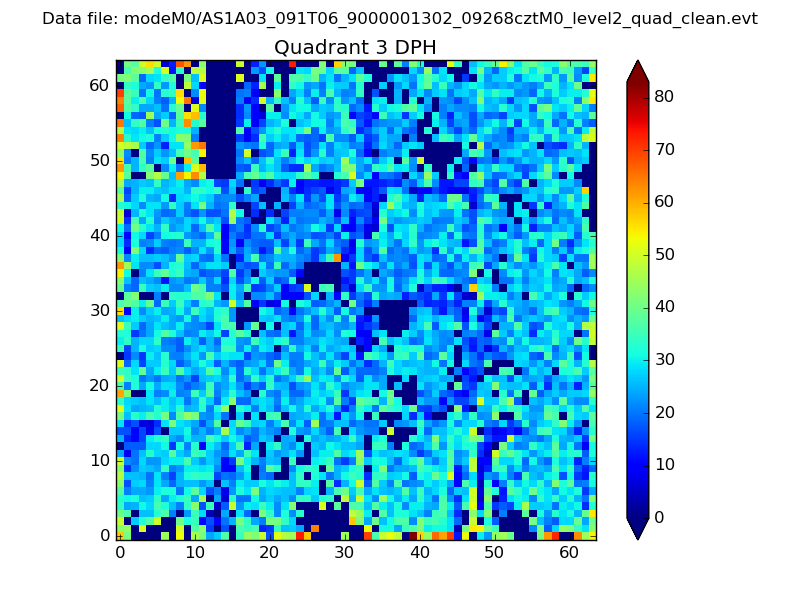 |
 |
Quadrant C |
| Plot type | Count rate plots | Images |
|---|---|---|
| Comparison with Poisson distribution Blue bars denote a histogram of data divided into 1 sec bins. Red curve is a Poisson curve with rate = median count rate of data. |
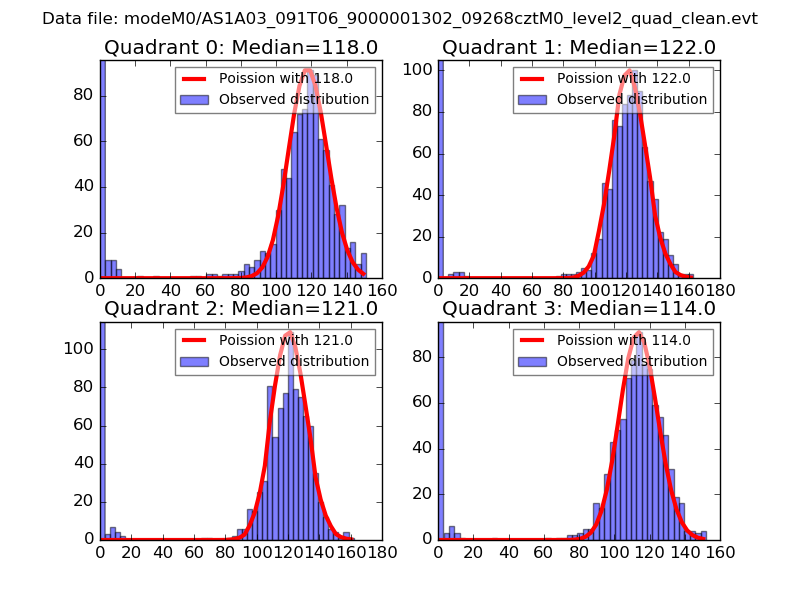 |
 |
| Quadrant-wise count rates Data is divided into 100 sec bins |
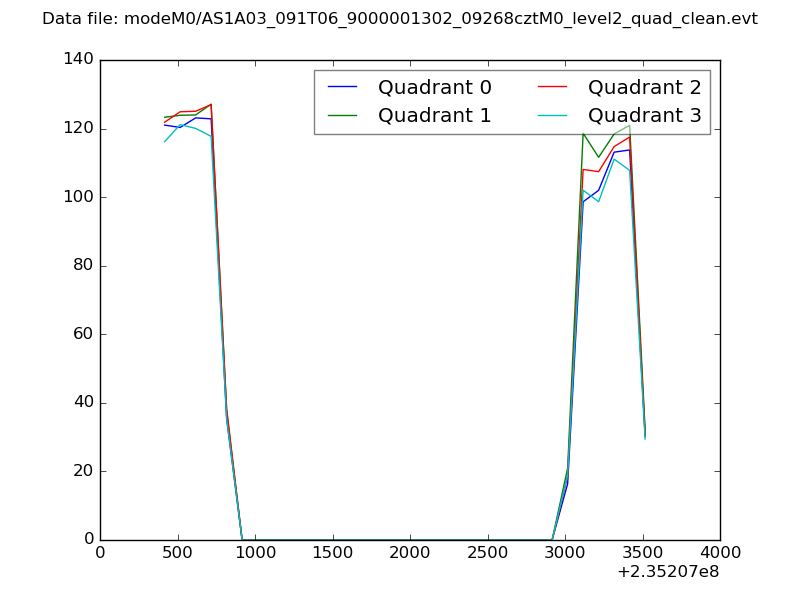 |
|
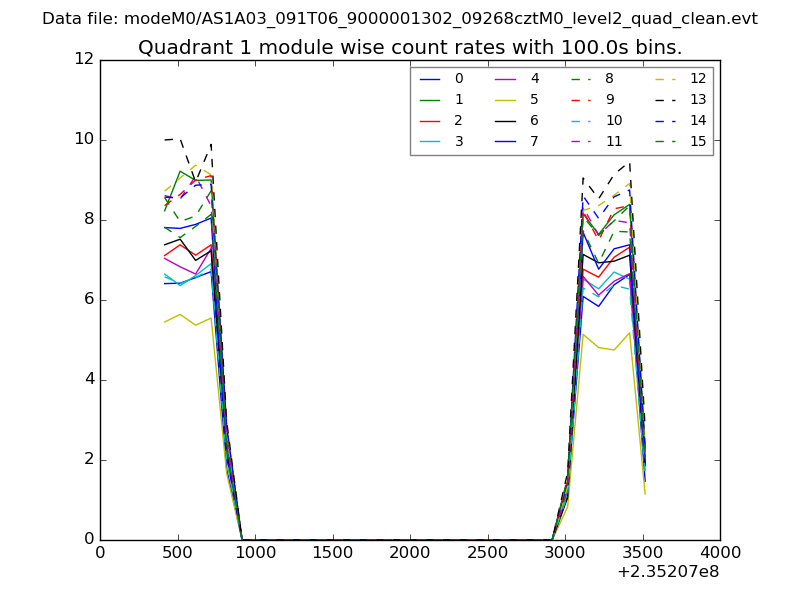
| Module-wise count rates for Quadrant A Data is divided into 100 sec bins |
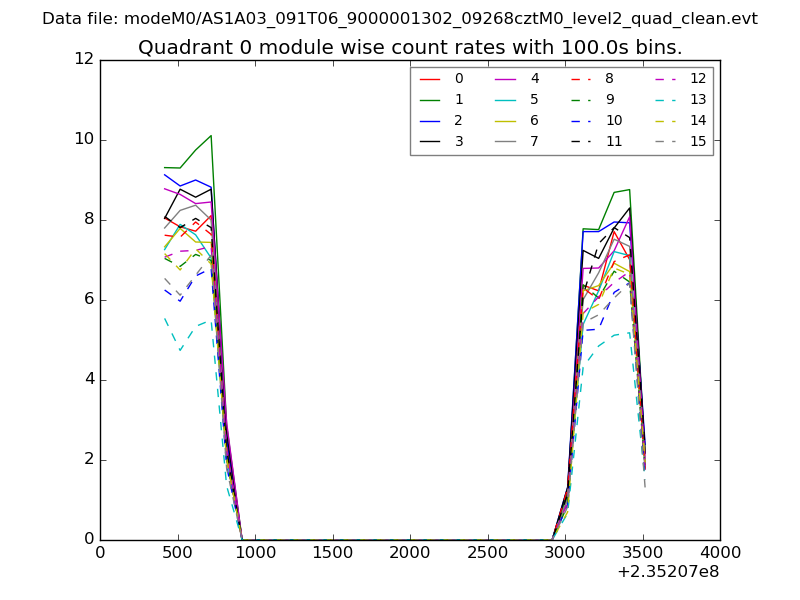 |
 |
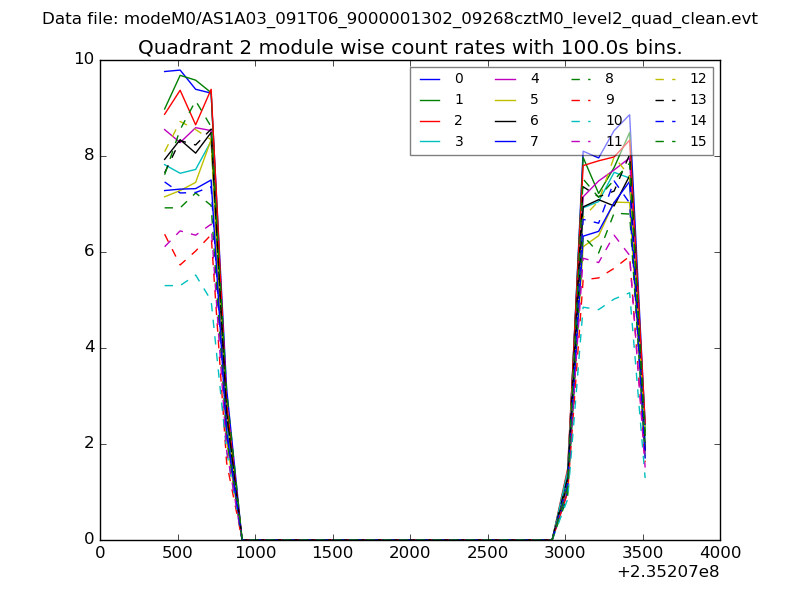
| Module-wise count rates for Quadrant B Data is divided into 100 sec bins |
 |
 |
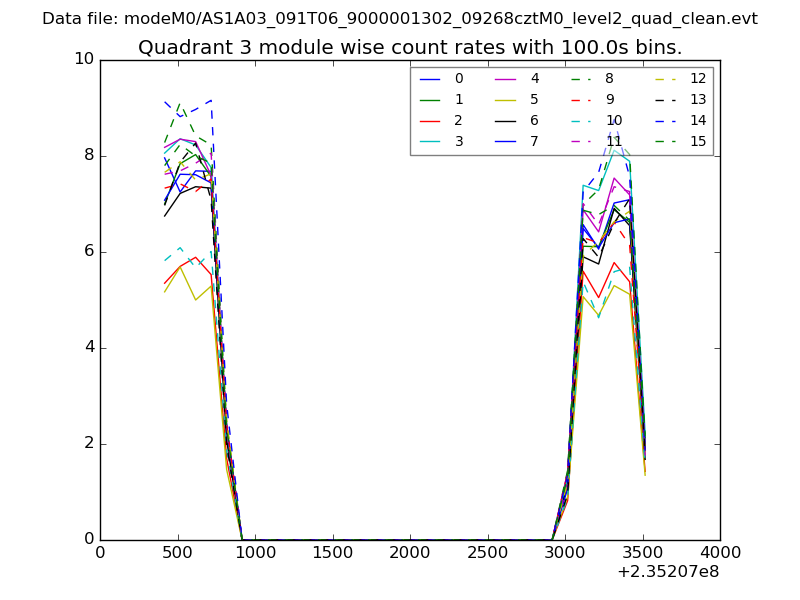
| Module-wise count rates for Quadrant C Data is divided into 100 sec bins |
 |
 |
| Module-wise count rates for Quadrant D Data is divided into 100 sec bins |
 |
 |
| Parameter | Plot |
|---|---|
| CZT HV Monitor | 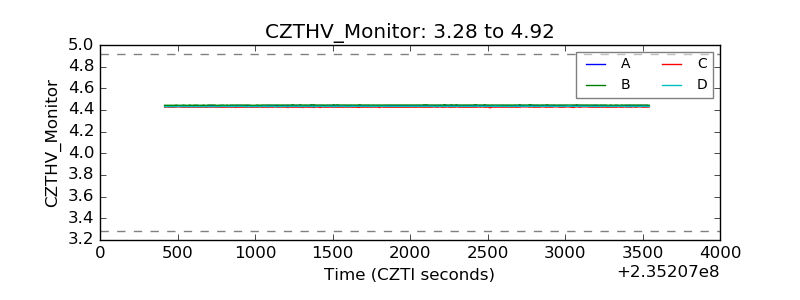 |
| D_VDD | 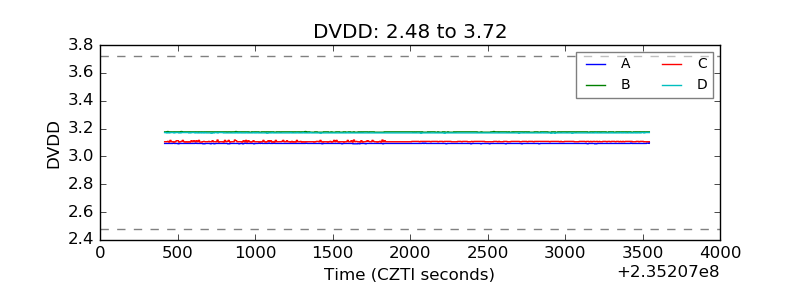 |
| Temperature 1 | 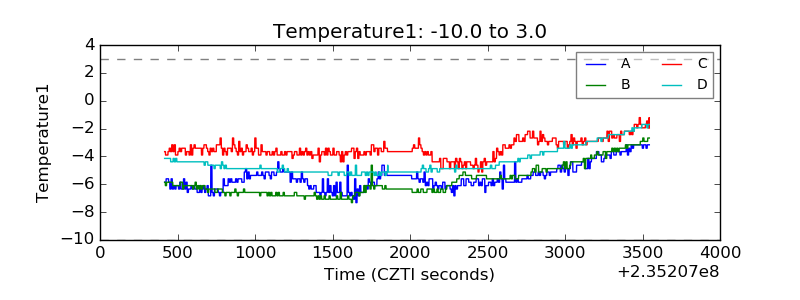 |
| Veto HV Monitor | 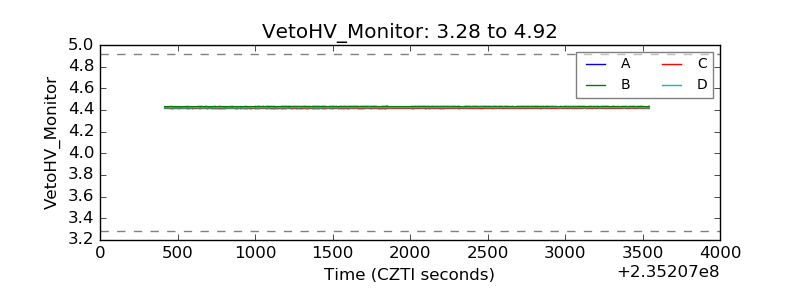 |
| Veto LLD | 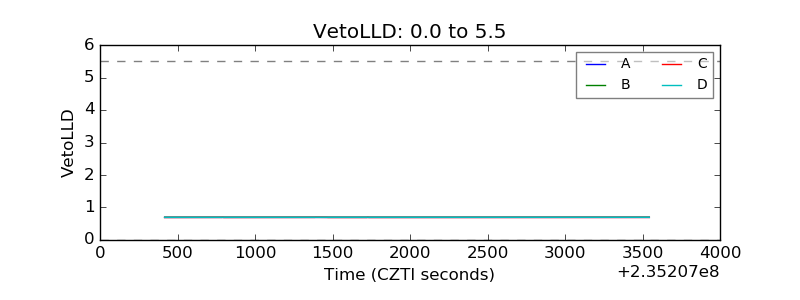 |
| Alpha Counter | 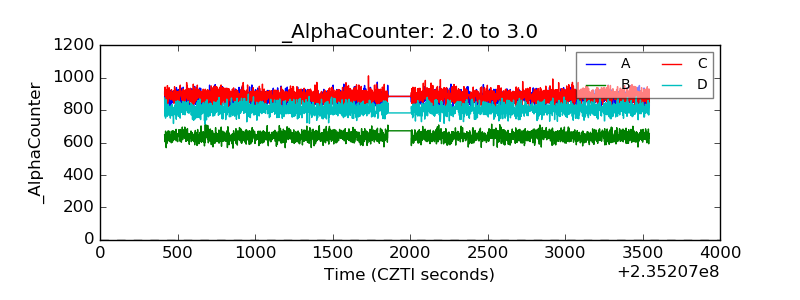 |
| _CPM_Rate | 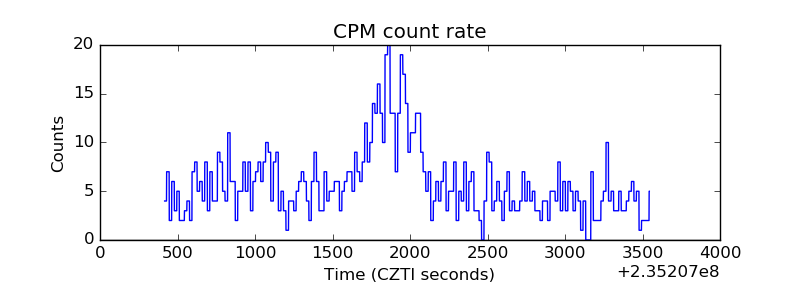 |
| CZT Counter |  |
| +2.5 Volts monitor |  |
| +5 Volts monitor |  |
| _ROLL_ROT | 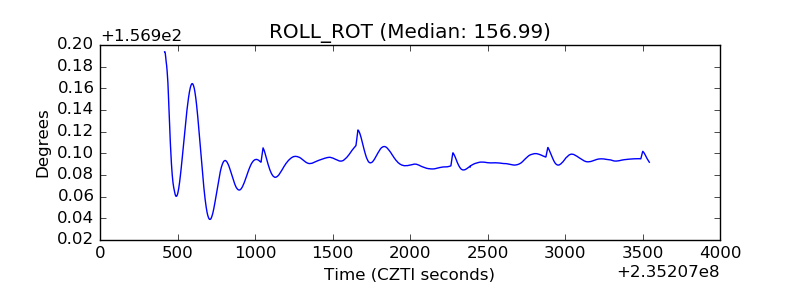 |
| _Roll_DEC | 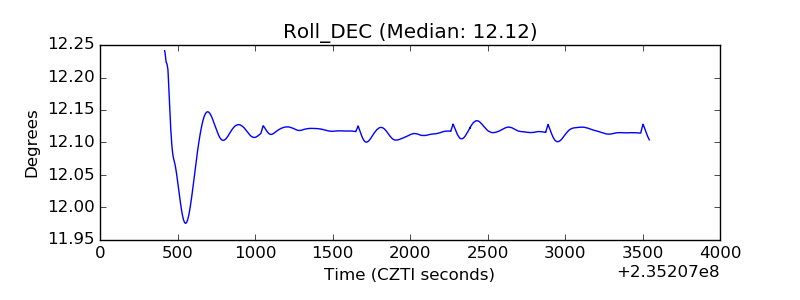 |
| _Roll_RA | 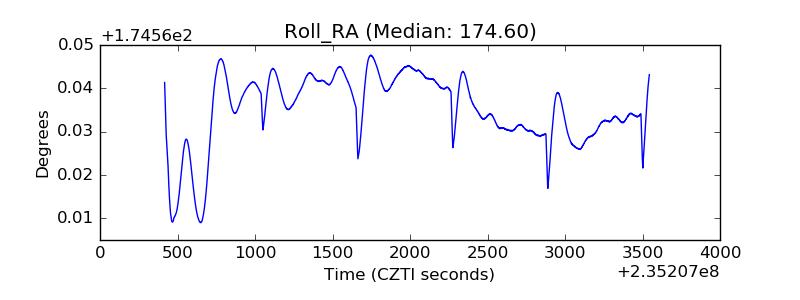 |
| Veto Counter | 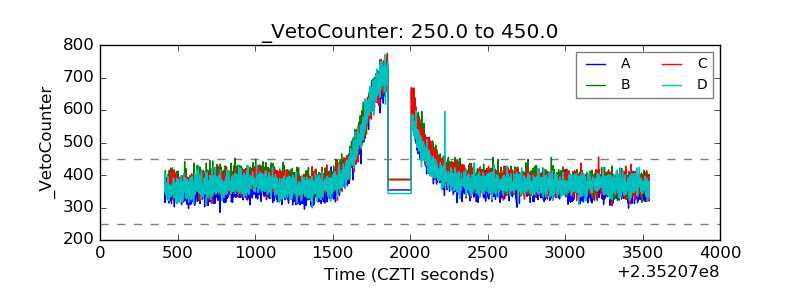 |