| Param | Original file | Final file |
|---|---|---|
| Filename | modeM0/AS1A03_091T06_9000001302_09269cztM0_level2.evt | modeM0/AS1A03_091T06_9000001302_09269cztM0_level2_quad_clean.evt |
| Size (bytes) | 535,728,960 | 86,204,160 |
| Size | 510.9 MB | 82.2 MB |
| Events in quadrant A | 5,095,894 | 526,764 |
| Events in quadrant B | 3,472,031 | 543,945 |
| Events in quadrant C | 3,254,140 | 532,192 |
| Events in quadrant D | 3,916,353 | 508,900 |
| Mode SS | |||
|---|---|---|---|
| Quadrant | BADHDUFLAG | Total packets | Discarded packets |
| A | 0 | 146 | 0 |
| B | 0 | 146 | 0 |
| C | 0 | 146 | 0 |
| D | 0 | 146 | 0 |
| Mode M0 | |||
|---|---|---|---|
| Quadrant | BADHDUFLAG | Total packets | Discarded packets |
| A | 0 | 20089 | 186 |
| B | 0 | 15025 | 107 |
| C | 0 | 14703 | 105 |
| D | 0 | 16557 | 109 |
| Mode M9 | |||
|---|---|---|---|
| Quadrant | BADHDUFLAG | Total packets | Discarded packets |
| A | 0 | 3 | 0 |
| B | 0 | 3 | 0 |
| C | 0 | 3 | 0 |
| D | 0 | 3 | 0 |
| Quadrant | Total seconds | Saturated seconds | Saturation percentage |
|---|---|---|---|
| A | 7149 | 395 | 5.525248% |
| B | 7158 | 155 | 2.165409% |
| C | 7158 | 112 | 1.564683% |
| D | 7162 | 226 | 3.155543% |
Noise dominated data is calculated using 1-second bins in cleaned event files. If a bin has >2000 counts, and if more than 50% of those come from <1% of pixels, then it is considered to be noise-dominated and hence unusable.
| Quadrant | # 1 sec bins | Bins with >0 counts | Bins with >2000 counts | High rate bins dominated by noise | Noise dominated (total time) | Noise dominated (detector-on time) | Marked lightcurve |
|---|---|---|---|---|---|---|---|
| A | 7505 | 7209 | 154 | 154 | 2.05% | 2.14% | 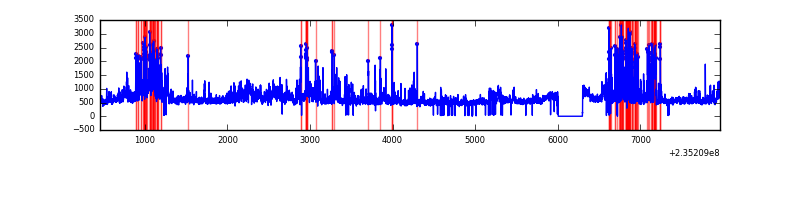 |
| B | 7505 | 7210 | 9 | 9 | 0.12% | 0.12% | 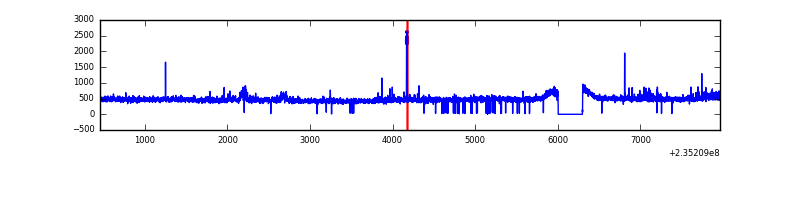 |
| C | 7505 | 7209 | 0 | 0 | 0.00% | 0.00% | 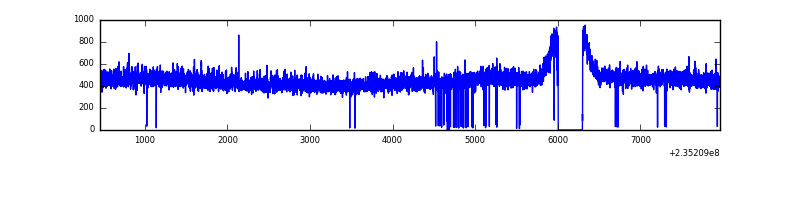 |
| D | 7505 | 7209 | 95 | 95 | 1.27% | 1.32% | 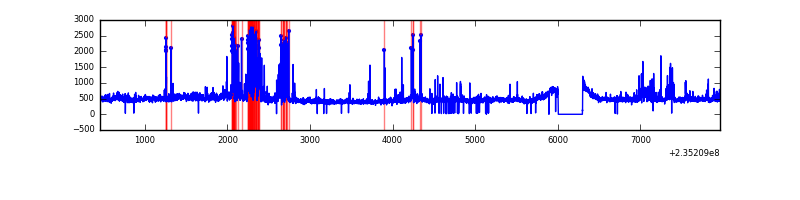 |
Top three noisy pixels from each quadrant. If the there are fewer than three noisy pixels in the level2.evt file, extra rows are filled as -1
| Pixel properties | Quadrant properties | ||||||
|---|---|---|---|---|---|---|---|
| Quadrant | DetID | PixID | Counts | Sigma | Mean | Median | Sigma |
| A | 8 | 5 | 1082556 | 6212.89 | 842 | 823 | 174.1 |
| A | 5 | 16 | 642537 | 3685.66 | 842 | 823 | 174.1 |
| A | 4 | 2 | 49273 | 278.27 | 842 | 823 | 174.1 |
| B | 0 | 214 | 80866 | 480.98 | 854 | 832 | 166.4 |
| B | 8 | 234 | 24637 | 143.06 | 854 | 832 | 166.4 |
| B | 12 | 111 | 17994 | 103.14 | 854 | 832 | 166.4 |
| C | 9 | 68 | 20480 | 101.09 | 828 | 834 | 194.3 |
| C | 13 | 61 | 6341 | 28.34 | 828 | 834 | 194.3 |
| C | 8 | 222 | 3035 | 11.33 | 828 | 834 | 194.3 |
| D | 12 | 233 | 354257 | 1582.49 | 819 | 801 | 223.4 |
| D | 1 | 52 | 203219 | 906.26 | 819 | 801 | 223.4 |
| D | 2 | 136 | 99093 | 440.07 | 819 | 801 | 223.4 |
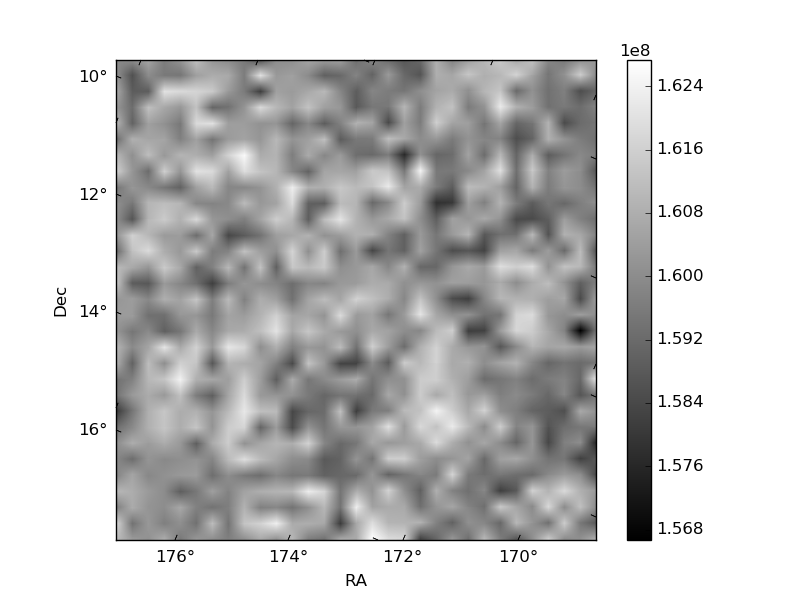
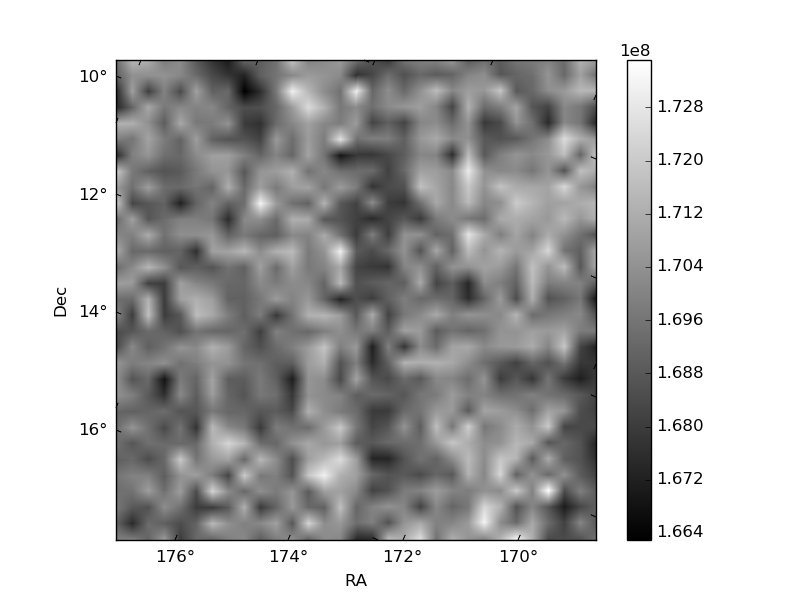
Histogram calculated using DETX and DETY for each event in the final _common_clean file
| Quadrant A | 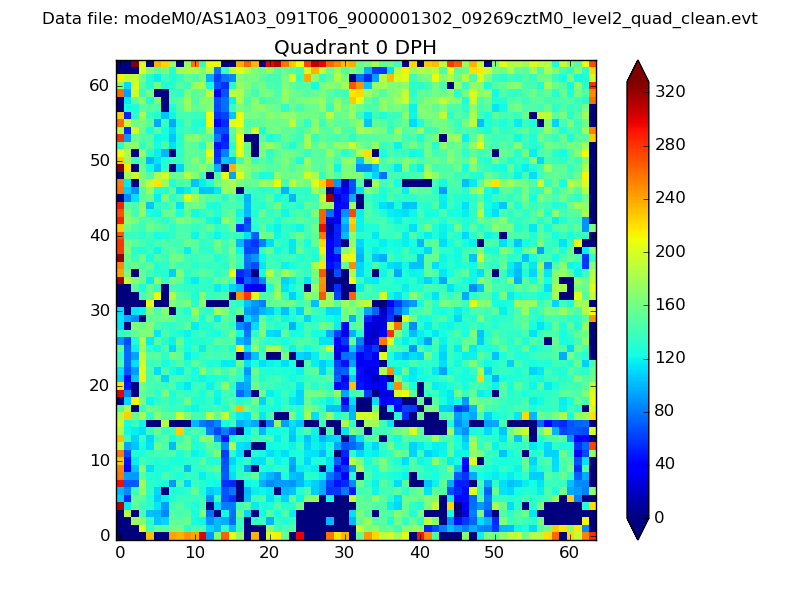 |
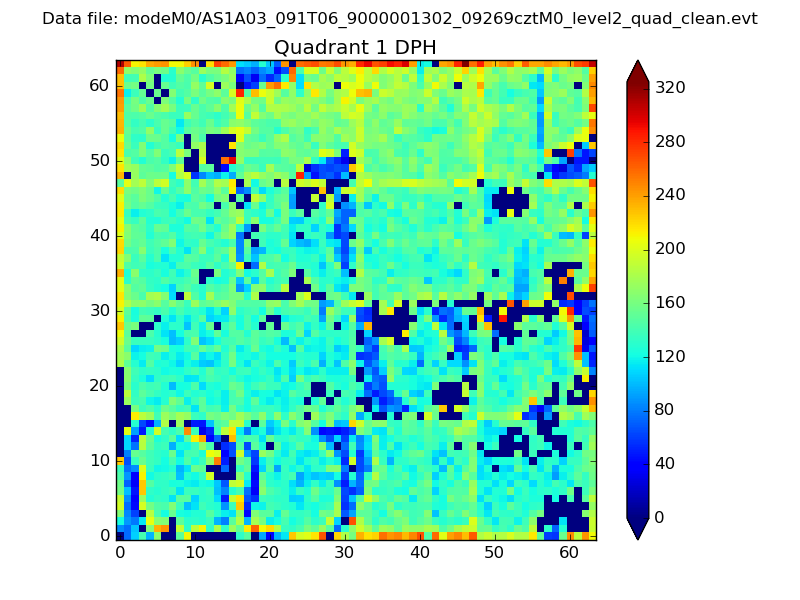 |
Quadrant B |
|---|---|---|---|
| Quadrant D | 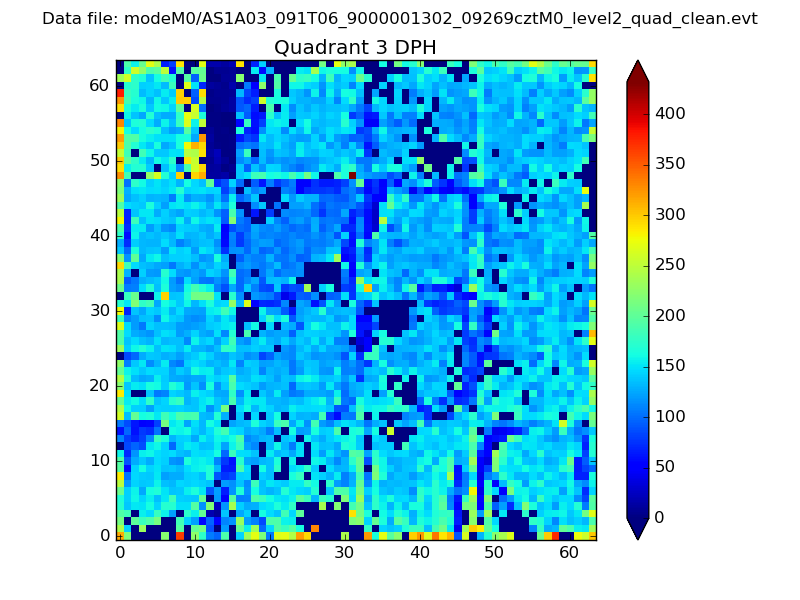 |
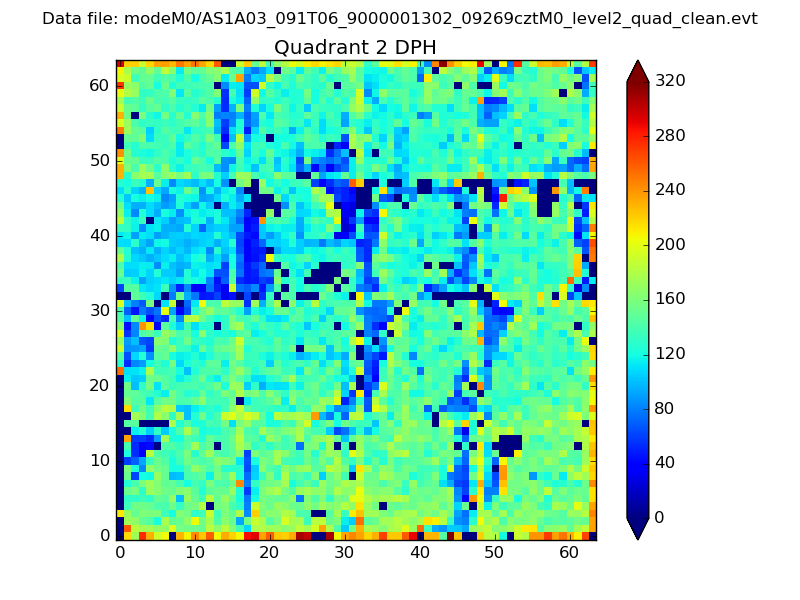 |
Quadrant C |
| Plot type | Count rate plots | Images |
|---|---|---|
| Comparison with Poisson distribution Blue bars denote a histogram of data divided into 1 sec bins. Red curve is a Poisson curve with rate = median count rate of data. |
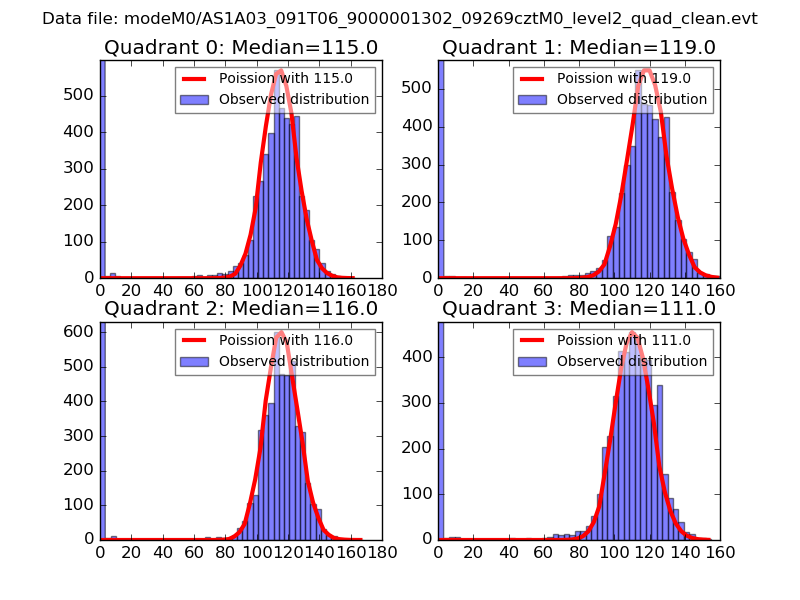 |
 |
| Quadrant-wise count rates Data is divided into 100 sec bins |
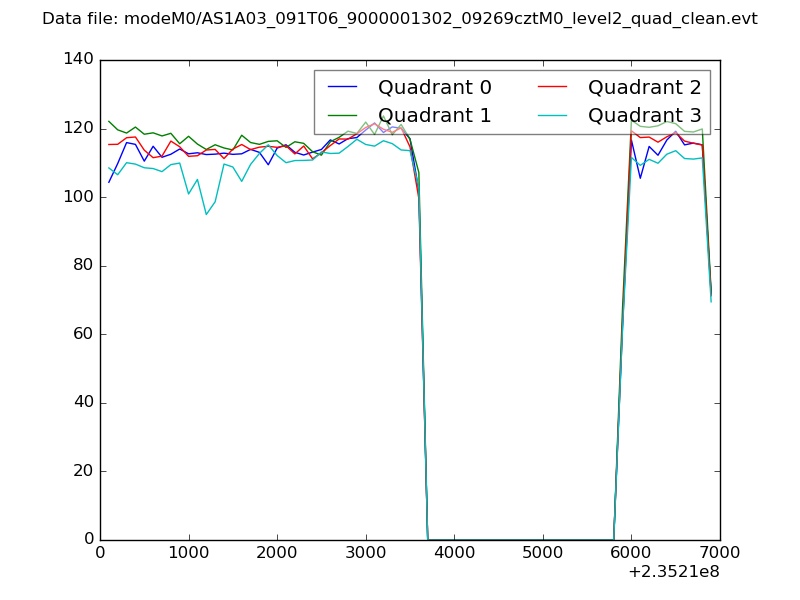 |
|
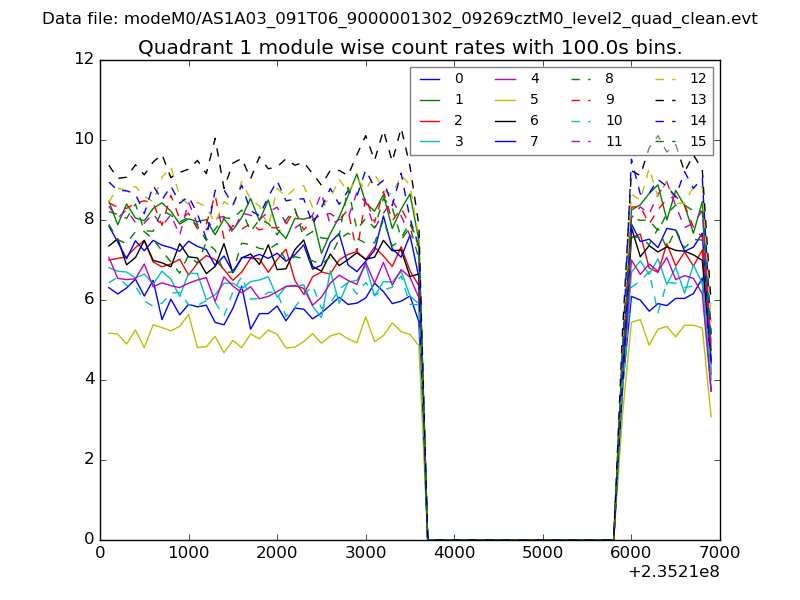
| Module-wise count rates for Quadrant A Data is divided into 100 sec bins |
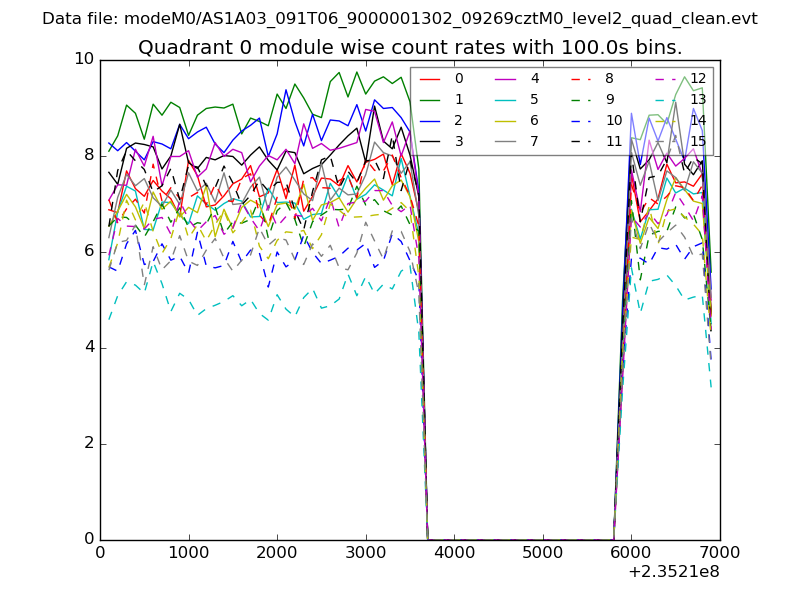 |
 |
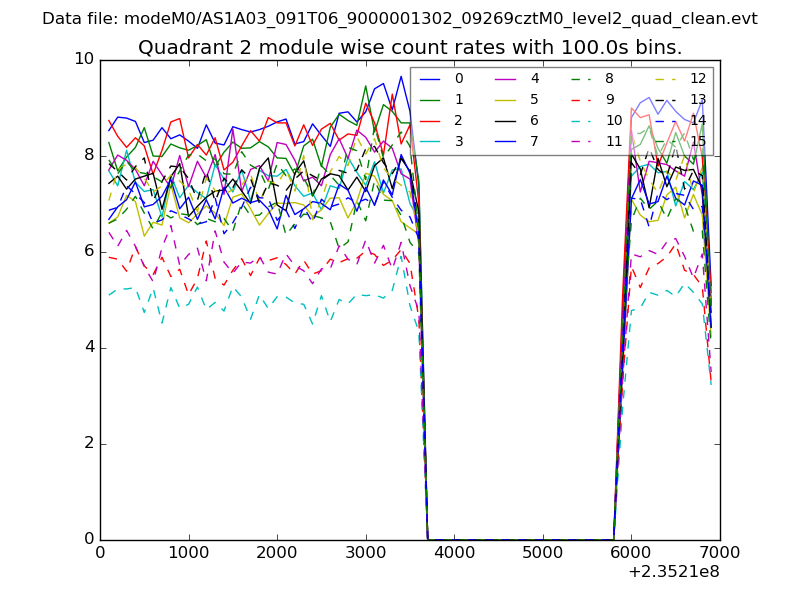
| Module-wise count rates for Quadrant B Data is divided into 100 sec bins |
 |
 |
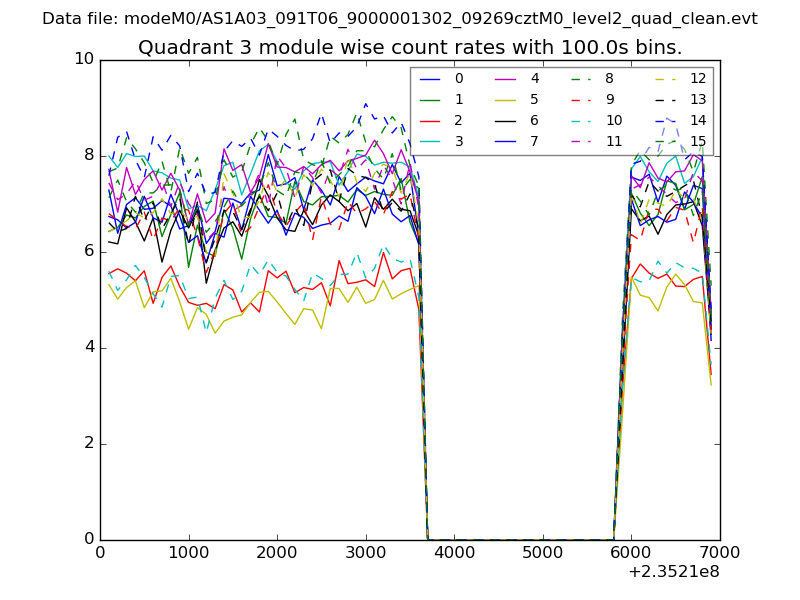
| Module-wise count rates for Quadrant C Data is divided into 100 sec bins |
 |
 |
| Module-wise count rates for Quadrant D Data is divided into 100 sec bins |
 |
 |
| Parameter | Plot |
|---|---|
| CZT HV Monitor | 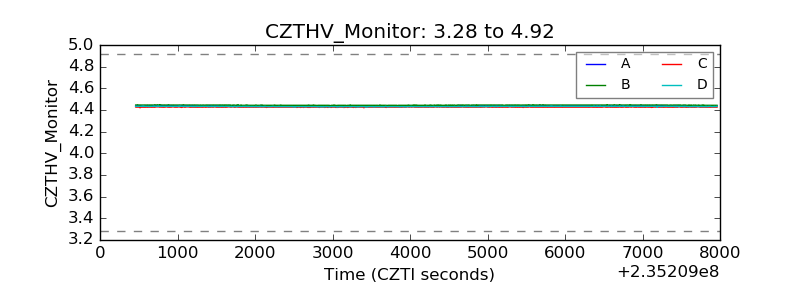 |
| D_VDD | 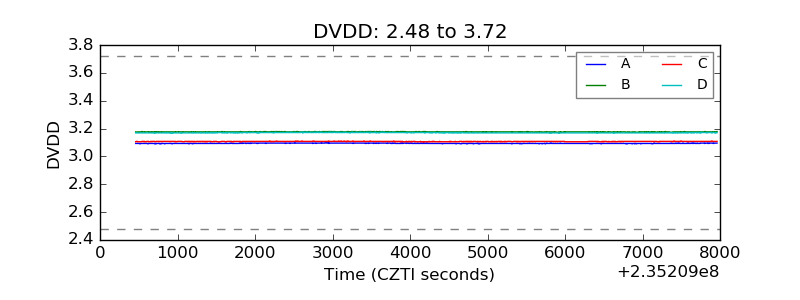 |
| Temperature 1 | 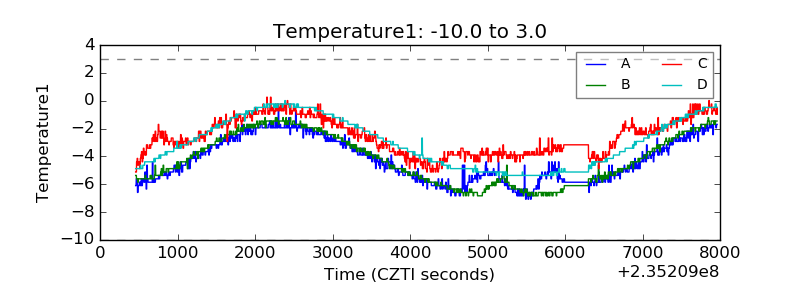 |
| Veto HV Monitor |  |
| Veto LLD | 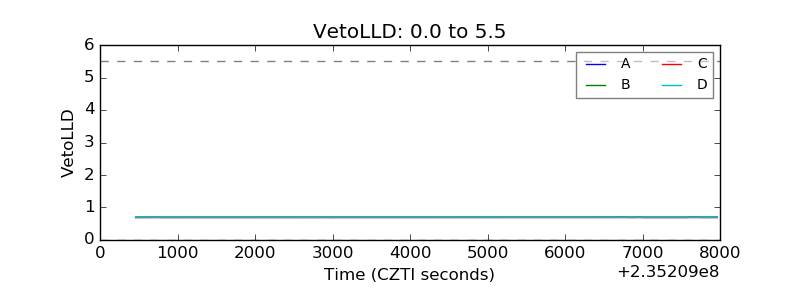 |
| Alpha Counter | 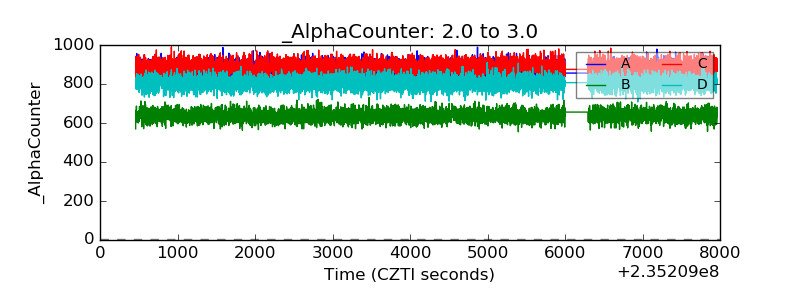 |
| _CPM_Rate | 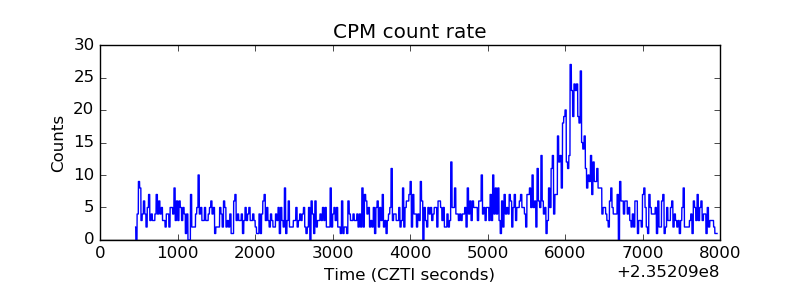 |
| CZT Counter | 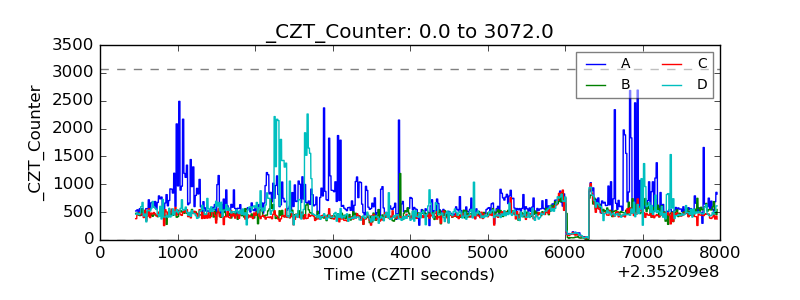 |
| +2.5 Volts monitor |  |
| +5 Volts monitor |  |
| _ROLL_ROT | 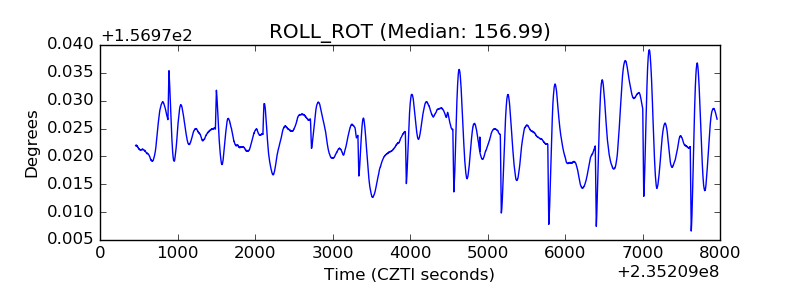 |
| _Roll_DEC | 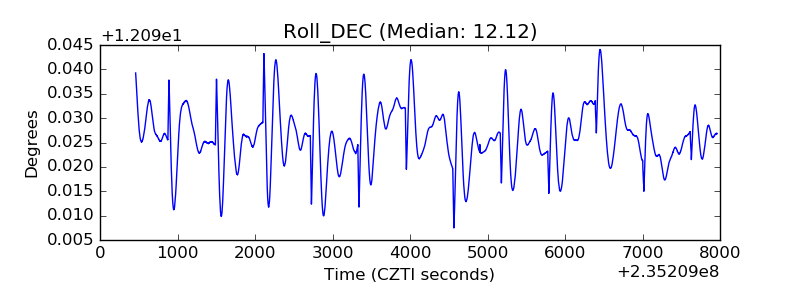 |
| _Roll_RA |  |
| Veto Counter | 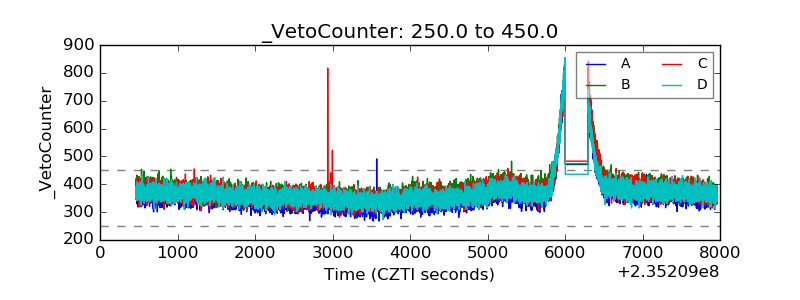 |