| Param | Original file | Final file |
|---|---|---|
| Filename | modeM0/AS1A03_091T06_9000001302_09271cztM0_level2.evt | modeM0/AS1A03_091T06_9000001302_09271cztM0_level2_quad_clean.evt |
| Size (bytes) | 523,543,680 | 87,004,800 |
| Size | 499.3 MB | 83.0 MB |
| Events in quadrant A | 4,603,407 | 527,610 |
| Events in quadrant B | 3,524,839 | 554,411 |
| Events in quadrant C | 3,171,666 | 555,647 |
| Events in quadrant D | 4,081,746 | 511,488 |
| Mode SS | |||
|---|---|---|---|
| Quadrant | BADHDUFLAG | Total packets | Discarded packets |
| A | 0 | 176 | 38 |
| B | 0 | 175 | 25 |
| C | 0 | 174 | 34 |
| D | 0 | 176 | 26 |
| Mode M0 | |||
|---|---|---|---|
| Quadrant | BADHDUFLAG | Total packets | Discarded packets |
| A | 0 | 24183 | 5859 |
| B | 0 | 18698 | 3722 |
| C | 0 | 17660 | 3230 |
| D | 0 | 20888 | 3921 |
| Mode M9 | |||
|---|---|---|---|
| Quadrant | BADHDUFLAG | Total packets | Discarded packets |
| A | 0 | 5 | 0 |
| B | 0 | 5 | 1 |
| C | 0 | 5 | 0 |
| D | 0 | 6 | 0 |
| Quadrant | Total seconds | Saturated seconds | Saturation percentage |
|---|---|---|---|
| A | 6777 | 240 | 3.541390% |
| B | 6994 | 140 | 2.001716% |
| C | 7061 | 92 | 1.302932% |
| D | 6938 | 357 | 5.145575% |
Noise dominated data is calculated using 1-second bins in cleaned event files. If a bin has >2000 counts, and if more than 50% of those come from <1% of pixels, then it is considered to be noise-dominated and hence unusable.
| Quadrant | # 1 sec bins | Bins with >0 counts | Bins with >2000 counts | High rate bins dominated by noise | Noise dominated (total time) | Noise dominated (detector-on time) | Marked lightcurve |
|---|---|---|---|---|---|---|---|
| A | 9231 | 7520 | 55 | 55 | 0.60% | 0.73% | 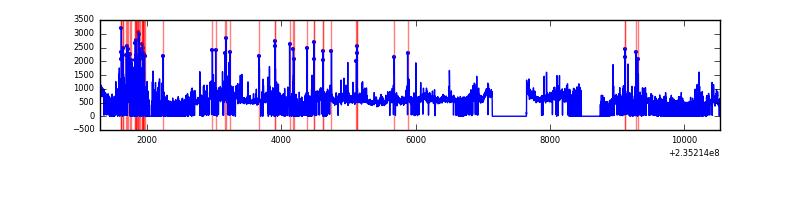 |
| B | 9231 | 7707 | 4 | 4 | 0.04% | 0.05% | 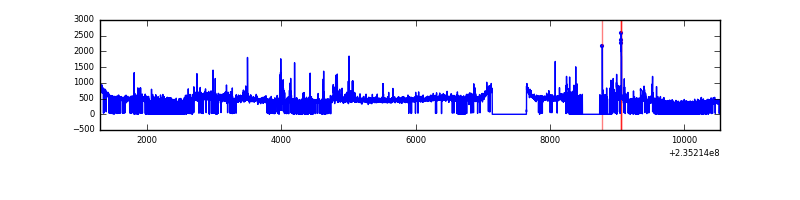 |
| C | 9231 | 7751 | 0 | 0 | 0.00% | 0.00% | 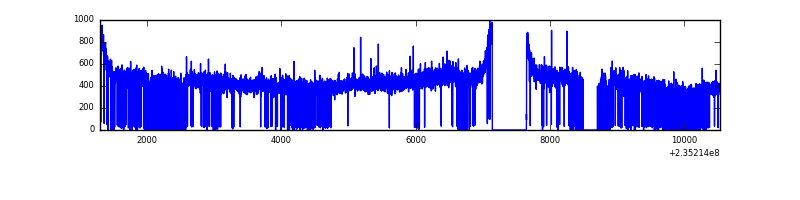 |
| D | 9231 | 7667 | 213 | 213 | 2.31% | 2.78% | 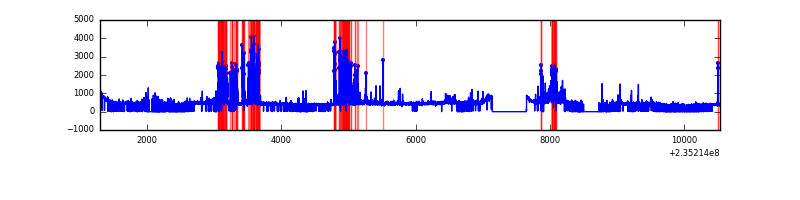 |
Top three noisy pixels from each quadrant. If the there are fewer than three noisy pixels in the level2.evt file, extra rows are filled as -1
| Pixel properties | Quadrant properties | ||||||
|---|---|---|---|---|---|---|---|
| Quadrant | DetID | PixID | Counts | Sigma | Mean | Median | Sigma |
| A | 8 | 5 | 1084420 | 6660.52 | 794 | 776 | 162.7 |
| A | 5 | 16 | 328768 | 2015.97 | 794 | 776 | 162.7 |
| A | 4 | 2 | 33322 | 200.04 | 794 | 776 | 162.7 |
| B | 0 | 214 | 116869 | 718.6 | 828 | 806 | 161.5 |
| B | 8 | 234 | 70039 | 428.66 | 828 | 806 | 161.5 |
| B | 0 | 245 | 26450 | 158.77 | 828 | 806 | 161.5 |
| C | 13 | 61 | 6120 | 27.75 | 811 | 814 | 191.2 |
| C | 8 | 222 | 5881 | 26.5 | 811 | 814 | 191.2 |
| C | 3 | 202 | 2018 | 6.3 | 811 | 814 | 191.2 |
| D | 10 | 199 | 455431 | 2158.86 | 780 | 763 | 210.6 |
| D | 12 | 233 | 293881 | 1391.78 | 780 | 763 | 210.6 |
| D | 2 | 136 | 117581 | 554.67 | 780 | 763 | 210.6 |
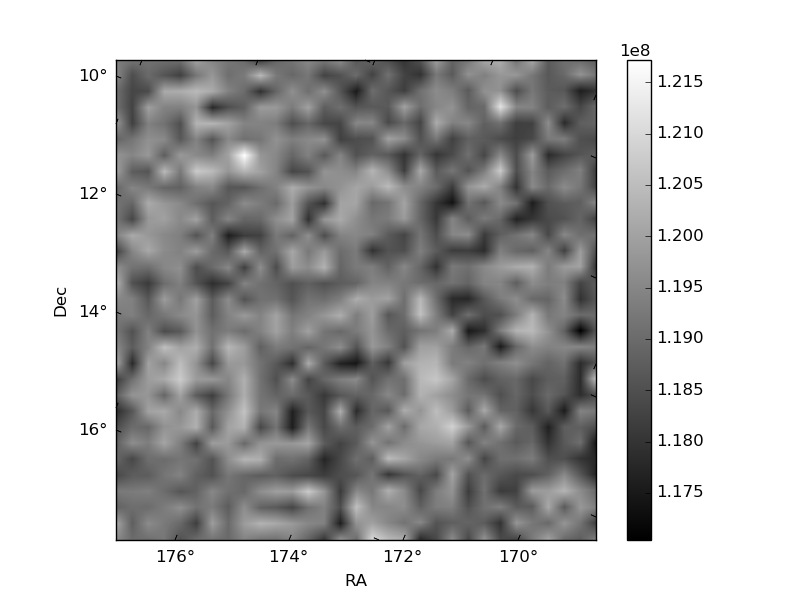
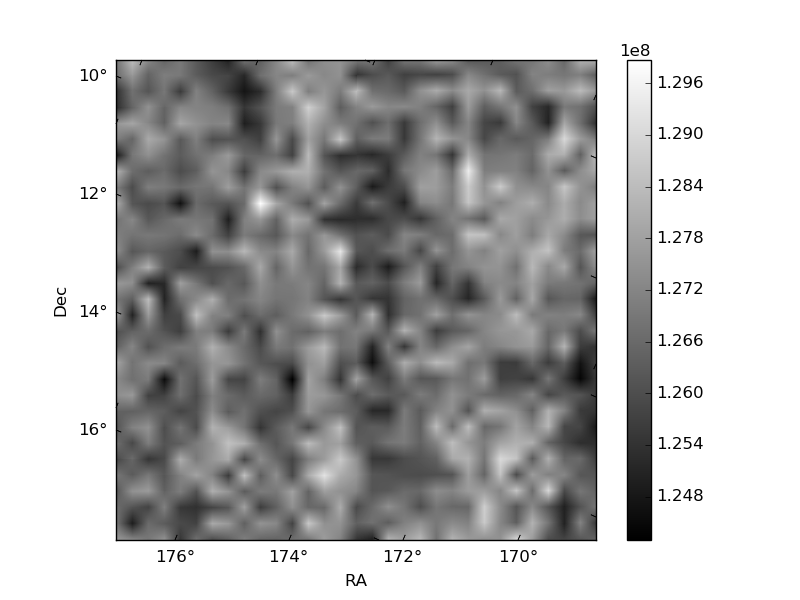
Histogram calculated using DETX and DETY for each event in the final _common_clean file
| Quadrant A | 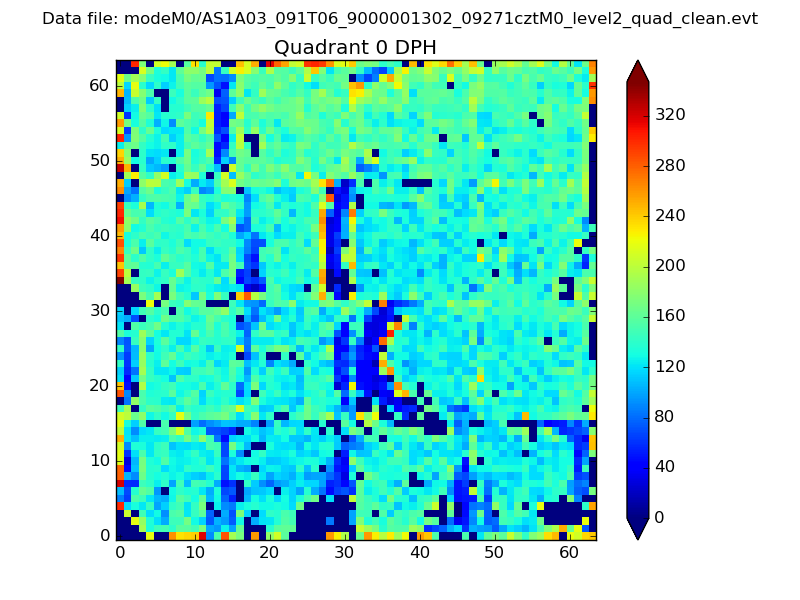 |
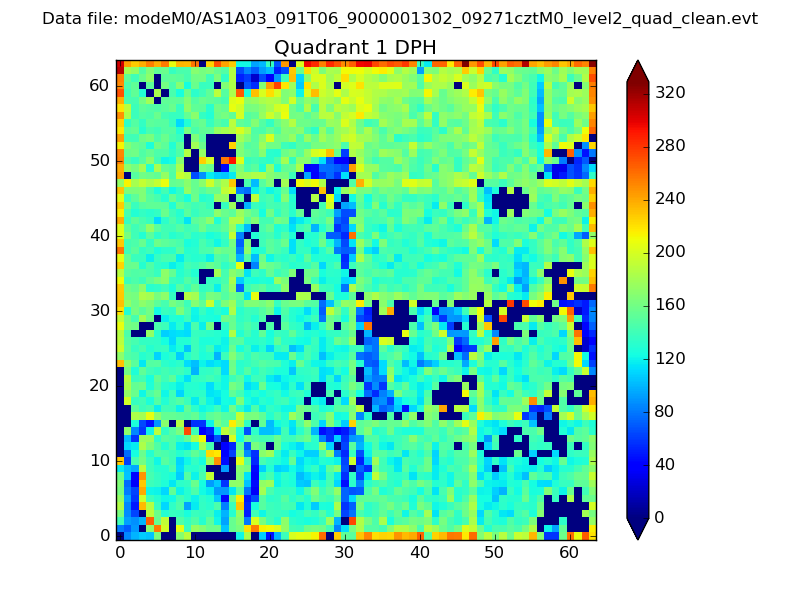 |
Quadrant B |
|---|---|---|---|
| Quadrant D | 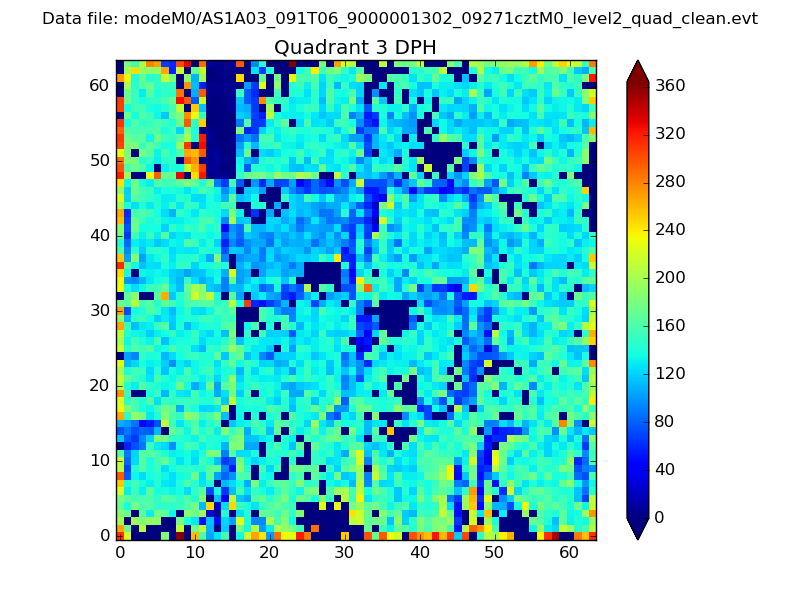 |
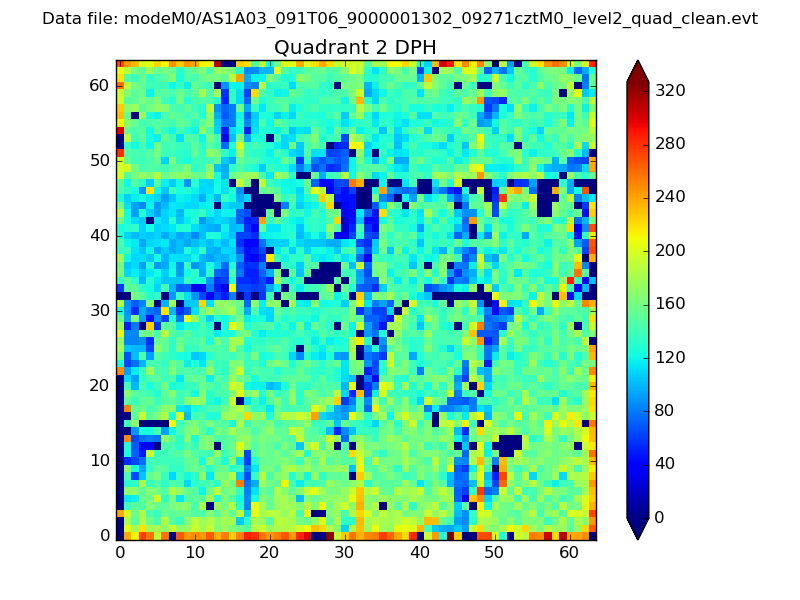 |
Quadrant C |
| Plot type | Count rate plots | Images |
|---|---|---|
| Comparison with Poisson distribution Blue bars denote a histogram of data divided into 1 sec bins. Red curve is a Poisson curve with rate = median count rate of data. |
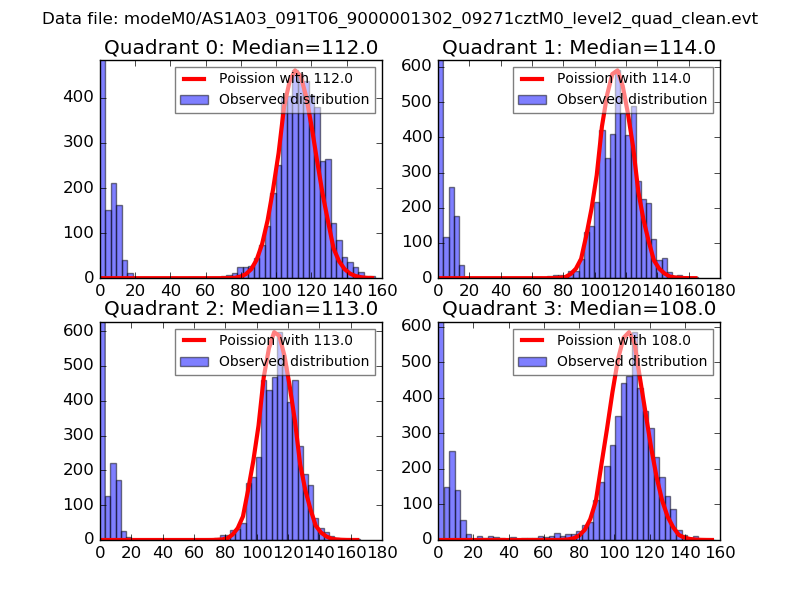 |
 |
| Quadrant-wise count rates Data is divided into 100 sec bins |
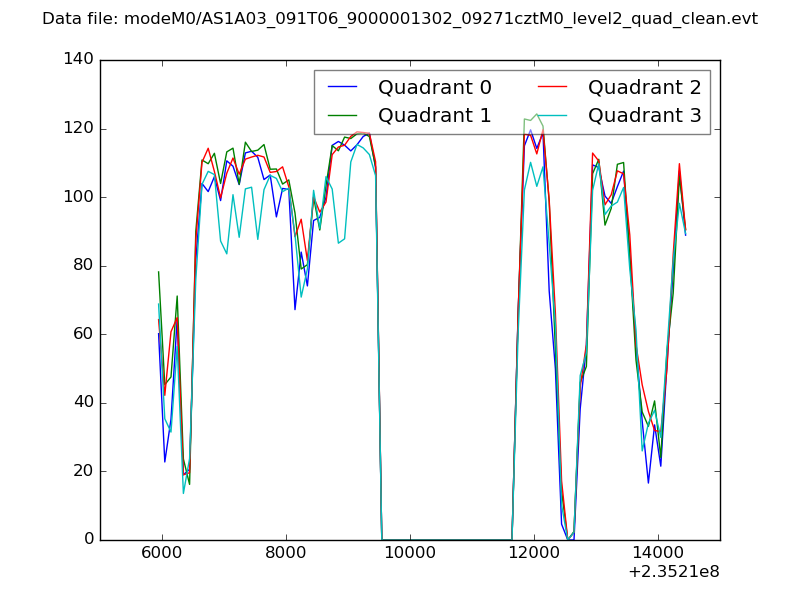 |
|
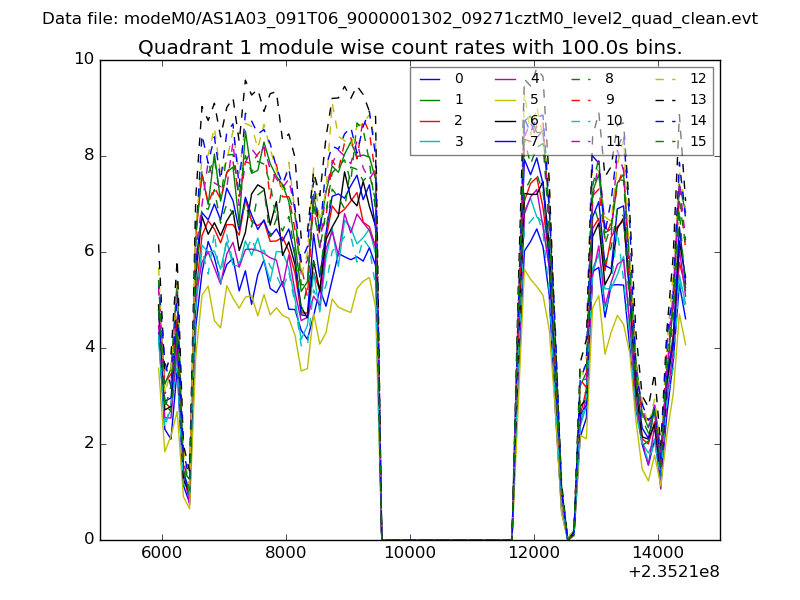
| Module-wise count rates for Quadrant A Data is divided into 100 sec bins |
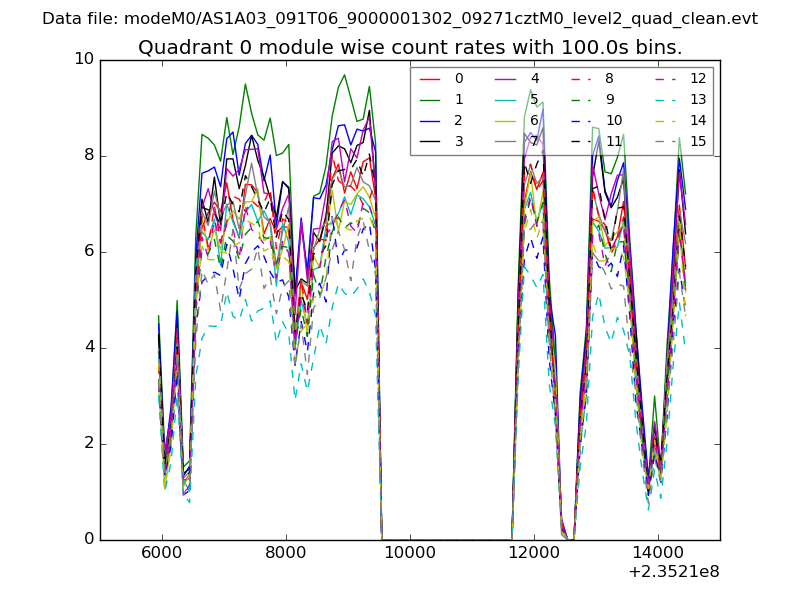 |
 |
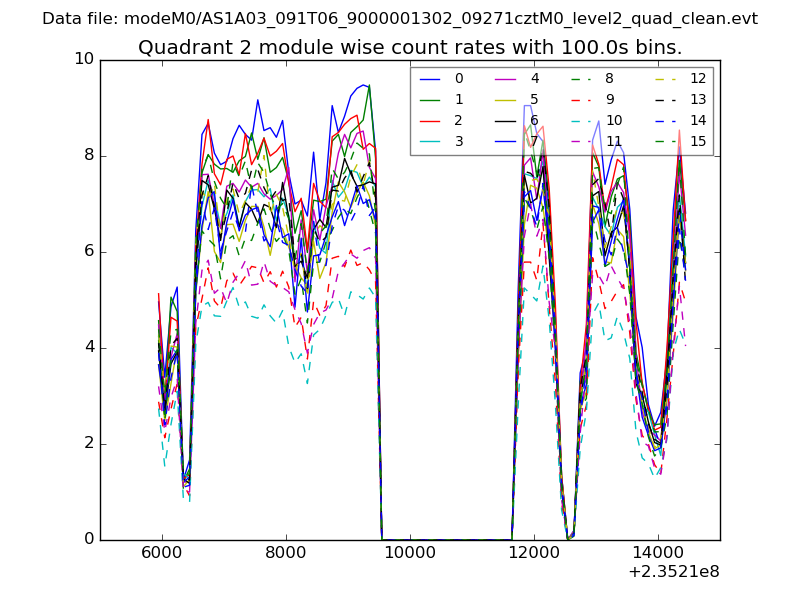
| Module-wise count rates for Quadrant B Data is divided into 100 sec bins |
 |
 |
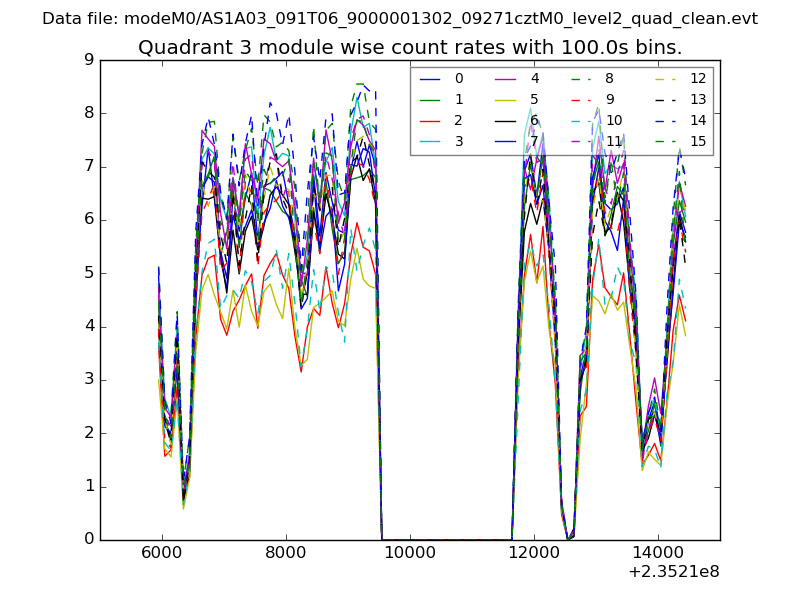
| Module-wise count rates for Quadrant C Data is divided into 100 sec bins |
 |
 |
| Module-wise count rates for Quadrant D Data is divided into 100 sec bins |
 |
 |
| Parameter | Plot |
|---|---|
| CZT HV Monitor | 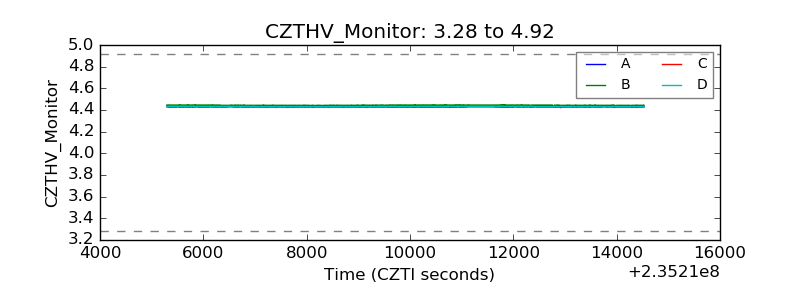 |
| D_VDD | 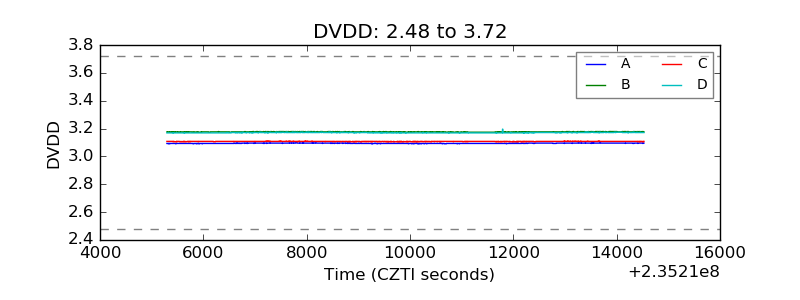 |
| Temperature 1 | 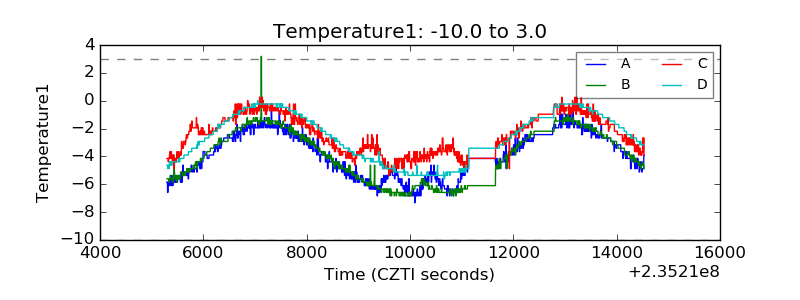 |
| Veto HV Monitor | 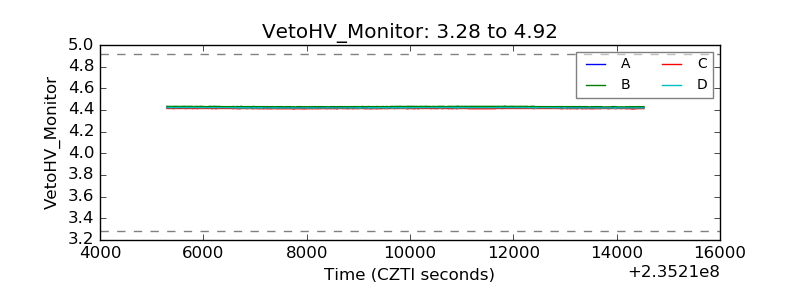 |
| Veto LLD | 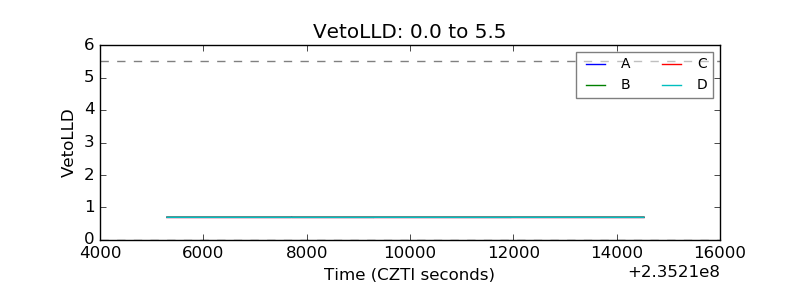 |
| Alpha Counter | 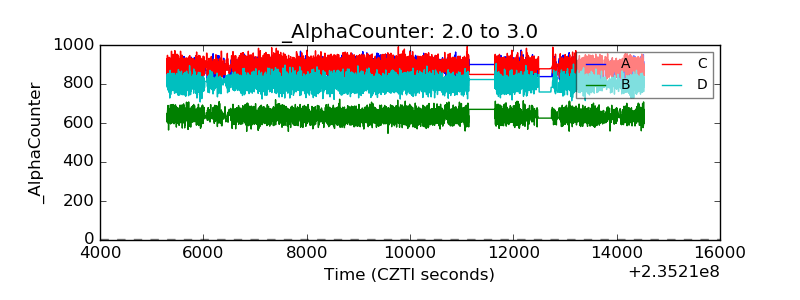 |
| _CPM_Rate | 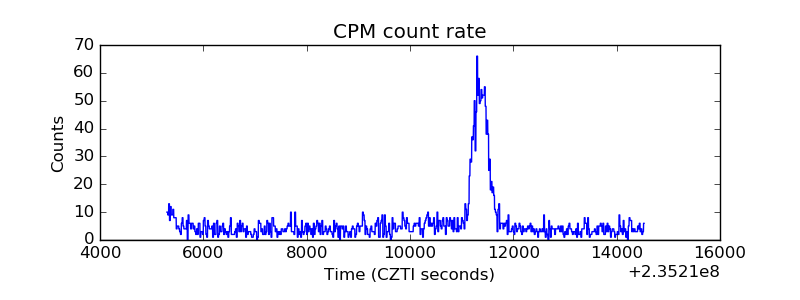 |
| CZT Counter | 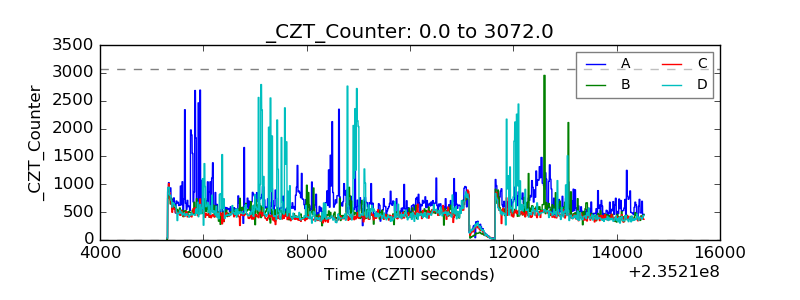 |
| +2.5 Volts monitor |  |
| +5 Volts monitor |  |
| _ROLL_ROT | 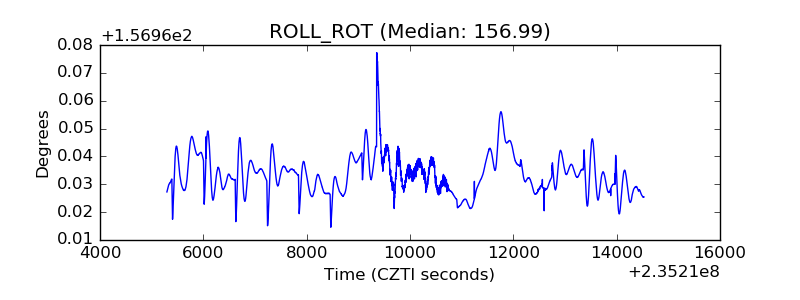 |
| _Roll_DEC | 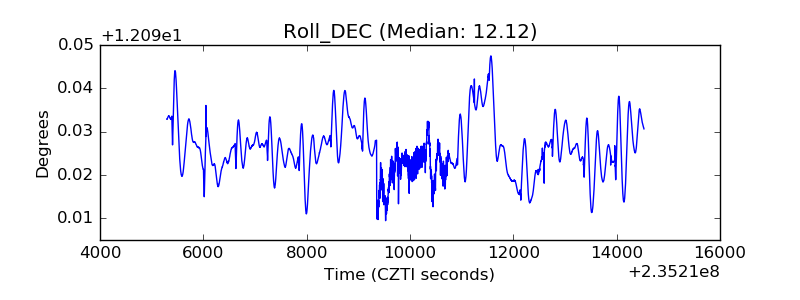 |
| _Roll_RA |  |
| Veto Counter | 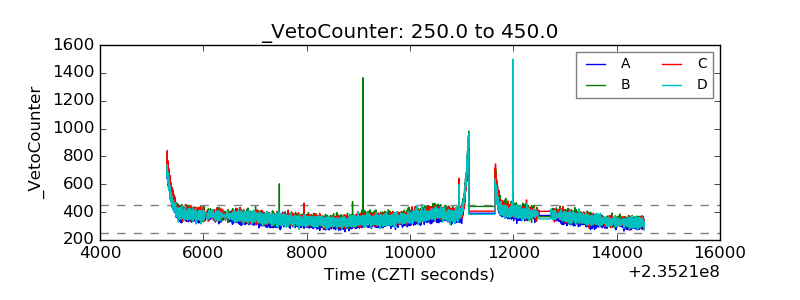 |