| Param | Original file | Final file |
|---|---|---|
| Filename | modeM0/AS1G07_027T01_9000001304_09271cztM0_level2.evt | modeM0/AS1G07_027T01_9000001304_09271cztM0_level2_quad_clean.evt |
| Size (bytes) | 115,197,120 | 21,110,400 |
| Size | 109.9 MB | 20.1 MB |
| Events in quadrant A | 1,018,563 | 123,196 |
| Events in quadrant B | 798,697 | 136,492 |
| Events in quadrant C | 755,041 | 134,581 |
| Events in quadrant D | 810,494 | 132,331 |
| Mode M9 | |||
|---|---|---|---|
| Quadrant | BADHDUFLAG | Total packets | Discarded packets |
| A | 0 | 7 | 1 |
| B | 0 | 7 | 1 |
| C | 0 | 7 | 0 |
| D | 0 | 7 | 0 |
| Mode M0 | |||
|---|---|---|---|
| Quadrant | BADHDUFLAG | Total packets | Discarded packets |
| A | 0 | 10899 | 6949 |
| B | 0 | 6694 | 3413 |
| C | 0 | 6524 | 3272 |
| D | 0 | 6960 | 3546 |
| Mode SS | |||
|---|---|---|---|
| Quadrant | BADHDUFLAG | Total packets | Discarded packets |
| A | 0 | 66 | 20 |
| B | 0 | 65 | 33 |
| C | 0 | 65 | 33 |
| D | 0 | 66 | 30 |
| Quadrant | Total seconds | Saturated seconds | Saturation percentage |
|---|---|---|---|
| A | 1324 | 109 | 8.232628% |
| B | 1547 | 42 | 2.714932% |
| C | 1554 | 30 | 1.930502% |
| D | 1551 | 49 | 3.159252% |
Noise dominated data is calculated using 1-second bins in cleaned event files. If a bin has >2000 counts, and if more than 50% of those come from <1% of pixels, then it is considered to be noise-dominated and hence unusable.
| Quadrant | # 1 sec bins | Bins with >0 counts | Bins with >2000 counts | High rate bins dominated by noise | Noise dominated (total time) | Noise dominated (detector-on time) | Marked lightcurve |
|---|---|---|---|---|---|---|---|
| A | 3837 | 1602 | 22 | 22 | 0.57% | 1.37% | 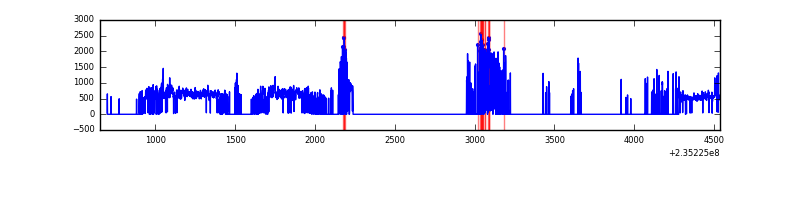 |
| B | 3883 | 1880 | 6 | 6 | 0.15% | 0.32% | 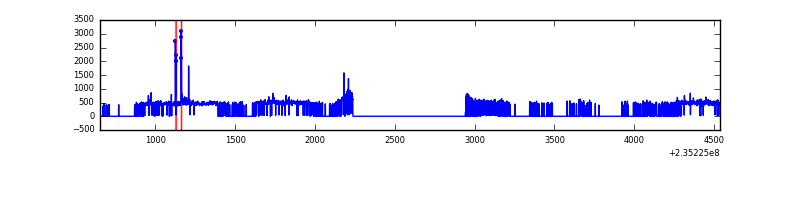 |
| C | 3860 | 1886 | 1 | 1 | 0.03% | 0.05% | 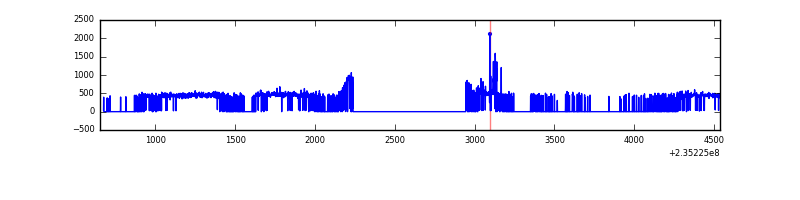 |
| D | 3856 | 1871 | 12 | 12 | 0.31% | 0.64% | 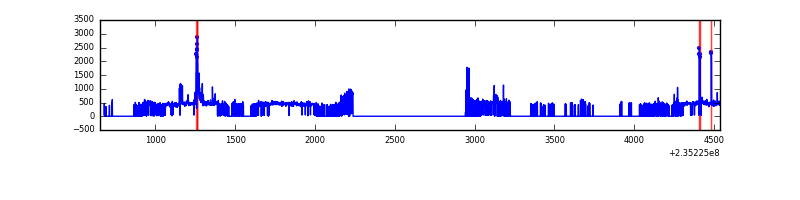 |
Top three noisy pixels from each quadrant. If the there are fewer than three noisy pixels in the level2.evt file, extra rows are filled as -1
| Pixel properties | Quadrant properties | ||||||
|---|---|---|---|---|---|---|---|
| Quadrant | DetID | PixID | Counts | Sigma | Mean | Median | Sigma |
| A | 8 | 5 | 317593 | 8935.67 | 163 | 160 | 35.5 |
| A | 5 | 16 | 45798 | 1284.7 | 163 | 160 | 35.5 |
| A | 13 | 251 | 8015 | 221.12 | 163 | 160 | 35.5 |
| B | 0 | 214 | 32168 | 796.81 | 195 | 190 | 40.1 |
| B | 12 | 111 | 4230 | 100.67 | 195 | 190 | 40.1 |
| B | 11 | 111 | 3338 | 78.44 | 195 | 190 | 40.1 |
| C | 14 | 234 | 19557 | 421.16 | 188 | 189 | 46.0 |
| C | 13 | 61 | 1487 | 28.23 | 188 | 189 | 46.0 |
| C | 8 | 222 | 968 | 16.94 | 188 | 189 | 46.0 |
| D | 2 | 136 | 56511 | 1174.57 | 187 | 181 | 48.0 |
| D | 1 | 52 | 31639 | 655.95 | 187 | 181 | 48.0 |
| D | 12 | 233 | 11898 | 244.32 | 187 | 181 | 48.0 |
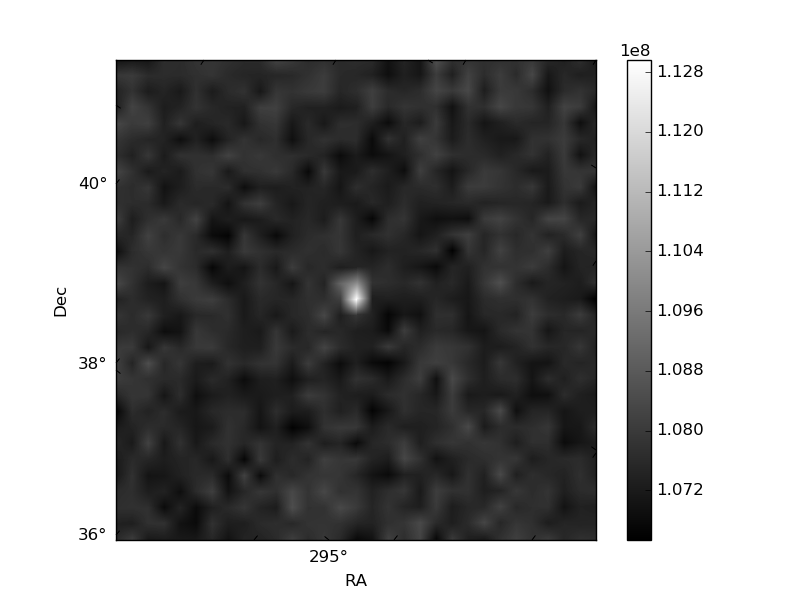
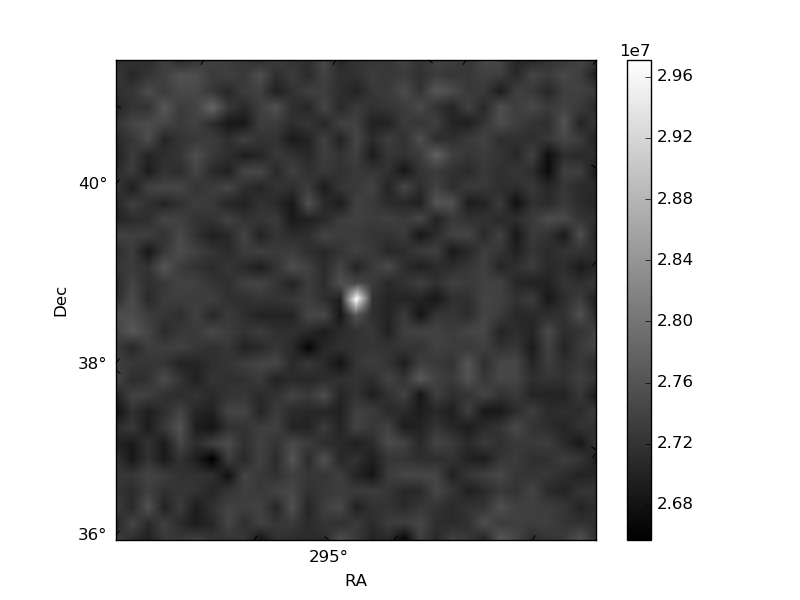
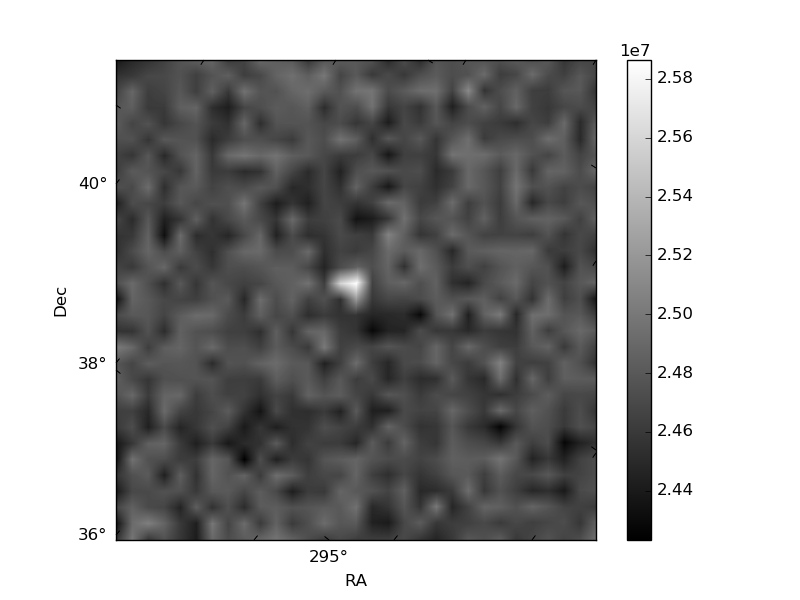
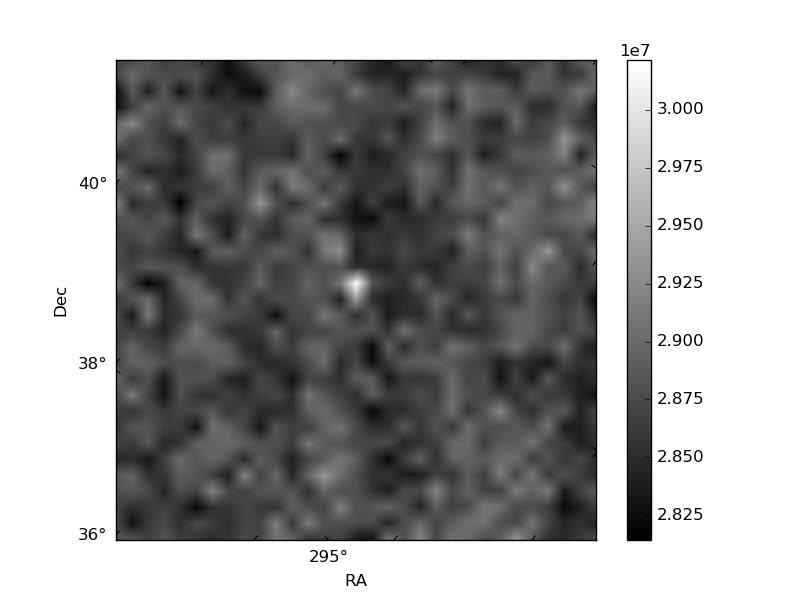
Histogram calculated using DETX and DETY for each event in the final _common_clean file
| Quadrant A | 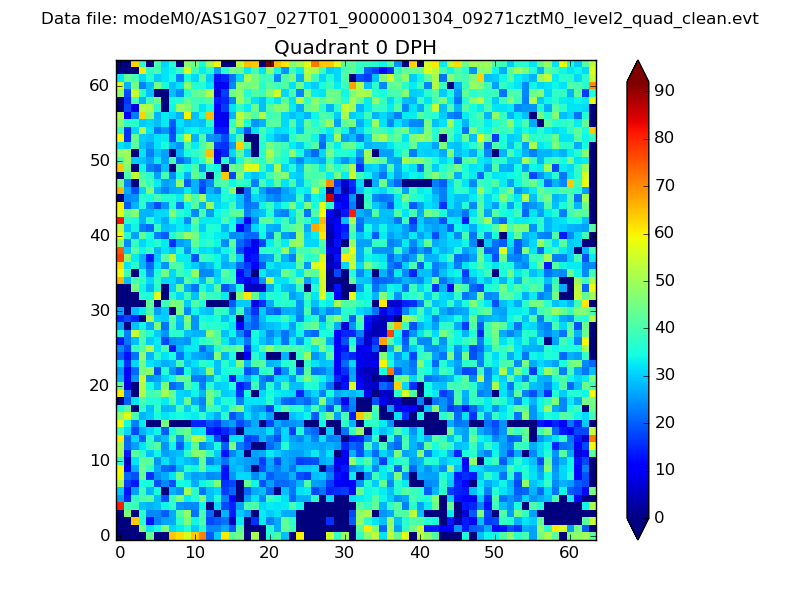 |
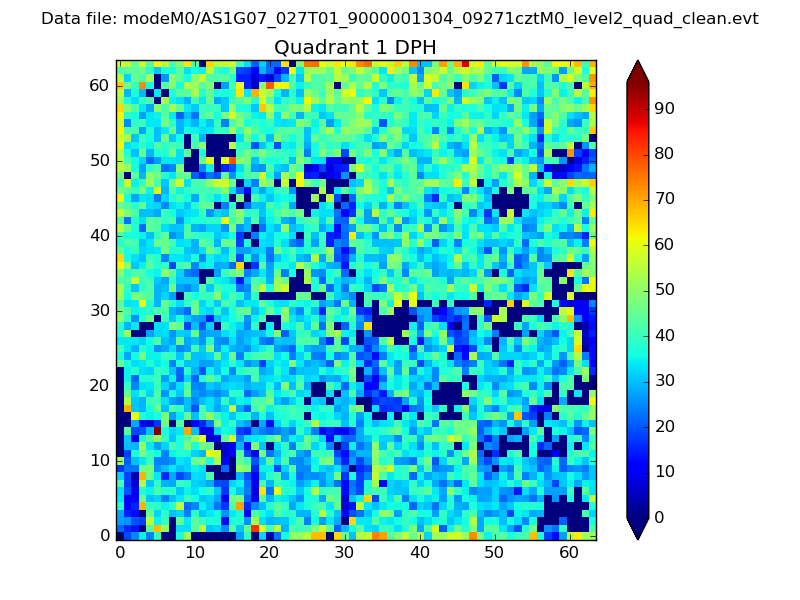 |
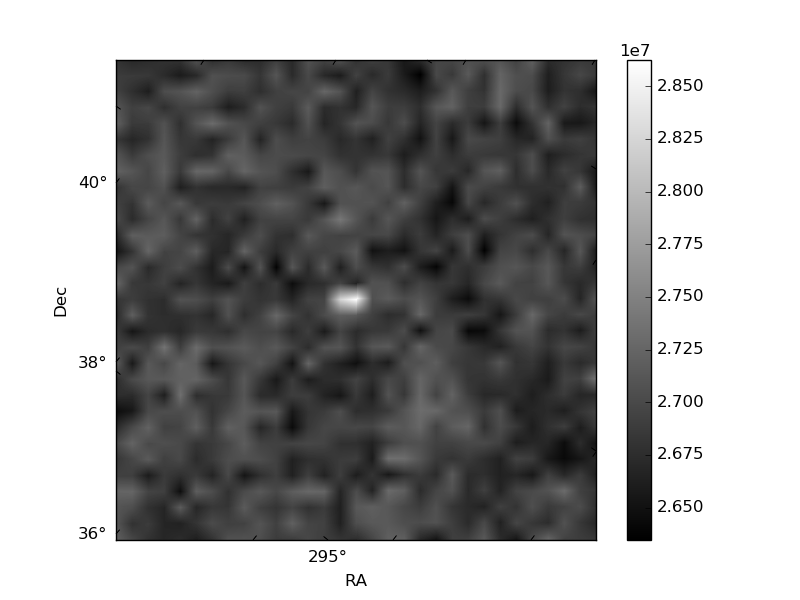
Quadrant B |
|---|---|---|---|
| Quadrant D | 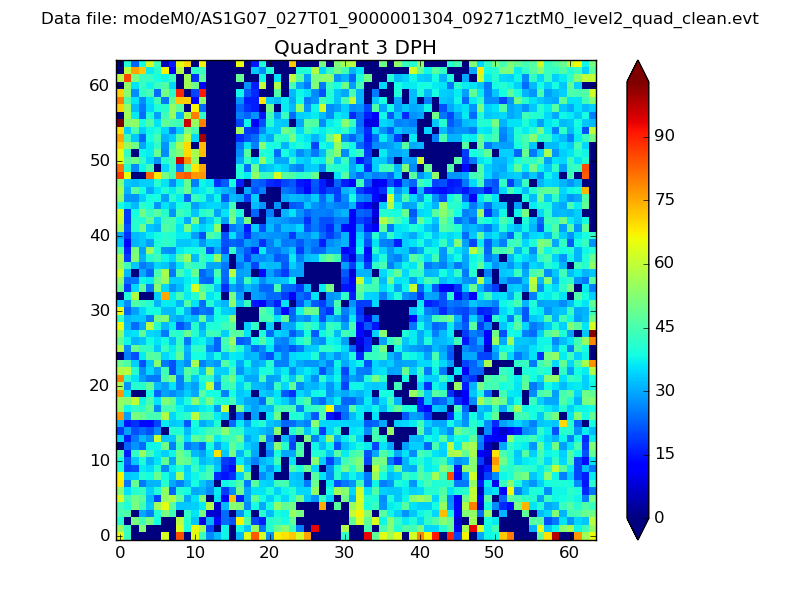 |
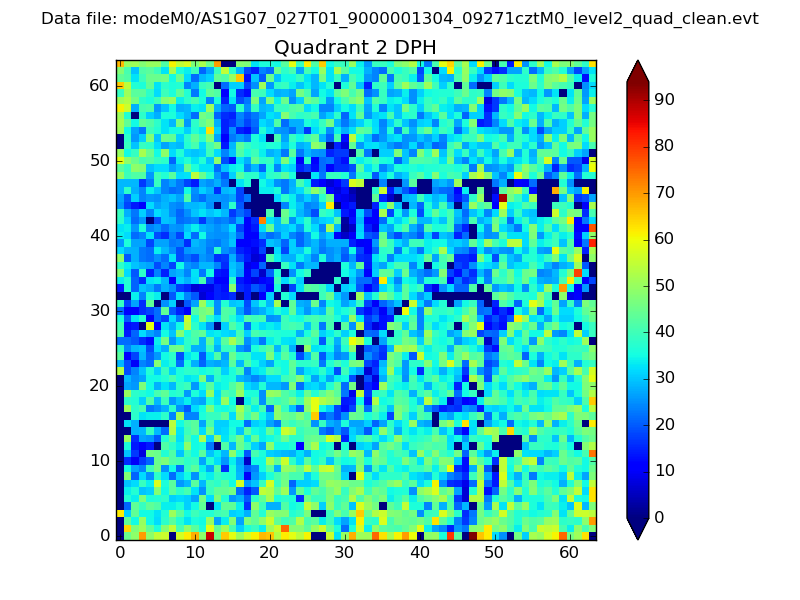 |
Quadrant C |
| Plot type | Count rate plots | Images |
|---|---|---|
| Comparison with Poisson distribution Blue bars denote a histogram of data divided into 1 sec bins. Red curve is a Poisson curve with rate = median count rate of data. |
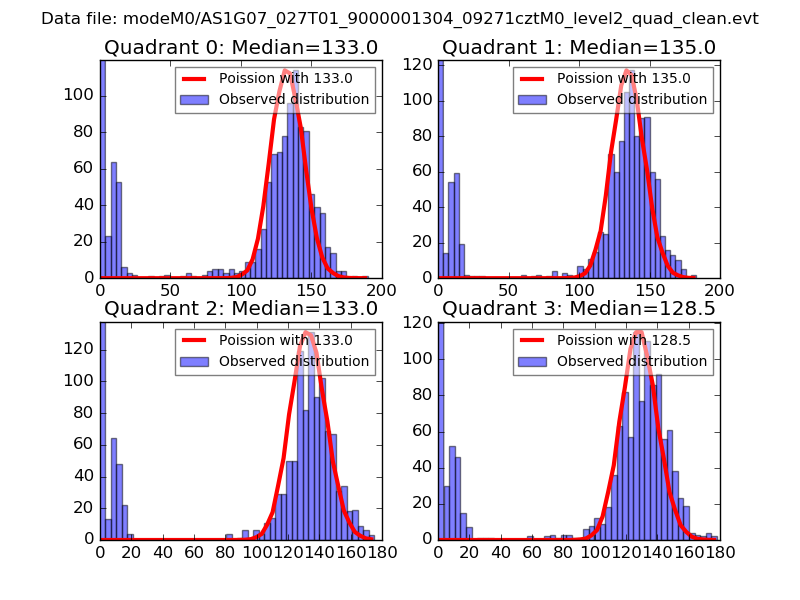 |
 |
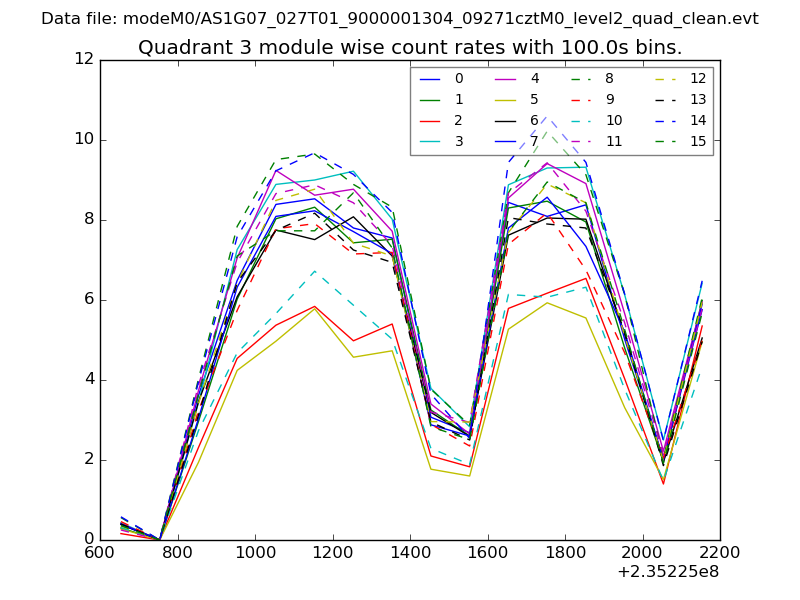
| Quadrant-wise count rates Data is divided into 100 sec bins |
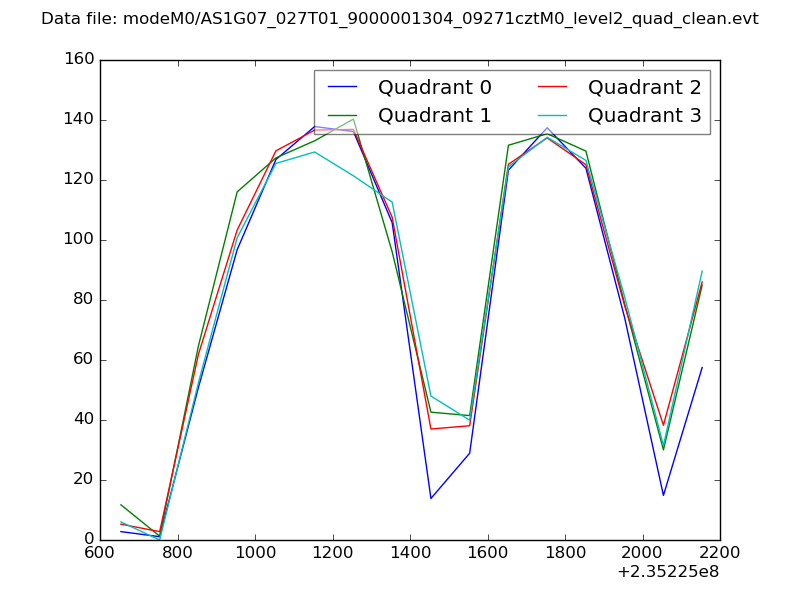 |
|
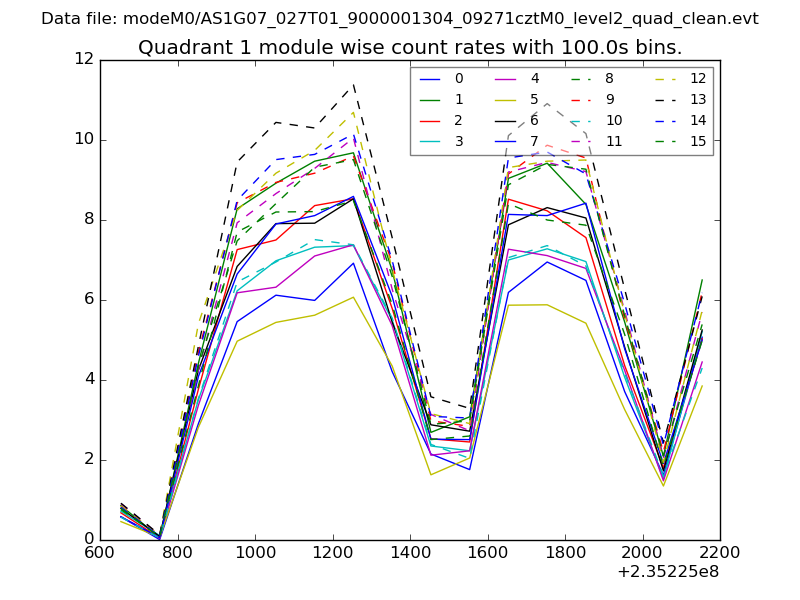
| Module-wise count rates for Quadrant A Data is divided into 100 sec bins |
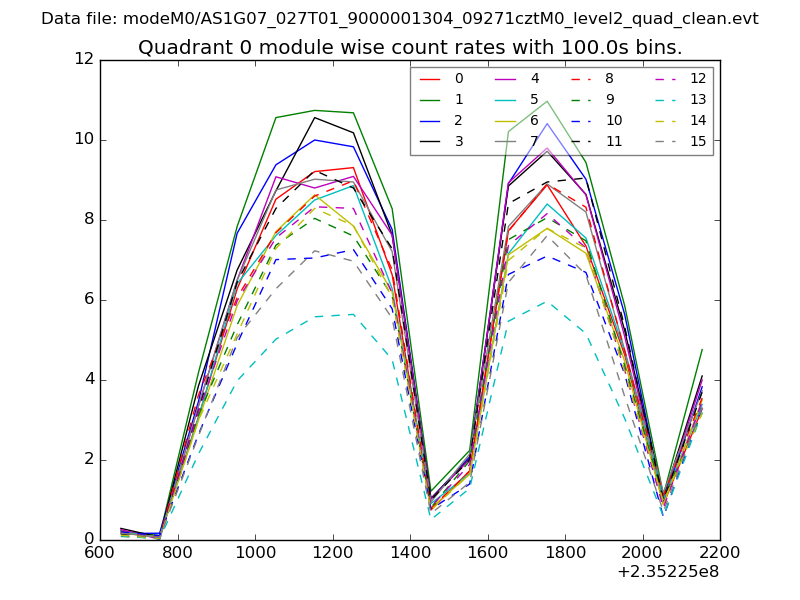 |
 |
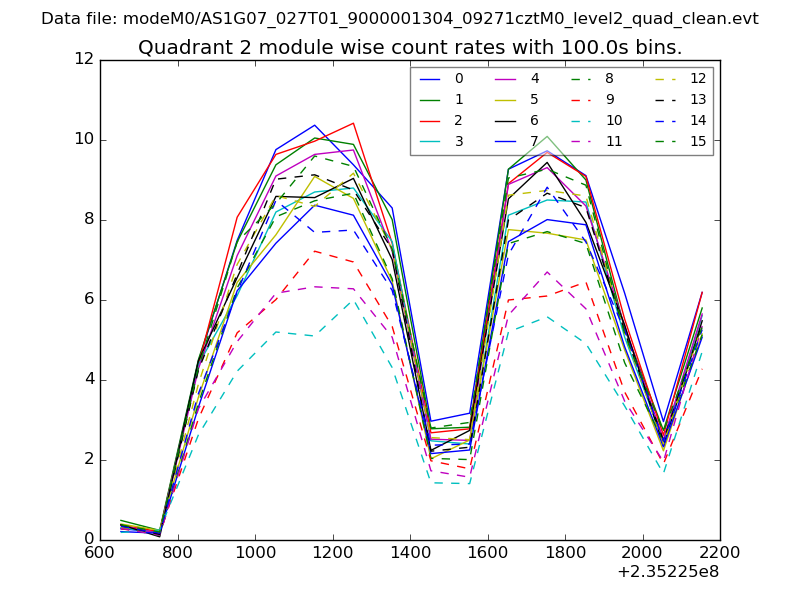
| Module-wise count rates for Quadrant B Data is divided into 100 sec bins |
 |
 |
| Module-wise count rates for Quadrant C Data is divided into 100 sec bins |
 |
 |
| Module-wise count rates for Quadrant D Data is divided into 100 sec bins |
 |
 |
| Parameter | Plot |
|---|---|
| CZT HV Monitor | 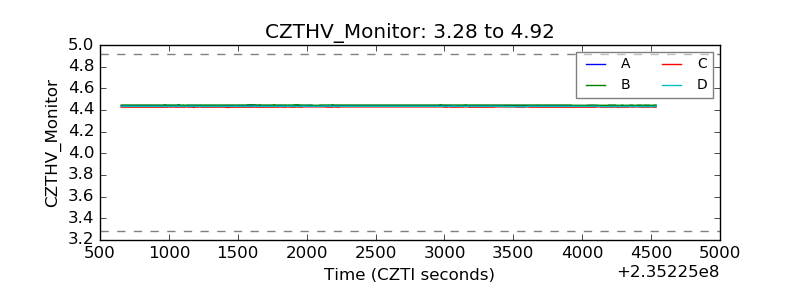 |
| D_VDD | 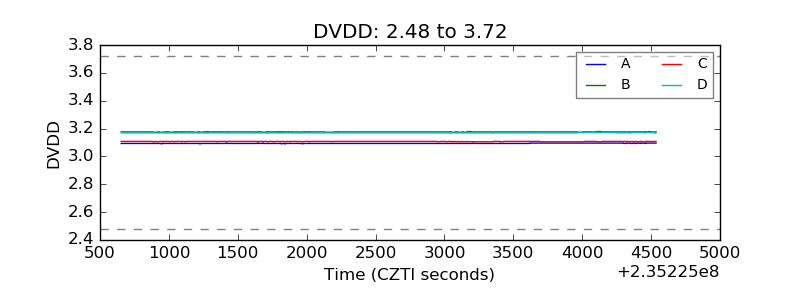 |
| Temperature 1 | 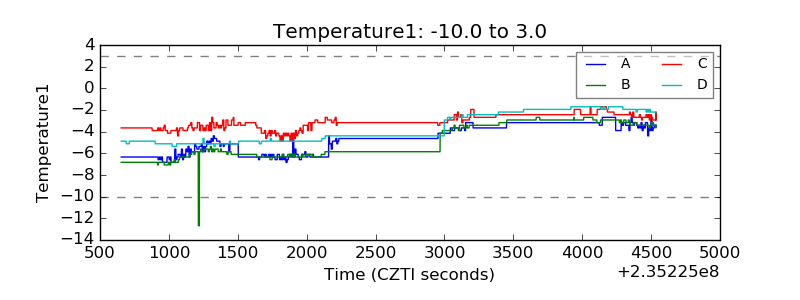 |
| Veto HV Monitor | 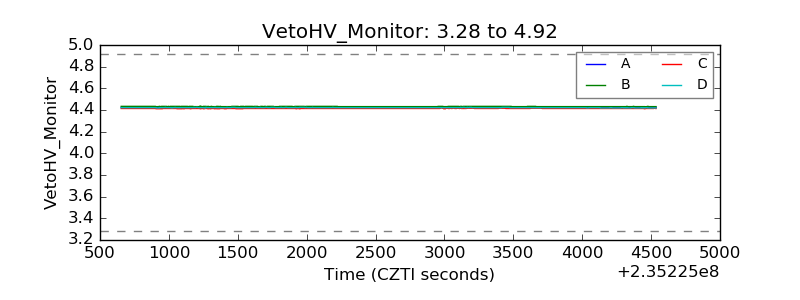 |
| Veto LLD | 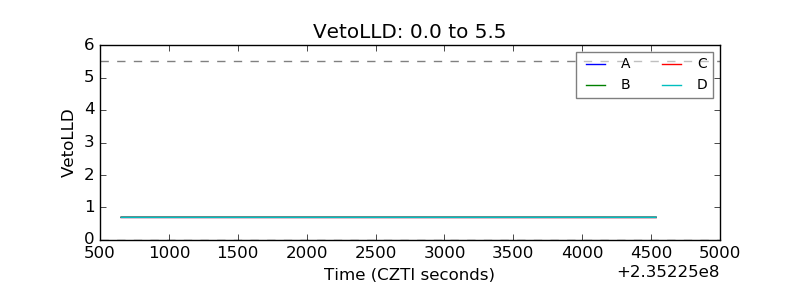 |
| Alpha Counter | 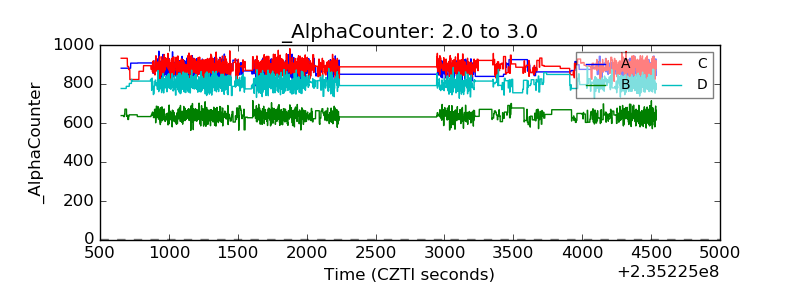 |
| _CPM_Rate | 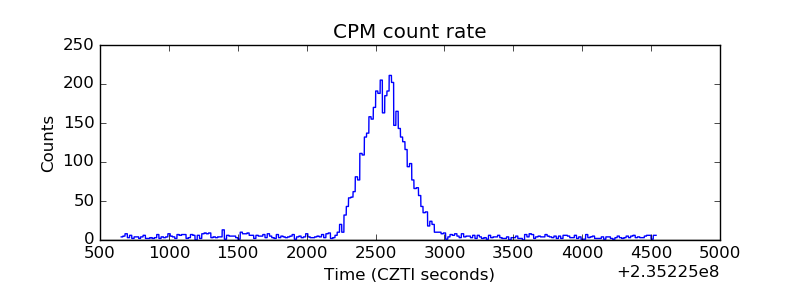 |
| CZT Counter | 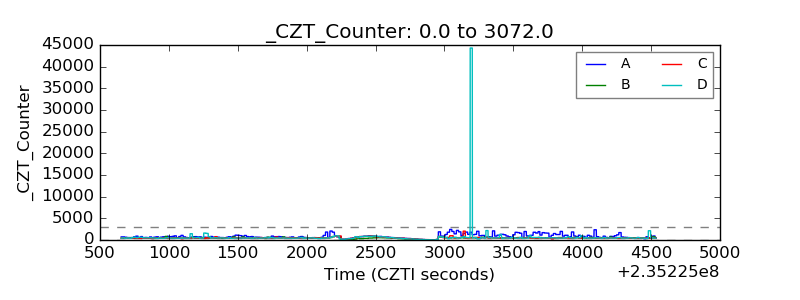 |
| +2.5 Volts monitor | 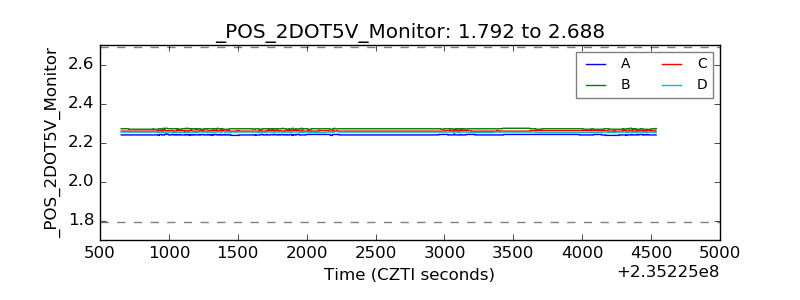 |
| +5 Volts monitor | 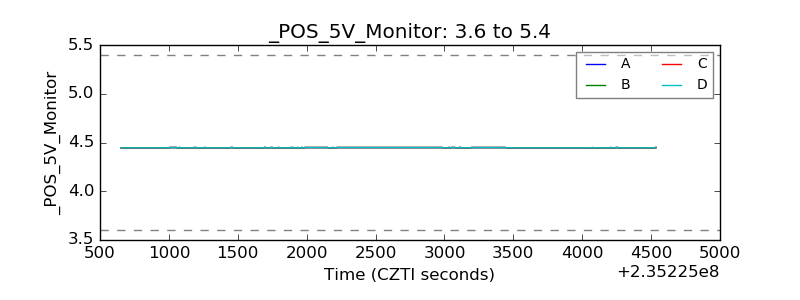 |
| _ROLL_ROT | 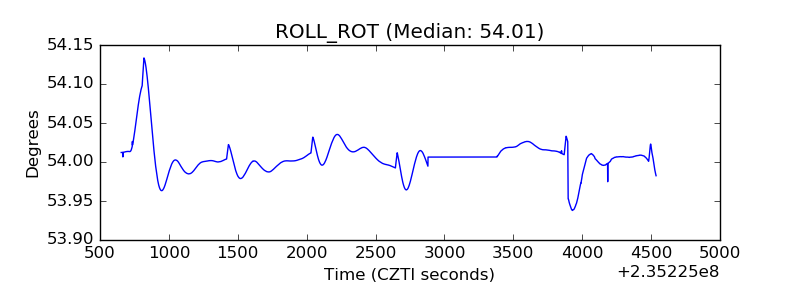 |
| _Roll_DEC | 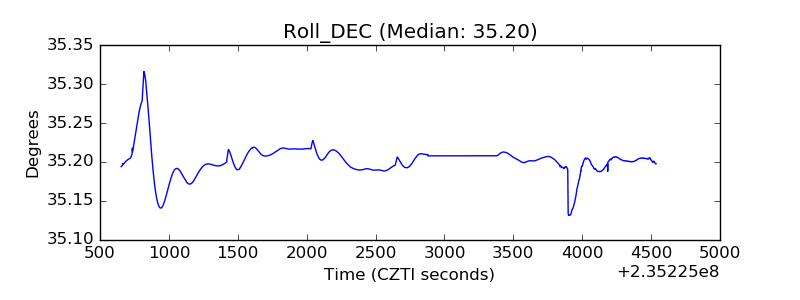 |
| _Roll_RA | 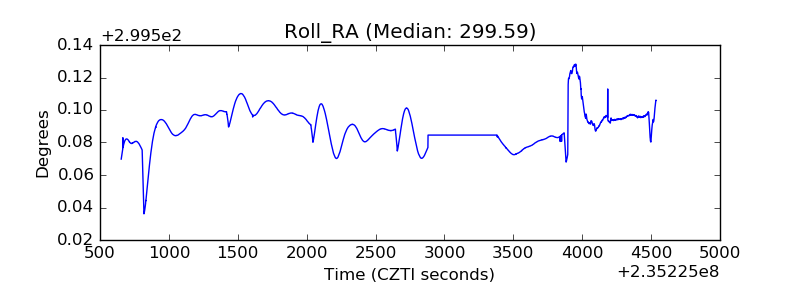 |
| Veto Counter | 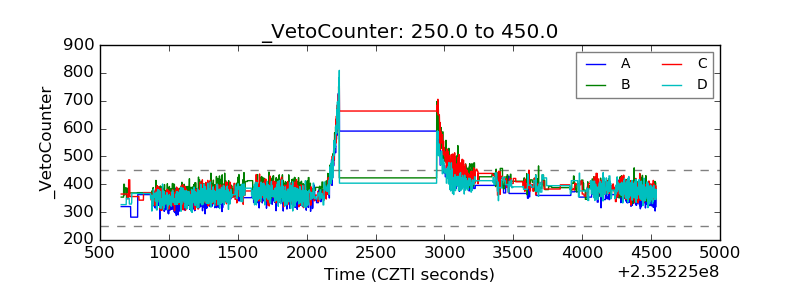 |